
XRP is one of the top altcoins at the time of writing. However, it is not exempt from the current market-wide selling pressure.
Undoubtedly, the crypto market is well into its bearish run. It is seeing massive declines in several areas, especially its appeal to new investors. Trading volume has since declined significantly, as liquidity has left the sector.
However, one area many overlook is the effect on the altcoin market. A recent report stated that altcoin trading volume has declined significantly since the sector went fully bearish. As of Mar. 19, the trading volume was $7.7 billion on Binance and $18.8 billion on other major exchanges.
The latest figures are a far cry from what was seen in October and February 2025. Binance posted volumes of $40 billion and $50 billion during this period, as other exchanges recorded $63 billion and $91 billion, respectively.
Some may argue that the highlighted readings represent periods when the market experienced significant FOMO as cryptocurrencies reached new highs, but a closer look at the average shows a different picture.
The chart above shows that the altcoin market saw notably higher trading volume between February and early October, compared to after. In a nutshell, volume massively declined over the last five months.
In response to the drop in volume, there are speculations that several major altcoins may be heading for historical lows. Some are predicting an XRP drop below $1.
Current XRP Onchain Analysis
As of Mar 19, a report from CryptoQuant cited a significant decline in open positions on XRP. It stated a 24% drop and perp CVD negativity at the time.
The decline in OI occurred between Mar 12 and 19, causing all CEX perpetual CVDs to flip negative. The readings suggest that the asset was seeing notable bearish actions in derivatives. With sell pressure mounting from this sector, it points to one thing: derivatives traders are closing their positions.
Their actions followed the first two days of the downtrend, during which the altcoin saw significant rejection at $1.60. By Wednesday, it had lost almost 5% cumulatively.
However, amid negative actions by derivatives traders, investors in the spot market are doing the opposite. The highlighted report stated that the spot showed no signs of panic as no table accumulation continued.
The readings are still the same as of this writing. Spot traders continue to accumulate, as evidenced by the declining exchange reserves.
Nonetheless, current price action suggests that derivatives are having a stronger effect. XRP saw another notable decline on Sunday, marking the sixth day of a downtrend.
In hindsight, the altcoin may end the week down by more than 4%. A closer look at the chart also shows it has erased more than half of last week’s gains.
The 1-day shows that the latest round of decline began after the breakout from the bollinger bands. It is trading below the middle band at the time of writing, after shedding over 9% in the last five days.
What’s Next For XRP?
Aside from onchain indicators, there are other telling signs of further declines. Since slipping below the SMA, XRP has been heading toward the lower band.
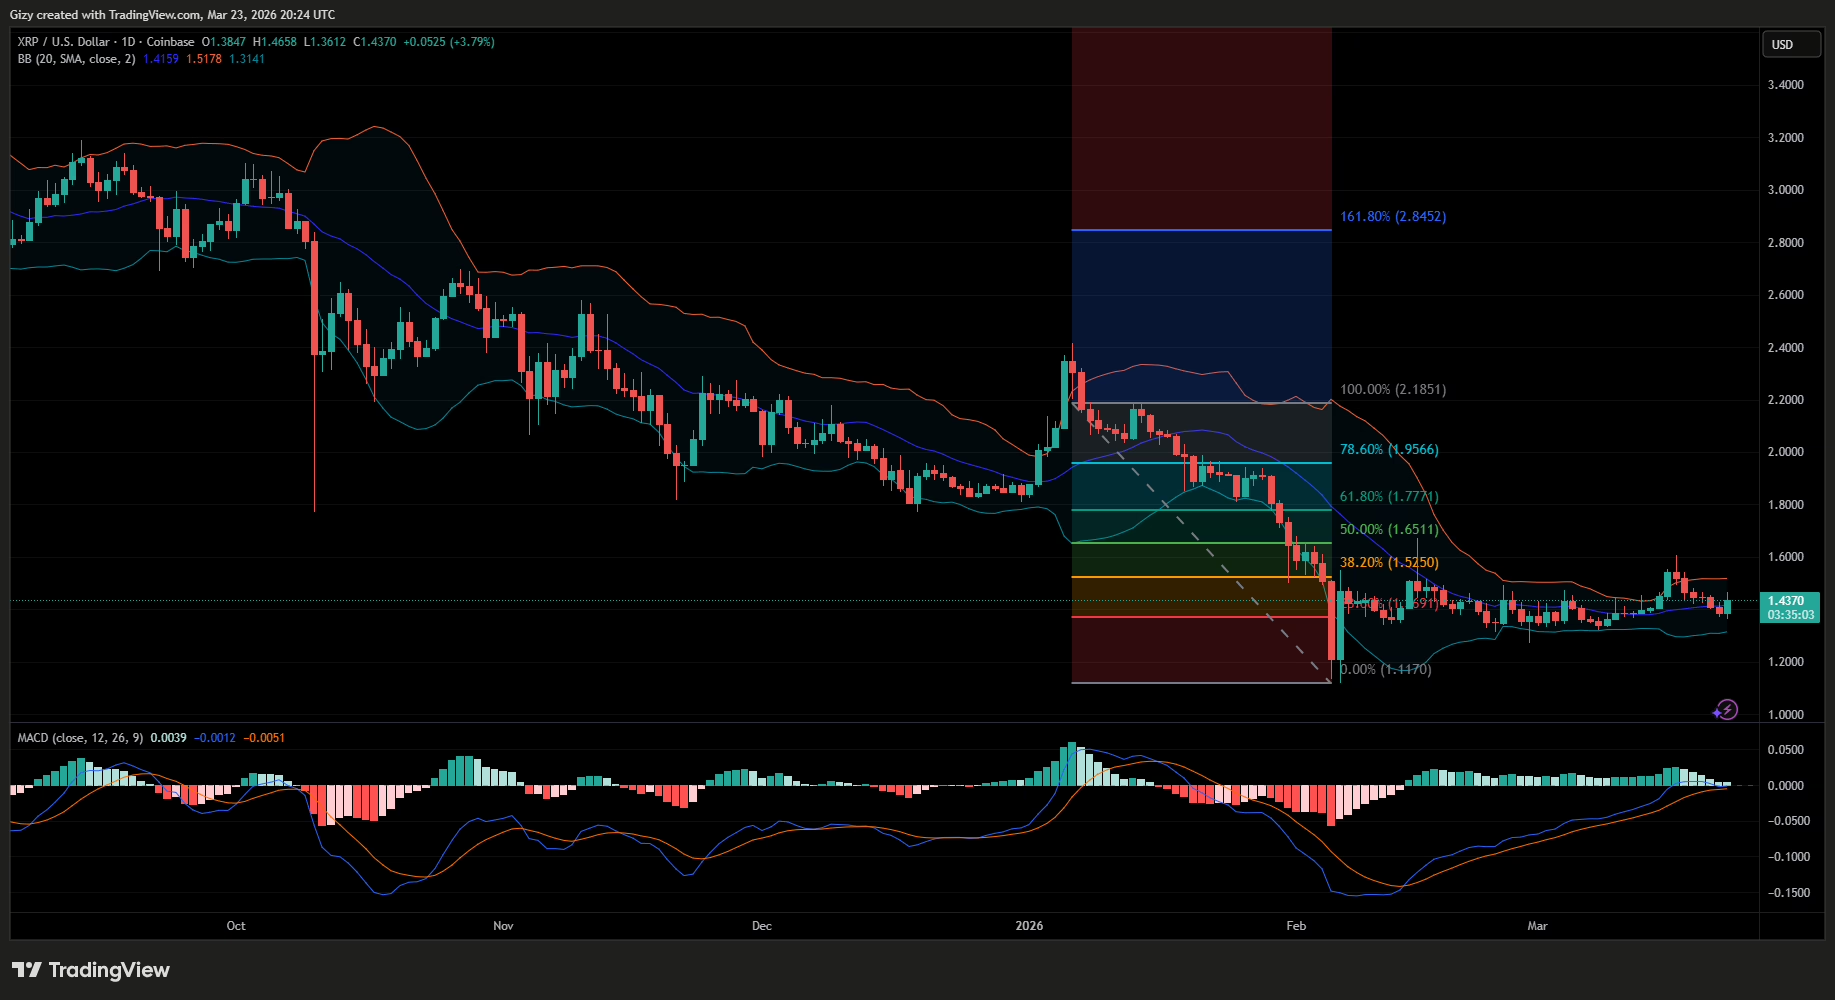
Additionally, the moving average convergence divergence is currently printing sell signals at the time of writing. The 12-EMA halted its uptrend last week and is now in a downtrend. The trend shows proximity to the 26-EMA, suggesting a bearish crossover may occur.
A closer look at the average directional index shows that the assets may be preparing for further decline. It is worth noting that this indicator surges when prices trend downwards. Since October, it has rebounded around 17.
The same trend repeated last week: before prices peaked, the metric rebounded to roughly the same level. The ensuing decline caused the indicator to surge. Based on previous movements, the ADX will surge higher in the coming days.
With almost all indicators on the 1-day chart pointing to further decline, the Fibonacci retracement level points to a possible bottom. Recall that for most of the past 30 days, XRP has trended above 23%. Last week, it briefly broke out.
At the time of writing, the altcoin is trading below the 38% fib level. If the bulls fail to defend the 23% mark, it may retrace as low as $1.20.
A closer look at the chart offers more reasons to expect further decline. Recall that during the February downtrend, XRP created a fair-value gap that stretched to $1.12. The asset may fill this FVG during this bearish round.
1-Week Chart Suggests Massive Uptrend Afterward
Interestingly, the indicators on the 1+week timeframe are currently flipping bullish. For example, MACD is currently close to a bullish crossover. A closer look at the histogram shows the tiniest bars as the gap between the 12- and 26-EMA narrows.
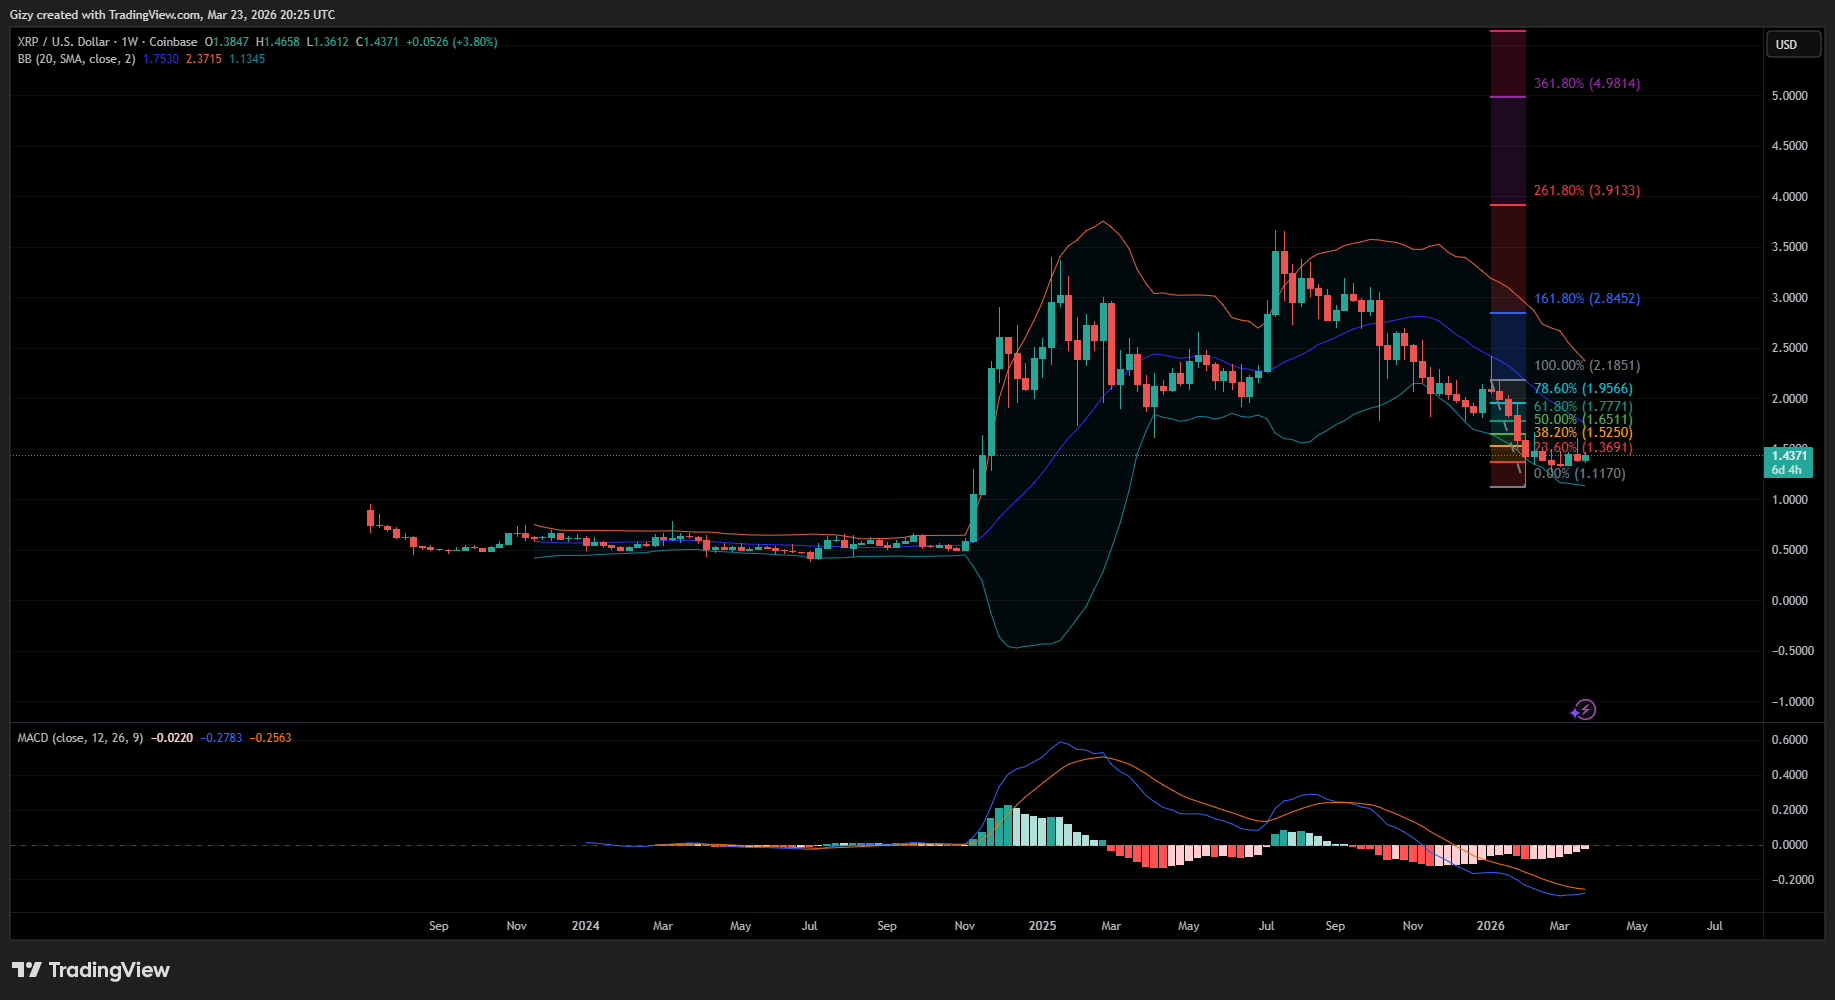
Additionally, the asset is yet to surge after testing Bollinger’s lower band. Instead, it has been mostly range-bound for an extended period.
Aside from these two indicators, the ADX has also reached one of its highest points and is due for correction.
Combining the readings from both timeframes indicates that although XRP will see a notable decline in the coming days, the chances of massive rallies afterward remain significantly high. This time, the asset may surge as high as $1.80.


