
DOGE is currently trading above the $0.10 support, but came close to flipping it a few hours ago. It continues to grapple with slight pressure.
Nonetheless, the selloff slowed on Tuesday compared to the previous day. It appears DOGE may hold critical support for another day if prices remain unchanged.
Selling has significantly reduced across the market over the last 24 hours. The global cryptocurrency market is $2.53 trillion and prints a doji at the time of writing. It also posted a higher low, which may in indicate a notable increase on Wednesday.
The US Fed governor’s speech may provide the fuel for the first green after five days of consistent decline. Aside from the speech, there are no major events scheduled for Wednesday. Nonetheless, the Iranian-US conflict may make the headlines.
Away from fundamentals, indicators on the 4-hour chart are flipping positive, aligning with predictions of an uptick within the next 24 hours.
Nonetheless, altcoins were on the move on Tuesday. One such is VVV, which has gained a whopping 13%. It peaked at $17.6, a few cents shy of $18. Previous price movements suggest the asset may continue to rise, retesting $19 this week. MemeCore follows behind, surging by over 11%.
Let’s see what the rest of the week holds for assets in the top 10.
BTC/USD
Bitcoin was almost oversold on the 4-hour chart on Monday. It recovered sharply but has since been range-bound, trading between $76.2k and $77.3k.
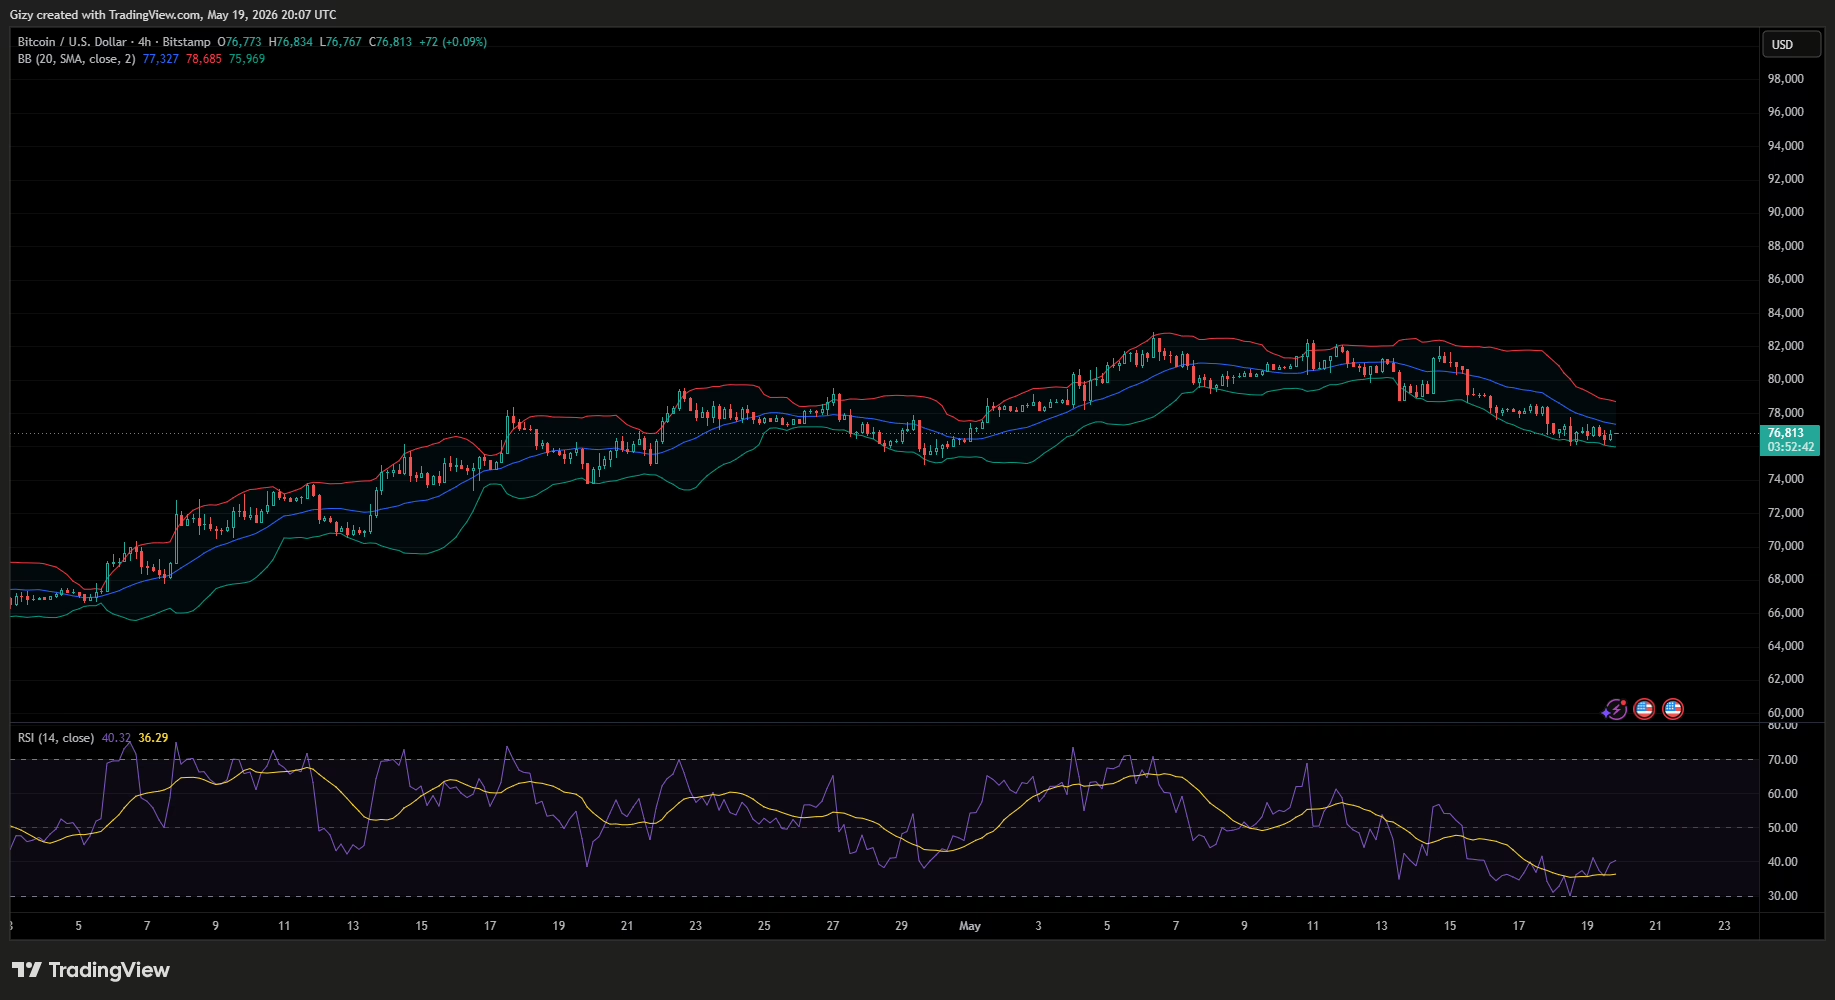
Nonetheless, selling pressure at $76,900 has increased slightly. While the sideways trend over the last few hours may indicate an impending breakout, given that it followed a significant decline, the expanding sell zone suggests the asset is still grappling with notable selling pressure.
Notwithstanding, the relative strength index is currently at 36, a few clicks from the asset being oversold. The asset may see further upward movement in the coming hours.
Aside from RSI, BTC is also trading close to bollinger’s lower band. It tested the mark on Monday and rebounded. Following its rebound, it will look to reclaim the middle band at $77,300. A surge to the upper may follow.
Interestingly, the bullish prediction is also present on the 1-day scale. Bitcoin posted a higher low compared to the previous session. The bulls will look to continue the trend on Wednesday, possibly printing the first green after five days of consistent decline.
ETH/USD
Between Sunday and Monday, Ethereum rebounded near $2,075 twice. It was rangebound and bounced off another level of notable demand concentration.
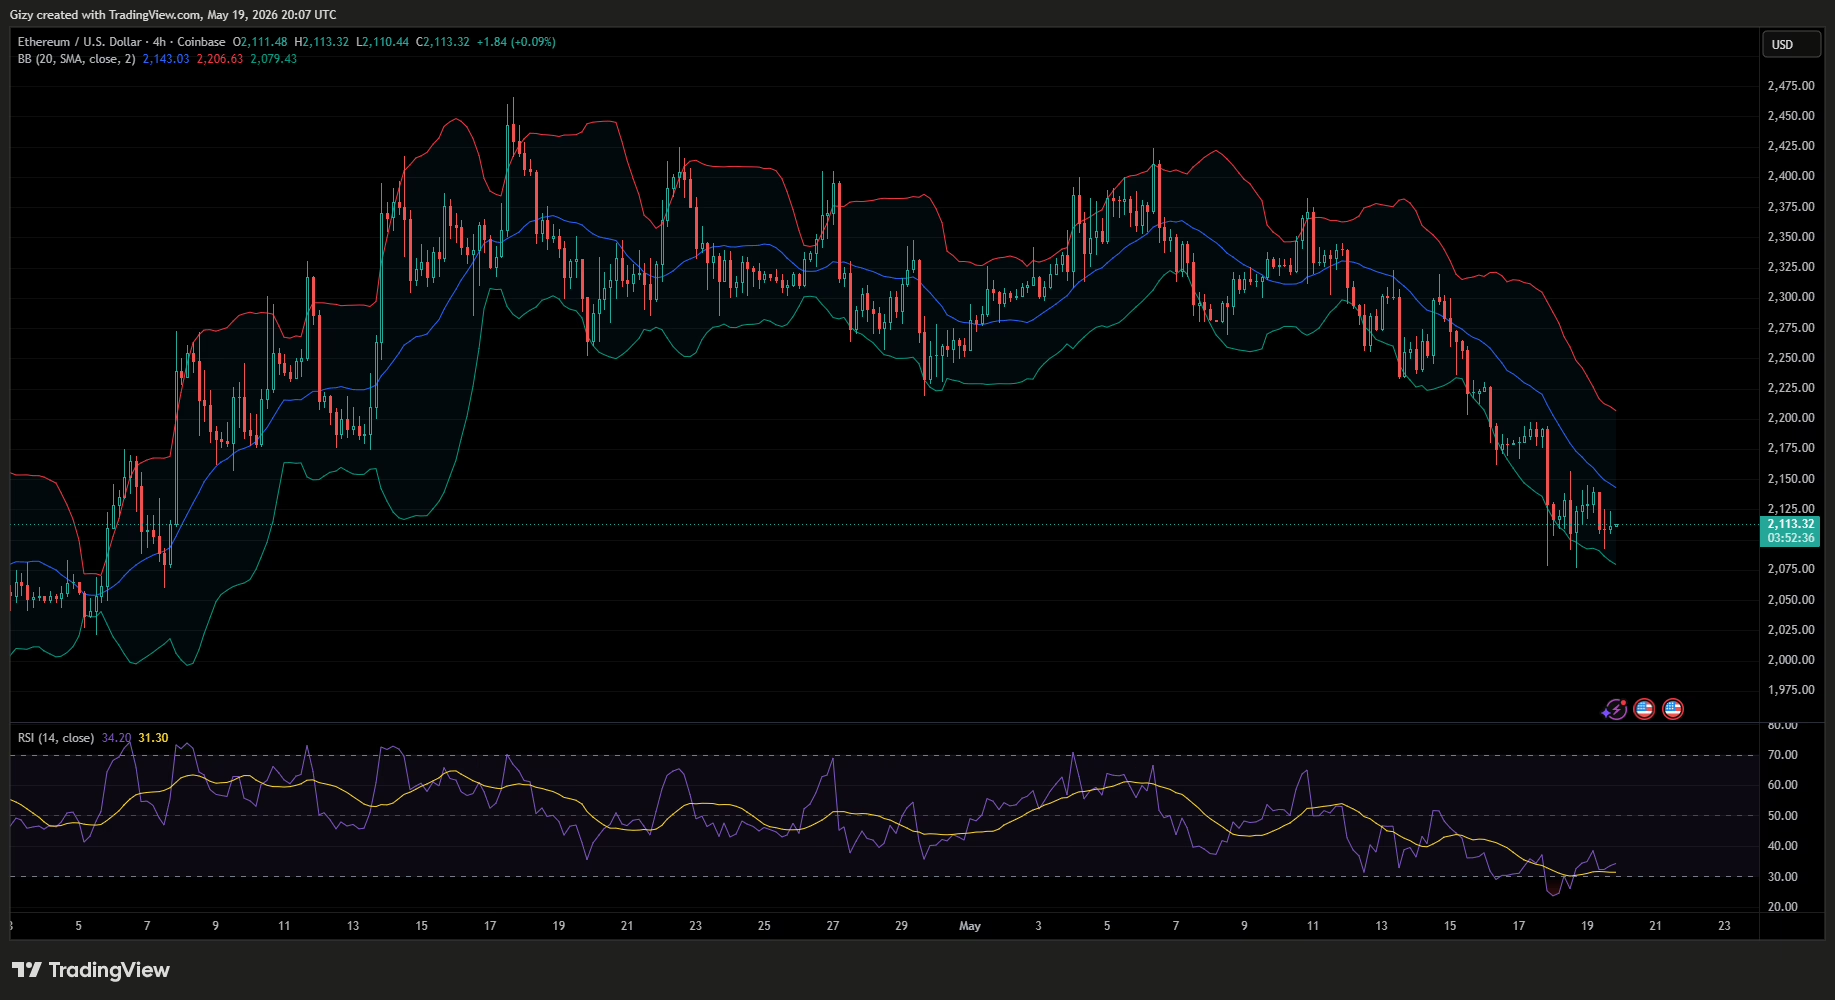
Interestingly, it was oversold during the weekend. It saw a wave of buying pressure that may increase in the coming hours. Its recent sideways movement suggests it is gearing up for further upward movement.
Nonetheless, the altcoin may struggle to break above $2,140. Previous price movement shows significant selling pressure at this mark. Interestingly, it is also where bollinger’s middle band lies. If it breaks above it, ETH will retest $2,200. However, if it fails, the asset will continue its sideways trend.
BNB/USD
Like DOGE, BNB’s selling is also slowing. It has since found support around $637 and traded close to it for most of the week. Adding to this barrier’s strength is the 200 MA, which is trending slightly higher.
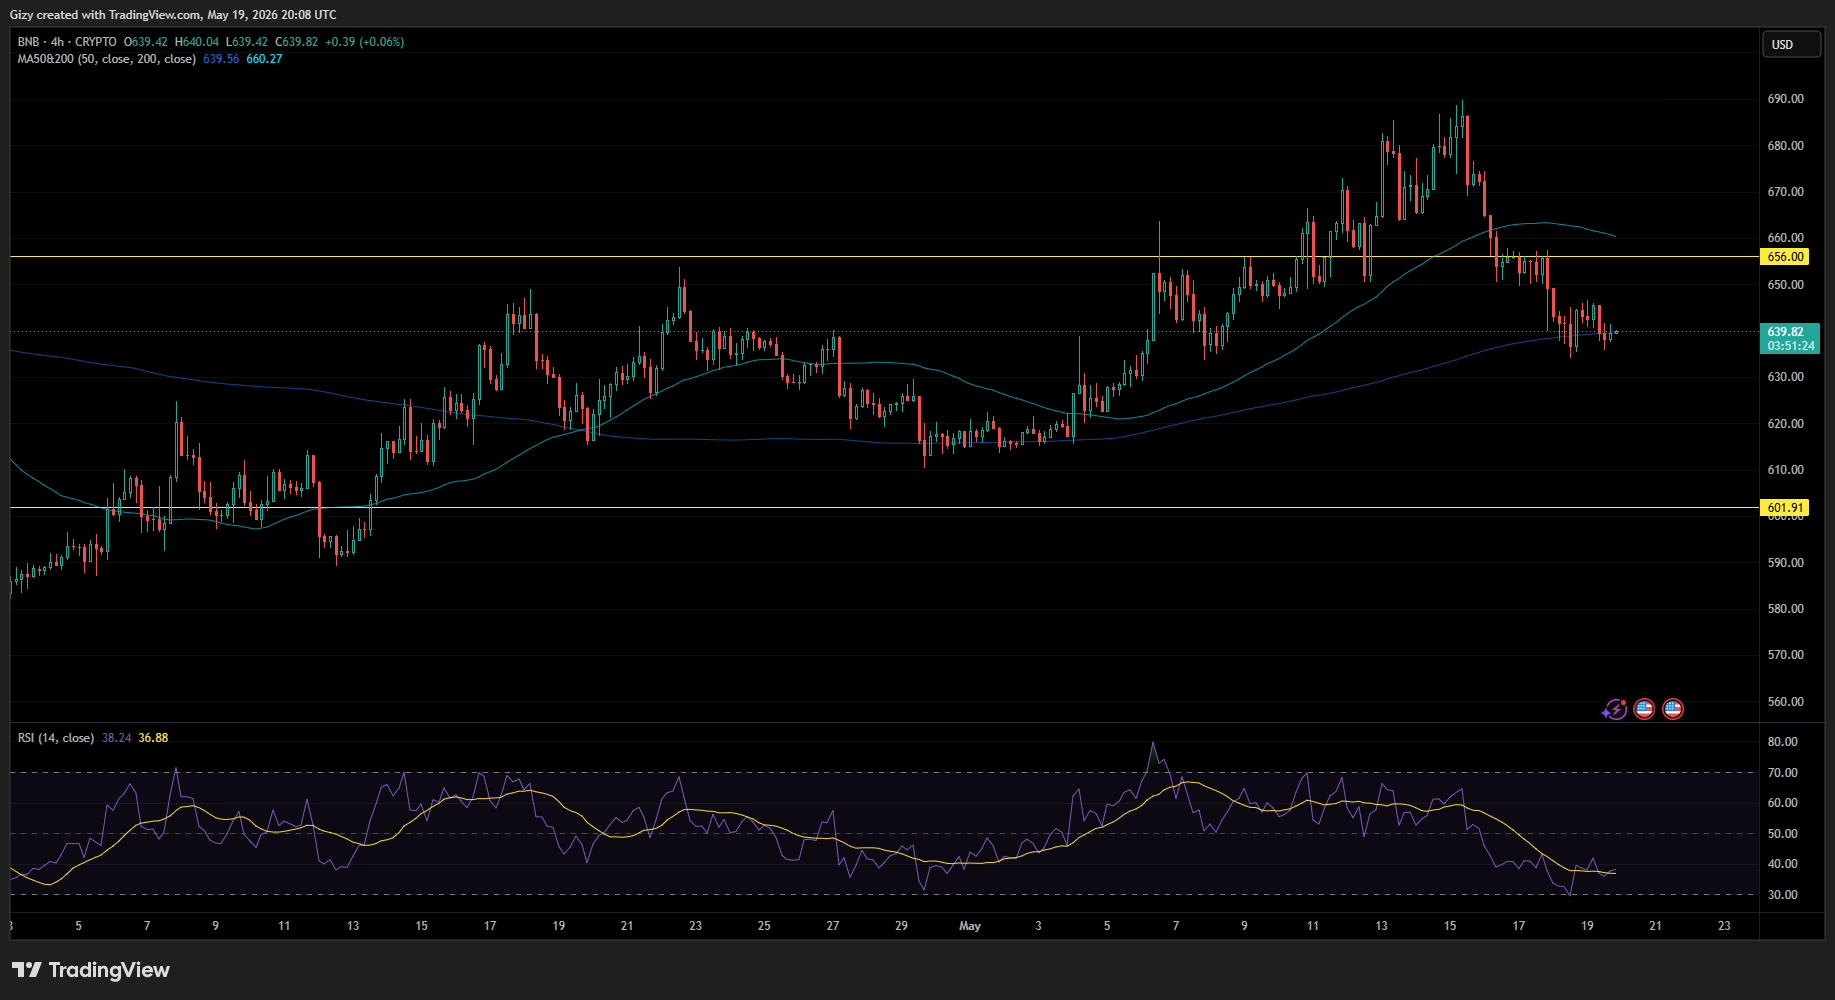
After several days of holding the level, the asset is gearing up to surge higher. The relative strength index, which has trended around 37 for an extended period after slipping below 30, is proof of this.
BNB will attempt to flip $645. Previous price movements suggest that decisively flipping the mark will be the gateway to $660. The likelihood of breaking this resistance increases, given that MACD is currently in bullish convergence.
XRP/USD
XRP may slip a little lower in the coming hour. It is currently trading at $1.35 and printing a green candle, but previous price action suggests the downtrend is not over.
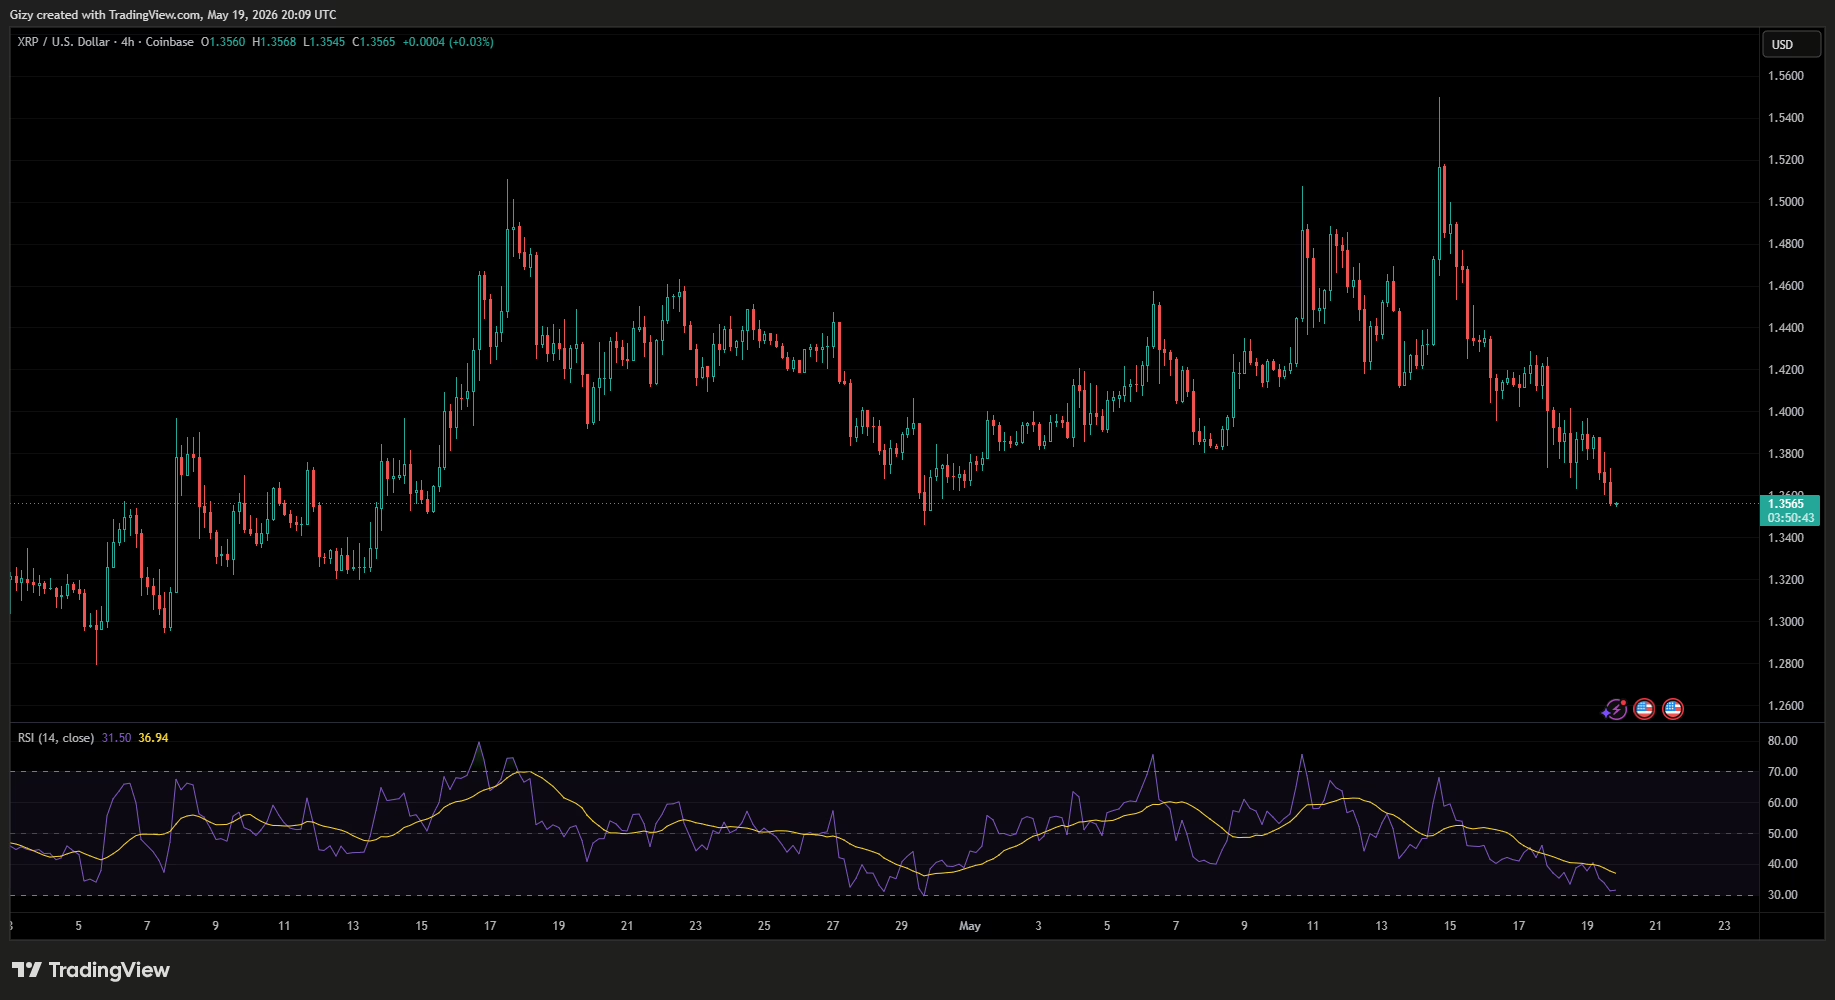
Since Apr 17, it retraced and rebounded around $1.34. This may be the next stop for XRP. However, after bouncing off support, the altcoin will likely surge. After previous retests, it went on to retest $1.40.
The 1-day chart aligns somewhat with this prediction, as the highlighted support is also in place and the asset is fast approaching it. Like DOGE, XRP is also trading below the 50 MA. It will look to reclaim the mark in the coming days, after rebounding at $1.34.
SOL/USD
On the 1-day chart, Solana has posted higher lows over the last two days. It attempted a recovery during the previous intraday session but failed, and it resumed its downtrend a few hours ago.
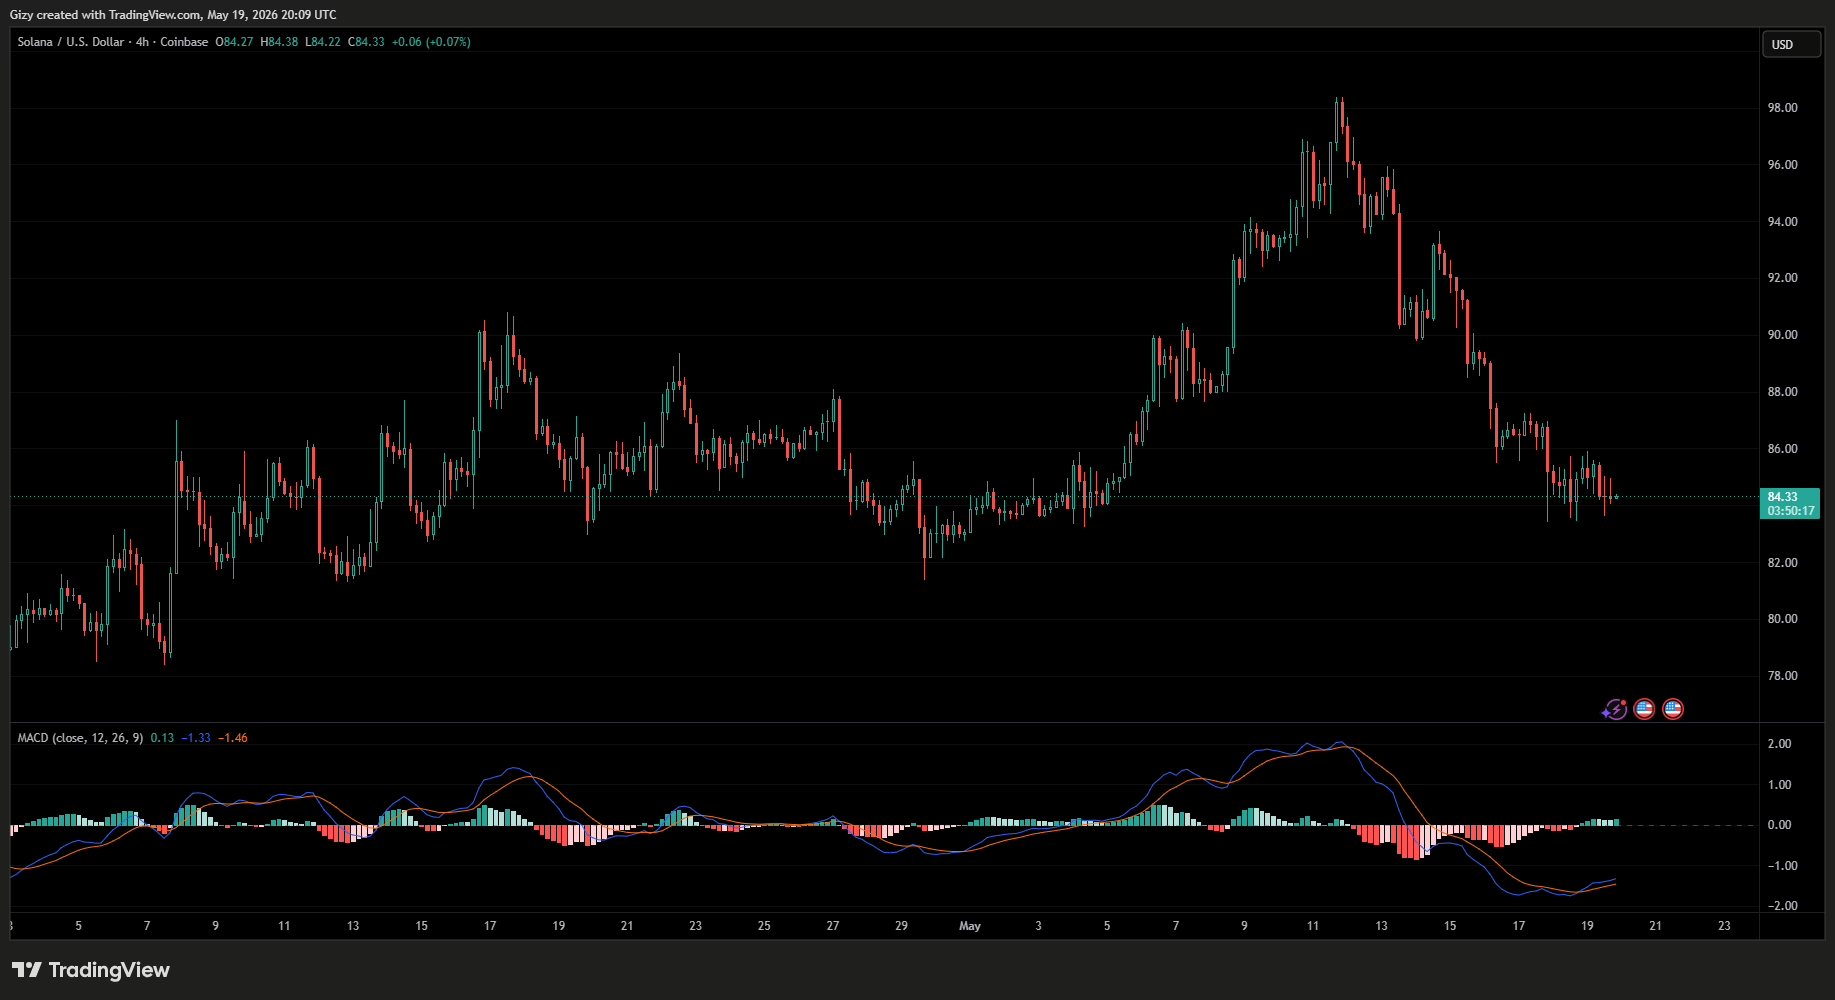
However, it maintained the trend of posting higher lows on Tuesday. Following its recent rebound, the moving average convergence divergence printed a positive crossover. The asset may surge higher on Wednesday, maintaining its 1-day trend.
Additionally, SOL will likely retest $86 within the next two days. The likelihood of a surge retest spike given that 52 VWMA trends near it.
DOGE/USD
On the 1-day scale, DOGE prints a small candlestick representing Tuesday’s trading action. Nonetheless, it also posted a higher low. With selling slowing down, it may be gearing up for a significant upward push.
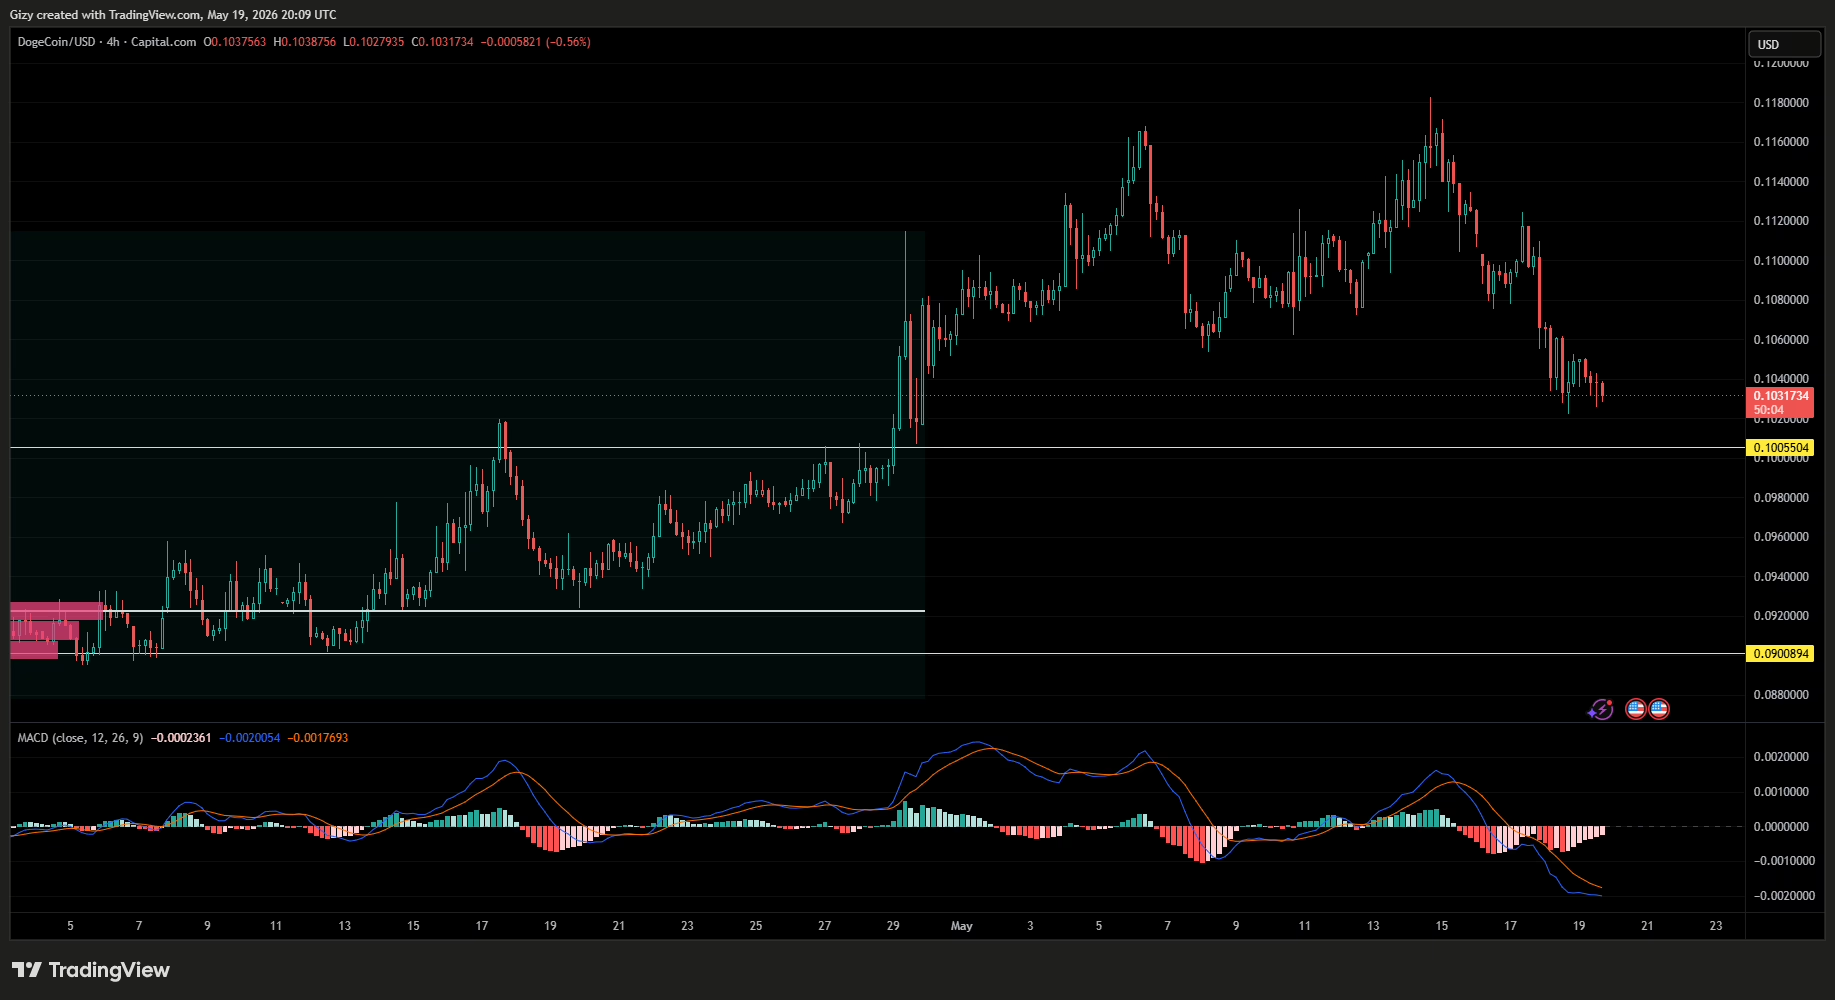
This is the same sentiment on the 4-hour chart. It continues trading above $0.102 at the time of writing. A demand zone is also forming close to current prices. However, the memecoin is not in the clear.
Previous price movements suggest a possible decline toward the $0.100 support. Additionally, the likelihood of the asset losing the just-emerging support is high, given that DOGE is still grappling with notable selling pressure at the time of writing.
Nonetheless, the altcoin could retest $0.105 if it maintains trading above the recent support.
HYPE/USD
A previous outlook predicted a rise to $46 on Sunday. HYPE attained the mark shortly after and attempted $49 a few hours ago. The altcoin has since been in an uptrend, but several indicators suggest it’s nearing its peak.
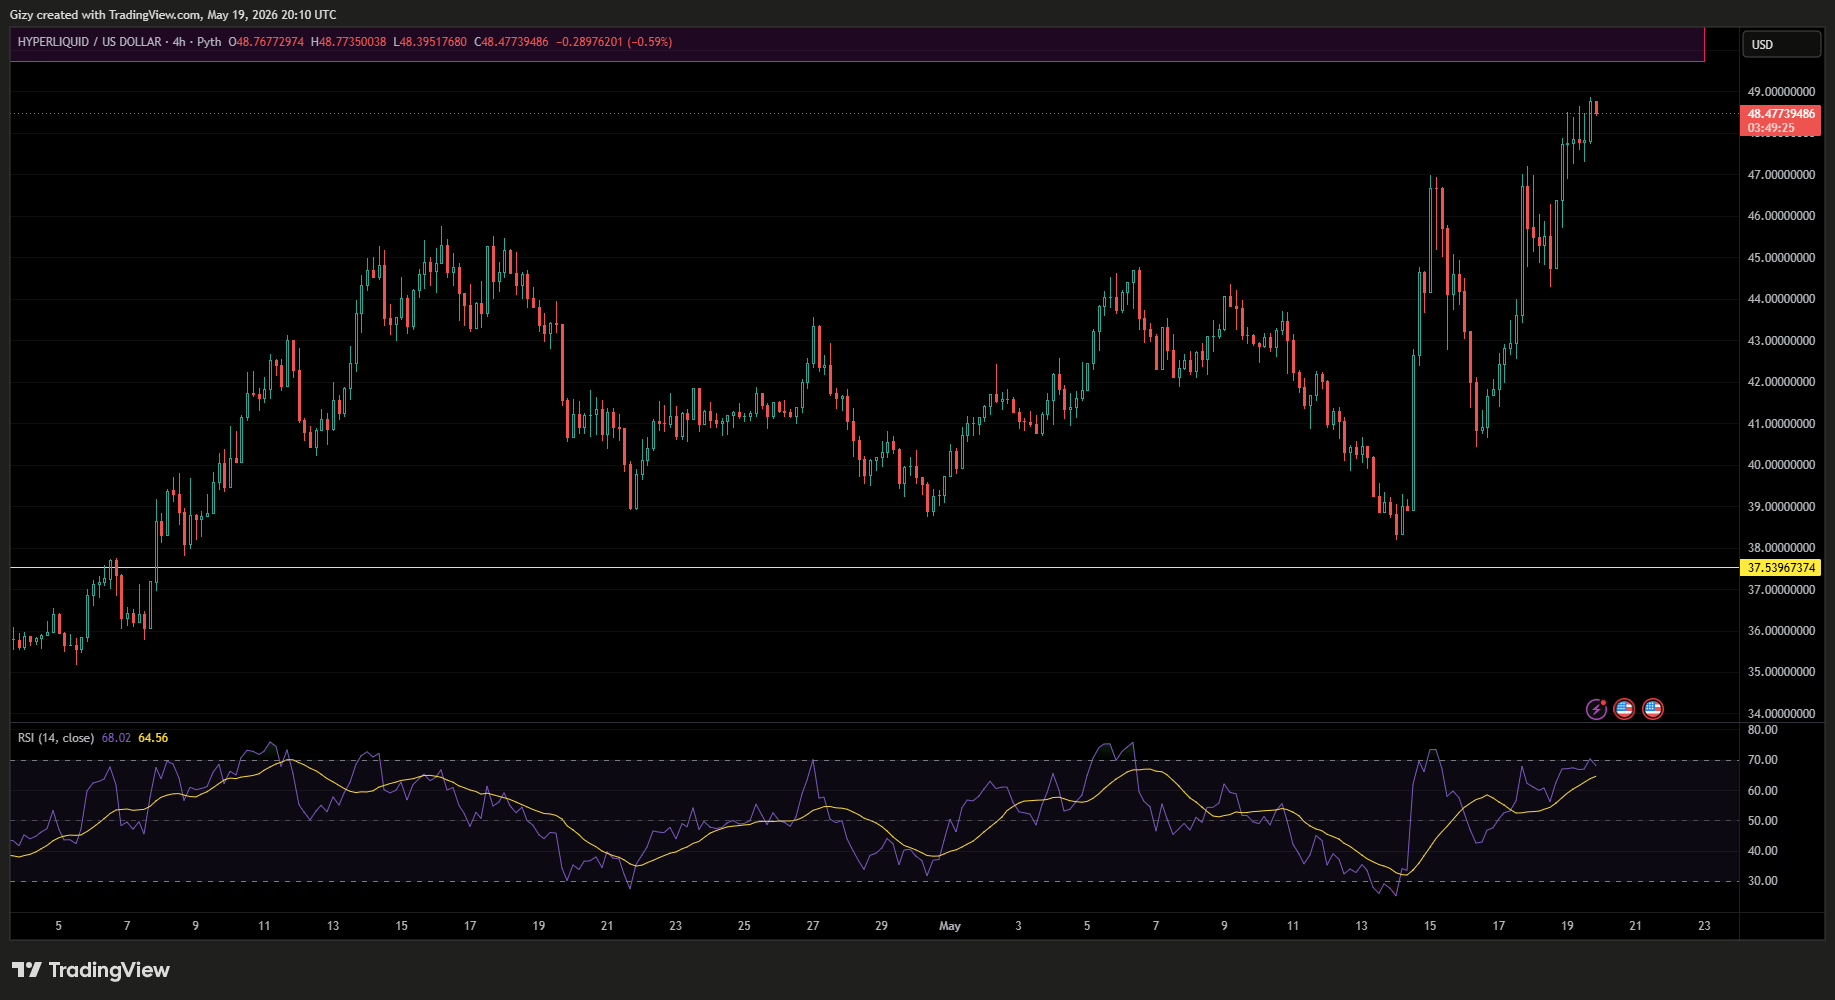
A recent analysis suggested that the asset’s upward momentum was waning after it entered the sell zone spanning $49 and $50. The 4-hour chart also supports this, as the relative strength index is trending close to 70.
Additionally, MACD is also flipping bearish. It is currently having a negative convergence at the time of writing.


