Ethereum has been on the uptrend, crushing one key level after another. It is experiencing one of its biggest surges in the last two months.
The altcoin opened trading at $3,138 and surged, breaking above $3,200 and $3,300. It peaked at $3,425 on Wednesday and may be going through a cooldown as it trades slightly lower. It is worth noting that this is the first time it has attained the mark since January.
Ethereum gained almost 8% during the previous intraday session. Its latest uptick coincides with several bullish predictions. One such prediction comes from Arthur Hayes, who believes the asset will surge to $ 10,000.
However, the apex altcoin has been on the uptrend since last week. One of the most significant surges during the previous seven-day session occurred on Thursday, when the asset surpassed $3,000. It gained over 6%.
Nonetheless, Ether is up by almost 50% since June 22. Its recent growth has piqued the interest of many, as the discussion has reached a level only seen in May 2024. Data from Santiment showed that the coin remains in the top spot of trending cryptos over the last 24 hours.
Why is Ethereum Up?
The coin is experiencing a massive spike in accumulation. Mining firm Bitmine bought 137,515 ETH three days ago and now holds 300,657 units worth over $1 billion.
Sharplink is gaining more attention and securing its place as the Microstrategy of Ethereum. It recently bought 20,279, bringing the total to 111,609 in the last eight days. Its total holdings are 280,706ETH, worth almost $1 billion.
Investors are aggressively buying ETFs. BlackRock registers its biggest single-day net inflow ever on Wednesday, with 148,585 ETH flowing into the ETHA. Data from SoSoValue indicates that over $726 million poured in during this period, the highest since the launch of the exchange-traded fund.
Nonetheless, current data show that the accumulation is ongoing. ETFs saw a netflow of 191,473 worth $651 million.
What to Expect Next?
Ethereum surged to a high of $3,483 as it experienced notable rejection to its bid at $3,500. It trades slightly lower at the time of writing. However, the candle representing the current-day trading action suggests that investors are losing interest.
Some are taking advantage of the massive increases the asset has had. Lookonchain reported that two whales recently sold 178,080. ETH’s values reveal retail selling. The current trend is unsurprising; holders noted significant PNLs following the latest surges.
Nonetheless, the 4-hour chart indicates an impending decline. The Bollinger Bands on this timeframe indicate that the altcoin has broken out on several occasions. The most recent incursion happened around 4:00 UTC. However, a constant trend after breaking out is price retracement to the middle band. Such correction is yet to happen, indicating an impending downtrend.
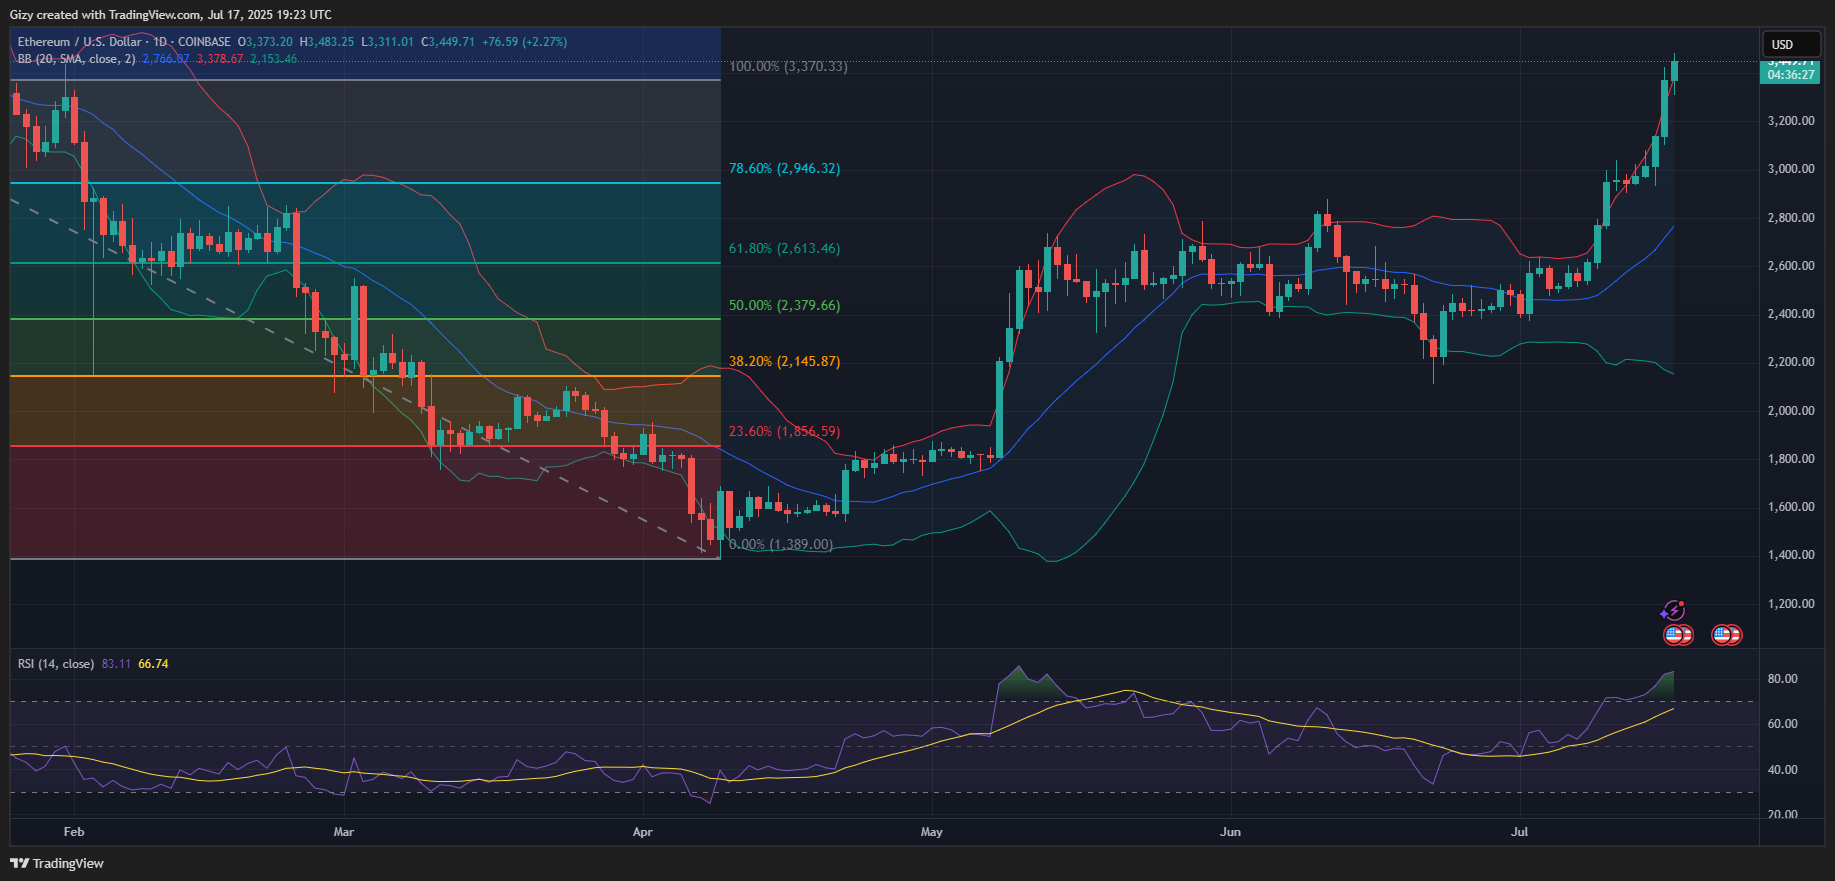
The relative strength index reveals that ETH is overbought. The metric broke above 70 on Jul 15 and has since remained above it, supporting readings from the previously highlighted indicator.
It is worth noting that the candlestick representing the current session is a hammer. It appears mostly at the end of an uptrend. A closer look at the chart above reveals that this is the second of its kind.
With indicators and other metrics hinting at a decline, Ethereum risks massive declines. Bollinger’s middle band is currently at $3,200. The altcoin may retrace to this level and lower if the bulls fail to sustain the uptick.


