
Bitcoin opened trading at $117,926 and registered a slight increase to a high of $118,775. A few hours ago, trading conditions worsened, causing the apex coin to drop to a low of $115,784.
BTC rebounded and trades above $117k at the time of writing. However, the 2-hour chart indicates that the asset maintained trading above $117,300 for most of the day before the sudden downturn a few hours ago.
The latest decline is no surprise as bitcoin continues to react to the FOMC. The US Federal Reserve Committee had its meeting on Wednesday and released the minutes as the coin retraced.
Investors were dissatisfied with the decisions the feds made. The body decided against cutting the interest rate for the fifth consecutive time. While the sentiment on X shows that traders were not eagerly anticipating a rate cut, they were open to the prices.
Recent data from Glassnode noted that the total unrealized profit of all BTC holders hit a new high of $1.4 trillion. These individuals may have been some of those who took profits in the past hour.
Reports from the platform indicate that long-term investors who held for 155 days or more dropped by 11% in the last 30 days, reflecting a gradual spike in sellers.
$240 Million Liquidated
The derivative market is heating up; traders lost almost $240 million in the last 4 hours, with long positions accounting for over $218 million. Traders trading BTC recorded losses exceeding $50 million, with long positions accounting for more than 80% of the total losses.
Data from CryptoQuant shows the futures market has cooled down following the latest decline. The volume bubble map indicates a transition back into neutral, suggesting that BTC may be prepping for another uptrend.
Further data from the same platform also showed that Bitcoin has passed through the short-term overheating phase.
Will Bitcoin Surge?
Following Bitcoin’s rebound, the apex coin prints a green candle on the 4-hour chart. A closer look at the chart shows that BTC rebounded at a critical level. It retested the $120k resistance, which it had previously broken below, after briefly falling below $116k.
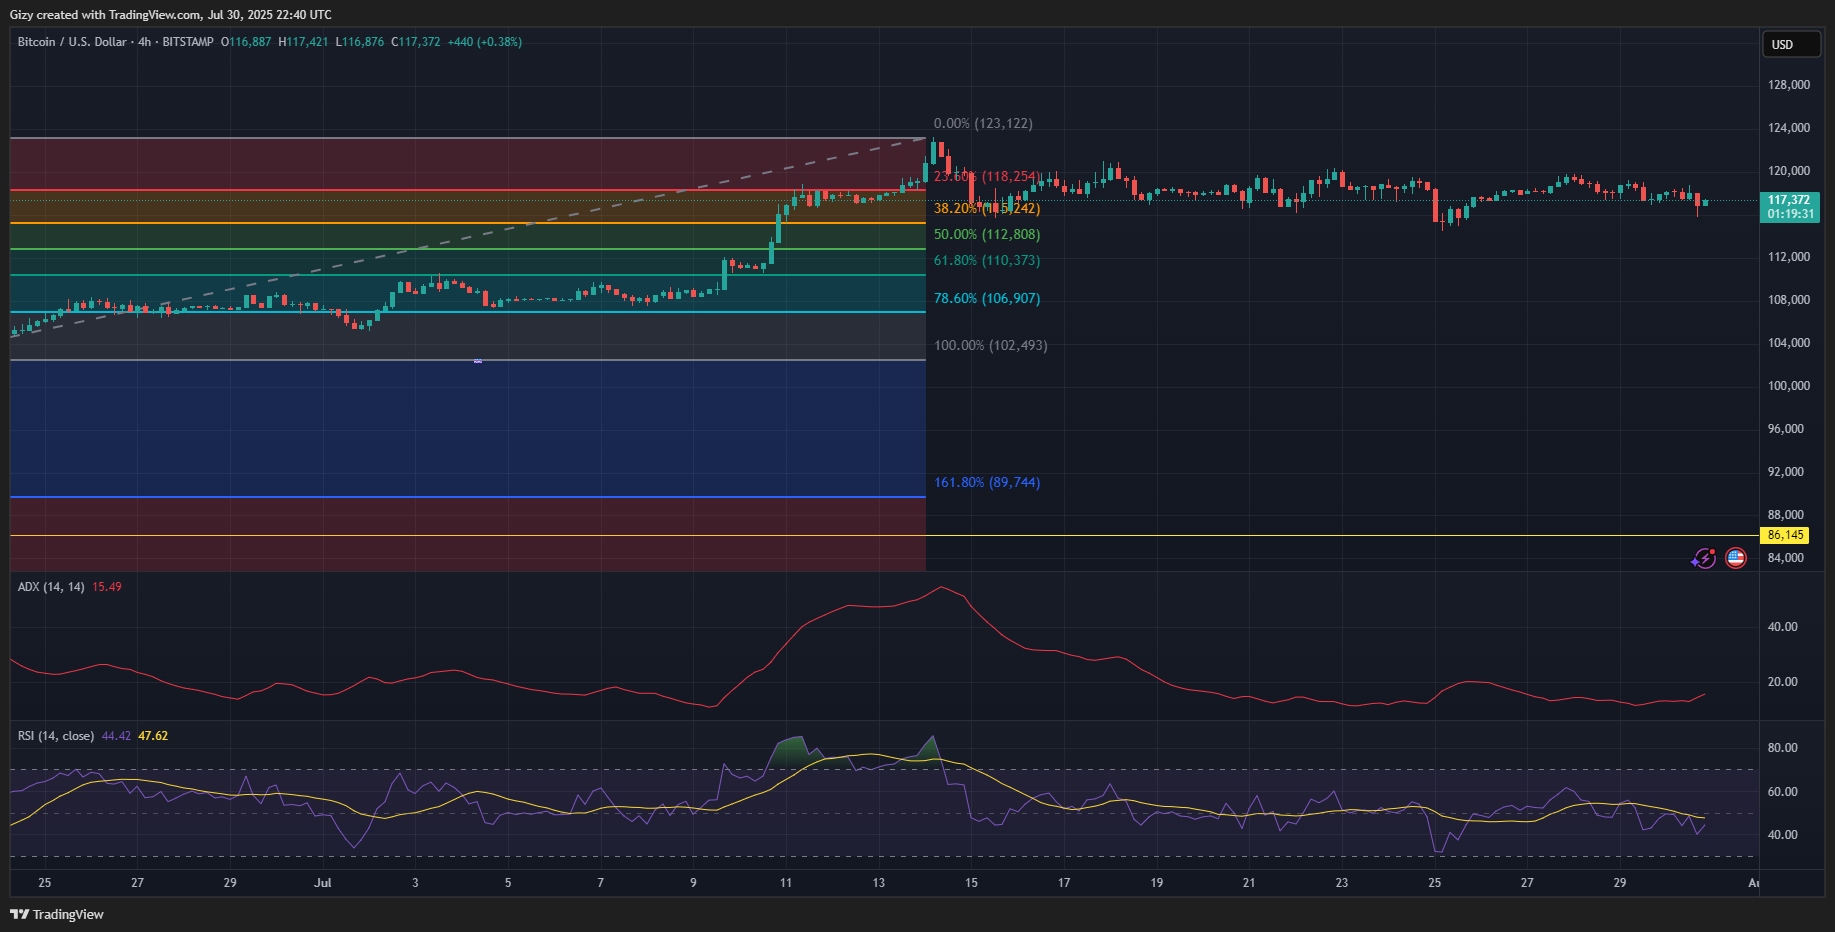
Indicators support the prediction of further price increases, as the average directional index resumes its uptrend amid the slight price increase. Additionally, the relative strength index is rising slightly as buying pressure increases.
However, the 1-day chart paints a grimmer picture of how prices will perform in the coming days. RSI is at 55, a few points lower than its previous day’s reading. Its latest trend indicates a rise in selling pressure over the last three days.
MACD is also negative, having displayed a bearish divergence last week. A similar reading is present in the average directional index.
The Fibonacci retracement level shows that the asset continues trading around the 23% level. This may indicate notable demand concentration around the market.
Nonetheless, Bitcoin may drop to retest the 38% fib level around $115,242. The bulls need to keep prices above this mark, as failure to defend the mark will result in a drop to $112k.


