Bitcoin opened trading at $118,068 and peaked at $119,267. The candle representing the current day’s trading action shows the asset dropped to a low of $116,928 but rebounded and trades slightly lower than its opening price.
The coin registered reduced volatility on Monday as it barely moved. However, it failed to break above $120k. The 1-day chart indicates that the coin is heading for another close below $120,000, marking its 15th consecutive day of trading below the level.
BTC’s consistent failure to surge above the resistance raises concerns about its next price action, as it spent the last fourteen days consolidating.
Data from Glassnode indicates dwindling buying pressure from several sectors. One such example is the exchange-traded funds. The platform noted that Bitcoin ETF inflows dropped by 80% in the last week.
However, almost all of the BTC supply is in profit. On-chain data indicates that active addresses are down by 2.4%, while transfer volume dropped by 23%. On the other hand, the realised cap chain rose to 6.6% indicating that the asset sees mild inflow.
The BTC option skew displayed an unusual divergence on Monday. The one-month puts trade at a premium while the one-week skew lags. The one-month reading indicates ongoing profit taking, which may hinder any significant price surge.
A recent report from CryptoQuant indicates that long-term holders have turned negative above the $120k resistance. This psychological change suggests that some investors who held through the previous cycle are taking profits.
However, BTC is yet to see a massive decline due to notable demand concentration around the critical level.
Demand concentration at $117k
A recent report from Glassnode pointed to notable accumulation between the $110k – $117k cost basis range. Previous data noted that the $117k level continues to attract demand, investors now pull 73k BTC at this CB.
A closer look at the one-day chart shows that Bitcoin rebounds after slightly breaking below $117k. The trend has remained constant over the last two weeks.
It is also worth noting that the number of long-term investors taking profit above $117k is not significantly high. This trend also contributed to the strength of the highlighted support. Nonetheless, one of the biggest sellers in the last seven days was Galaxy Digital, which sold 80,000 BTC.
Bitcoin Continues to See Fresh Liquidity
The option delta skew turned mildly bullish as the volatility spread increases. Nonetheless, the short-term holder/long-term holder ratio and hot capital share are both rising.
Data from CryptoQuant suggests mild accumulation as the exchange reserve slightly reduces. It is also worth noting that trading volume is up by 4% amid the slight price decline.
The one-day chart shows that BTC is gearing up for a massive breakout. The Bollinger bands are contracting in response to several days of decreased volatility.
However, its next price direction is shrouded in uncertainty. Recall that data from Glassnode noted that 96% of the current supply is in profit. This increases the chance of a massive downside movement.
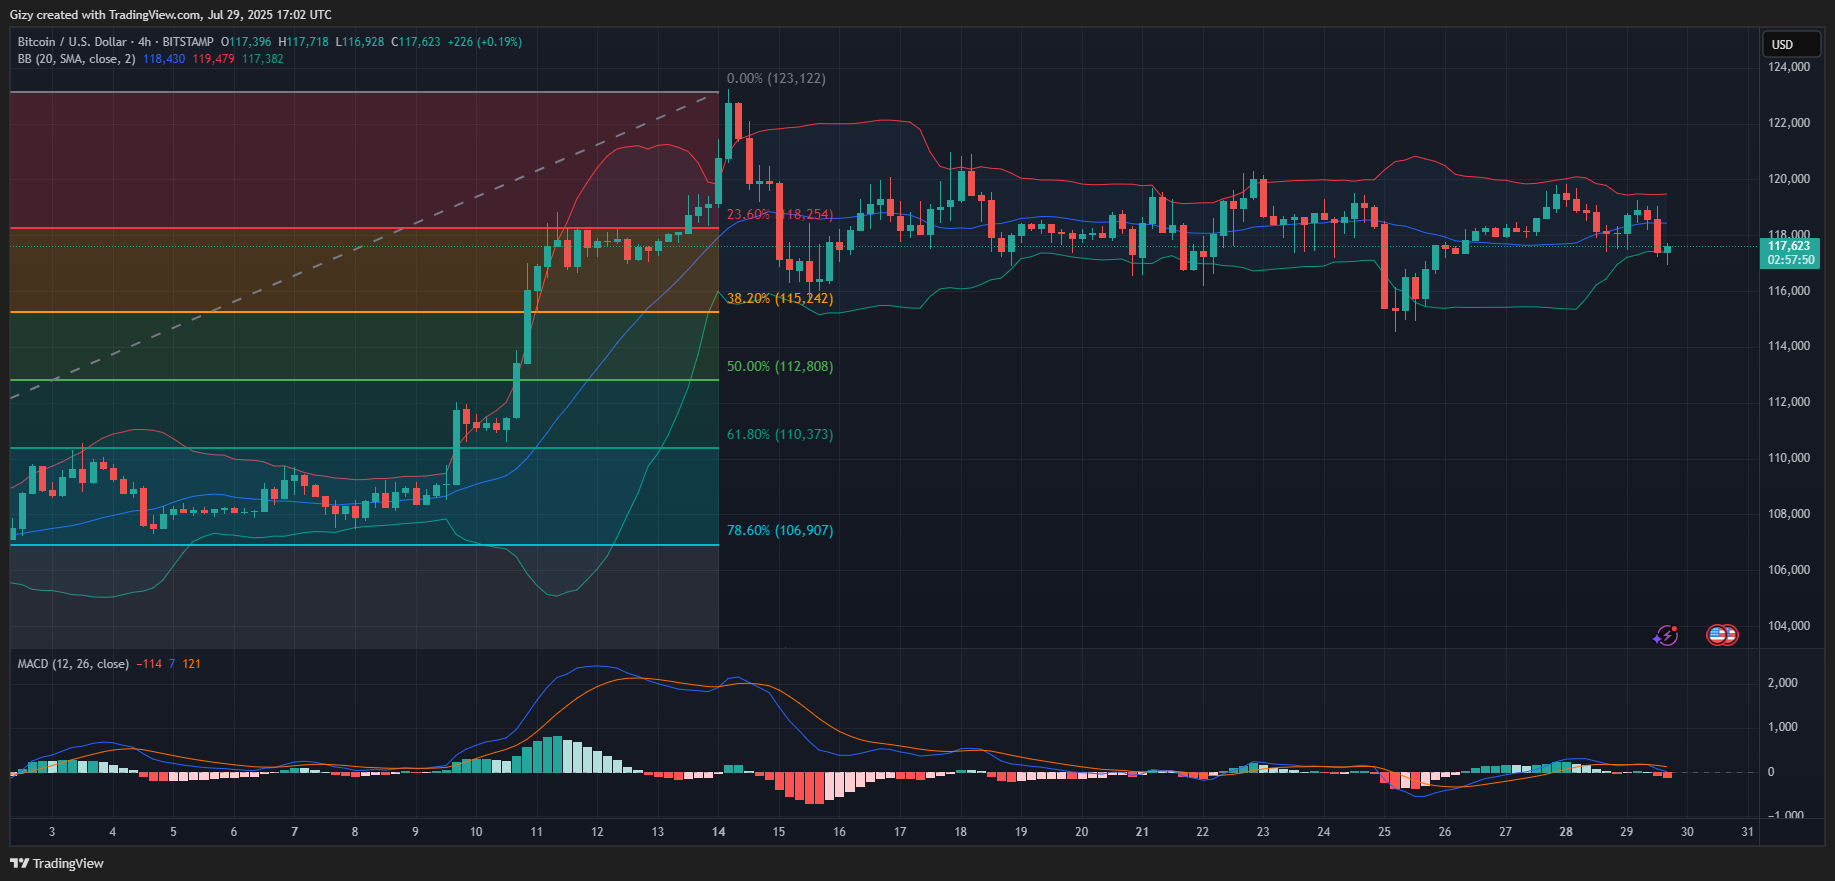
Other indicators, like the moving average convergence divergence and the average directional index, print a sell signal at the time of writing. MACD displayed a bearish divergence a few days ago and is yet to show any sign of reversal.
The ADX remains on the downtrend, indicating a strong downward trend at the time of writing. With the highlighted metrics pointing to decline further, the Fibonacci retracement level suggests that there’s notable demand concentration around $115k.
Conversely, the apex coin may see a change in sentiment that could send prices higher.