
Arbitrum made headlines last week following the KelpDAO hack. It saw a lot of attention for the first time in months, but not one many would consider good.
Following the exploit, the DAO had two options: isolate the losses to layer 2 and have Arbitrum and Mantle bear the brunt, or leave it as is and have Aave deal with the bad debt.
The hackers involved in the attack were about laundering the funds and sent some to ARB. However, in a bid to halt the laundering scheme and reduce losses, key decision-makers in the ecosystem froze the assets.
While the move was welcomed by some, others in CT were not pleased. They contended that it undermined the project’s claim to decentralization and set a bad precedent for future issues, noting that a group of people might simply lock a wallet without proper authorization.
Justin Sun also took a jab at the move, proclaiming, “Tron is the only decentralized chain.” In either case, efforts to recover the funds continued. The crypto industry rallied together to cover the losses, and the frozen funds played their part.
Nonetheless, Arbitrum continues to grapple with the effects of the exploit. Before the incident, the total locked value on the blockchain was 15.4 billion. It dropped 2 billion following the hack and has shown no signs of recovery.
While investors panicked, they failed to pay attention to one important factor: prices. They plummeted by more than 7% following the hack. It has since struggled to resume its uptrend.
Arbitrum Sees Notable Increases
Amid the drama trailing the KelpDAO hack, Arbitrum will close April with its best performance in months. It is worth noting that it has been on a downtrend since September. During this period, it lost over 81%.
However, for the first time in 2026, the asset prints a green candle on the 1-month scale. It saw a significant uptrend over the last thirty days, so much so that the latest incident did not notably affect its performance on the monthly scale.
The 1-day chart shows that most of the uptick occurred in the first half of the month. The hack was the turning point as prices were rangebound afterward. They trended between $0.133 and $0.121 for almost two weeks.
Nonetheless, April opened at $0.092 and may close at $0.128, marking a 33% rise. Additionally, the 1-week scale, ARB, is about to post its first red week of April. The asset was hit by several macroeconomic factors, as was the rest of the market.
Following its performance in the fourth month, the question is whether the uptrend will continue in May.
The bollinger band on the 1-week chart shows that the asset is currently trading at a critical level. The uptrend slowed when prices neared the middle band. Interestingly, over the last two weeks, the altcoin posted lower highs.
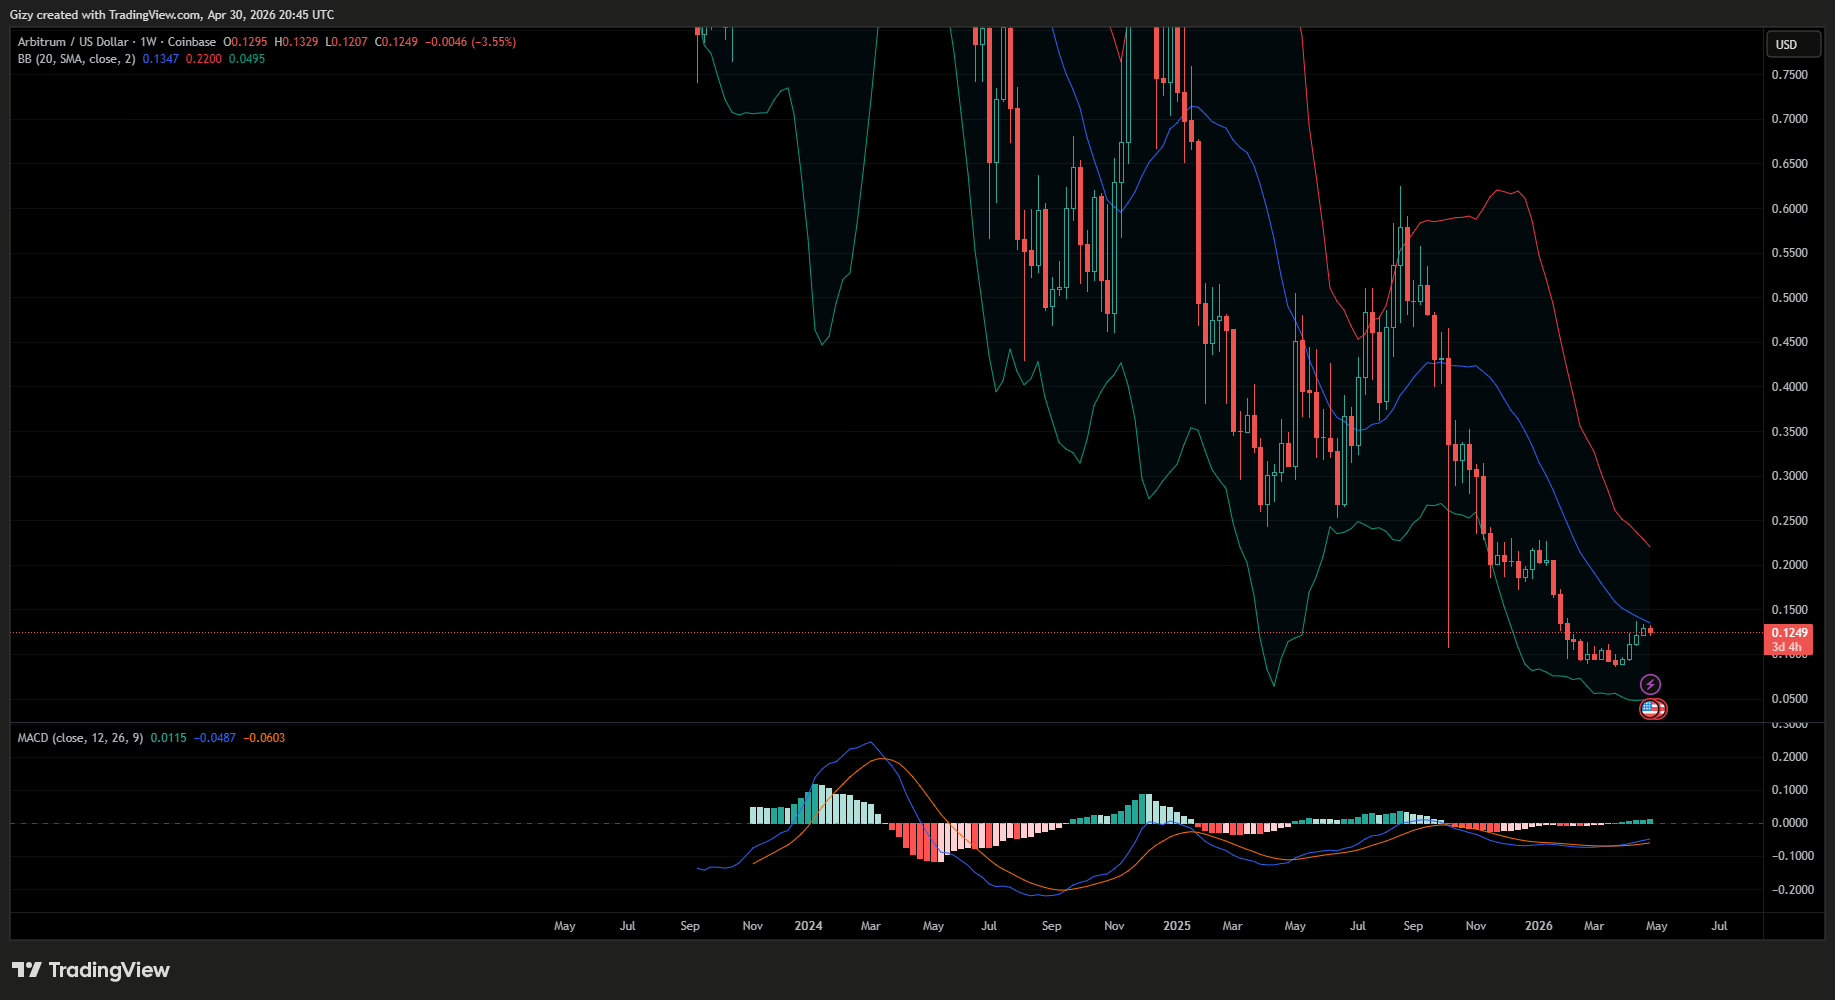
The current trend suggests that the asset is losing its upward momentum. The recent red candle indicates the bulls are exhausted, and selling pressure will increase in the coming days. With the SMA currently acting as a resistance, flipping it is essential for further uptrend.
Based on this indicator, the uptrend is over. However, price action next week will either confirm or dispel it. If prices break above the middle band, the altcoin may post notable gains in May. Conversely, another red candle decreases the likelihood of a significant increase next month.
Arbitrum to $0.121
Arbitrum may be off to a bad start for the coming month with notable losses. Unlike on the 1-week chart, the bollinger bands are clear on the 1-day timeframe. A few days ago, the asset broke above the bands and has since retraced. It is currently trending above the middle band.
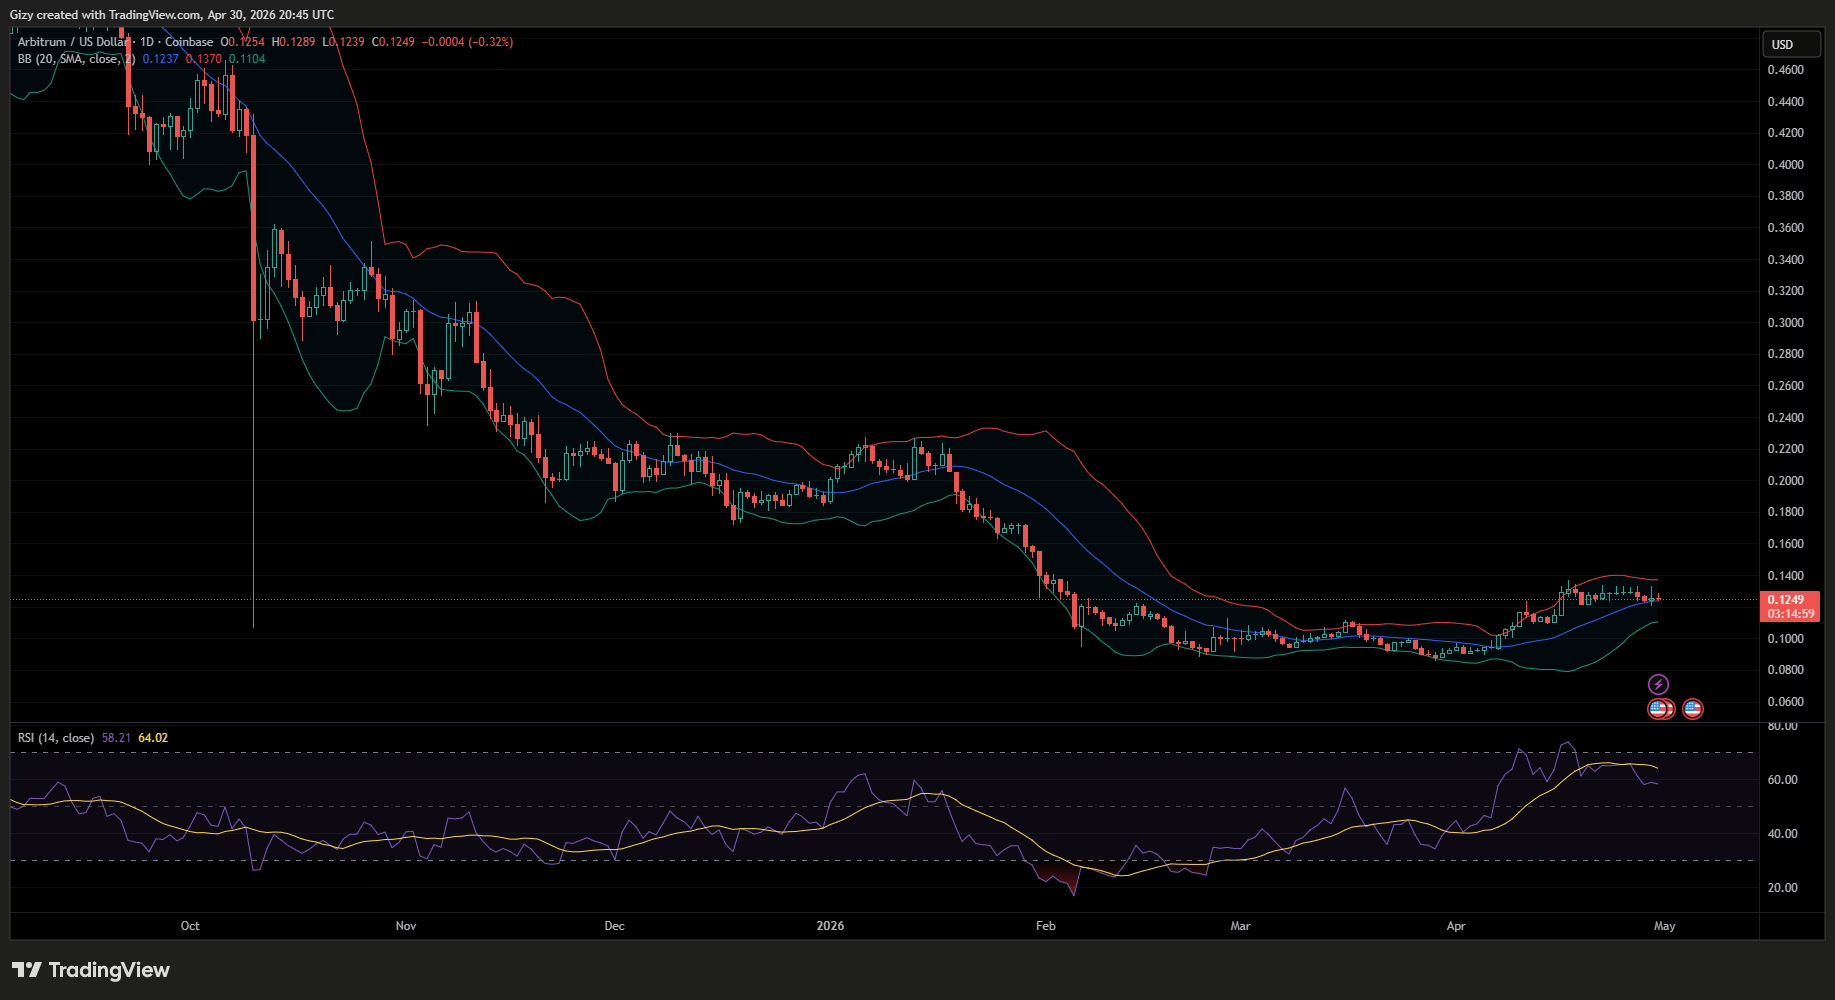
While trending above the SMA does not always mean further decline, comparing it to other indicators paints a clearer picture. The moving average convergence divergence had a bearish crossover a few days ago. It is still trending downward as bears continue selling.
Additionally, the relative strength index indicated that ARB was overbought a few days ago. Combining the three readings indicates that the price will drop further in the coming days.
However, the demand concentration at $0.121 remains strong. If prices slip below this mark. The next stop will be $0.11.
While Arbitrum grapples with selling pressure and how May will play out, Algorand will look to post further increases in the fifth month.
Algorand Prepares to Retest $0.127
Algorand posted notable gains in March. It retraced to a low of $0.079, then rebounded, ending the session with gains exceeding 6%. It made a critical comeback after seven months of consistent downtrend.
The uptrend continued in April. The 1-week chart shows that the first week of the month was the most positive, with the asset gaining a whopping 49%. After the initial bullish week, it became range-bound and may end the current one with notable losses.
Nonetheless, the altcoin may end the month with gains exceeding 17%. However, the 1-month candle shows an extended wick, signifying a fair-value gap. At the time of writing, it ranges from $0.110 to $0.126. Algorand may surge in the coming days to fill this gap.
1-Week Chart Align
The 1-week chart shows that the altcoin has been trending around bollinger’s middle band. It has maintained this trend over the last four weeks, breaking above the metric in the first week of April.
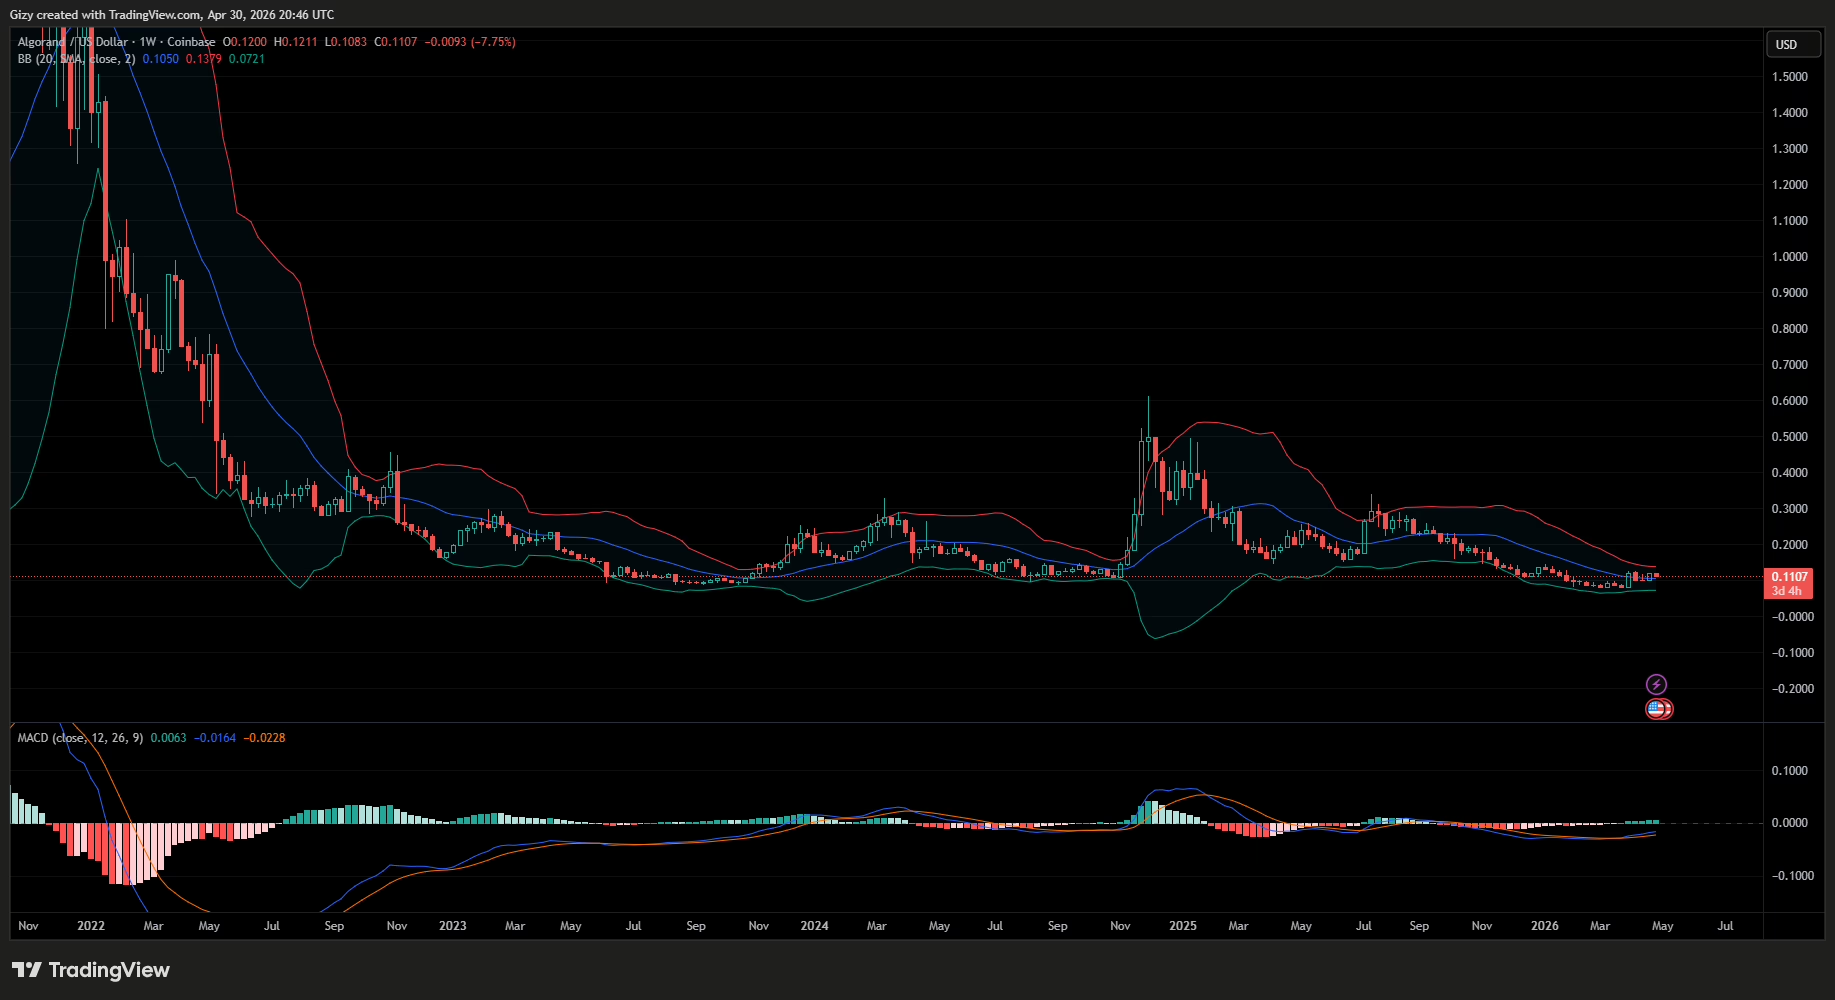
Amid the recent decline, it still trades above the mark. With sustained trades above the SMA, the likelihood of a surge to the upper band increases. This means that the asset will surge above April’s high in May.
However, on the 1-day chart, Algorand is gearing up for further decline. It is currently trading above the middle band. Given that it broke above the upper band a few weeks ago, it may continue downward, targeting the lower band.
Additionally, MACD had a bearish crossover earlier this week, adding to the conviction of further decline.


