BTC may end Thursday with slight gains following its rocky start to the week. However, a green at the end of the day will see the apex coin breakout of its previous trend of registering notable losses. It is worth noting that the coin saw significant losses over the last two Thursdays.
Aside from breaking out of the trend, trading conditions at the time of writing are slightly better than those of the previous day, as trading volume has increased. Nonetheless, BTC grapples with notable selling pressure at the time of writing.
However, the global cryptocurrency market is almost stagnant. It is slightly down over the last 24 hours, but volume is up by over 3%. A closer look at the chart reveals reduced volatility during this period as some crypto assets barely moved.
Nonetheless, many may attribute the lack of movement to the absence of strong positive fundamentals. While there was no major news for the broader crypto market, some altcoins experienced notable increases on Thursday.
PYTH surged by over 60% following the announcement of a partnership with the United States Department of Commerce. Some investors may conclude that the collaboration has been a long time in the making and that the latest price hike was long overdue.
Most cryptocurrencies are edging closer to erasing the previous losses. Let’s take a look at what lies ahead for some of the top 10 assets.
BTC/USD
Bitcoin is recovering from yesterday’s slight decline. However, the 1-day chart shows that it has yet to make any significant leap in breaking out, as the coin has yet to register any substantial gains in the last 24 hours.
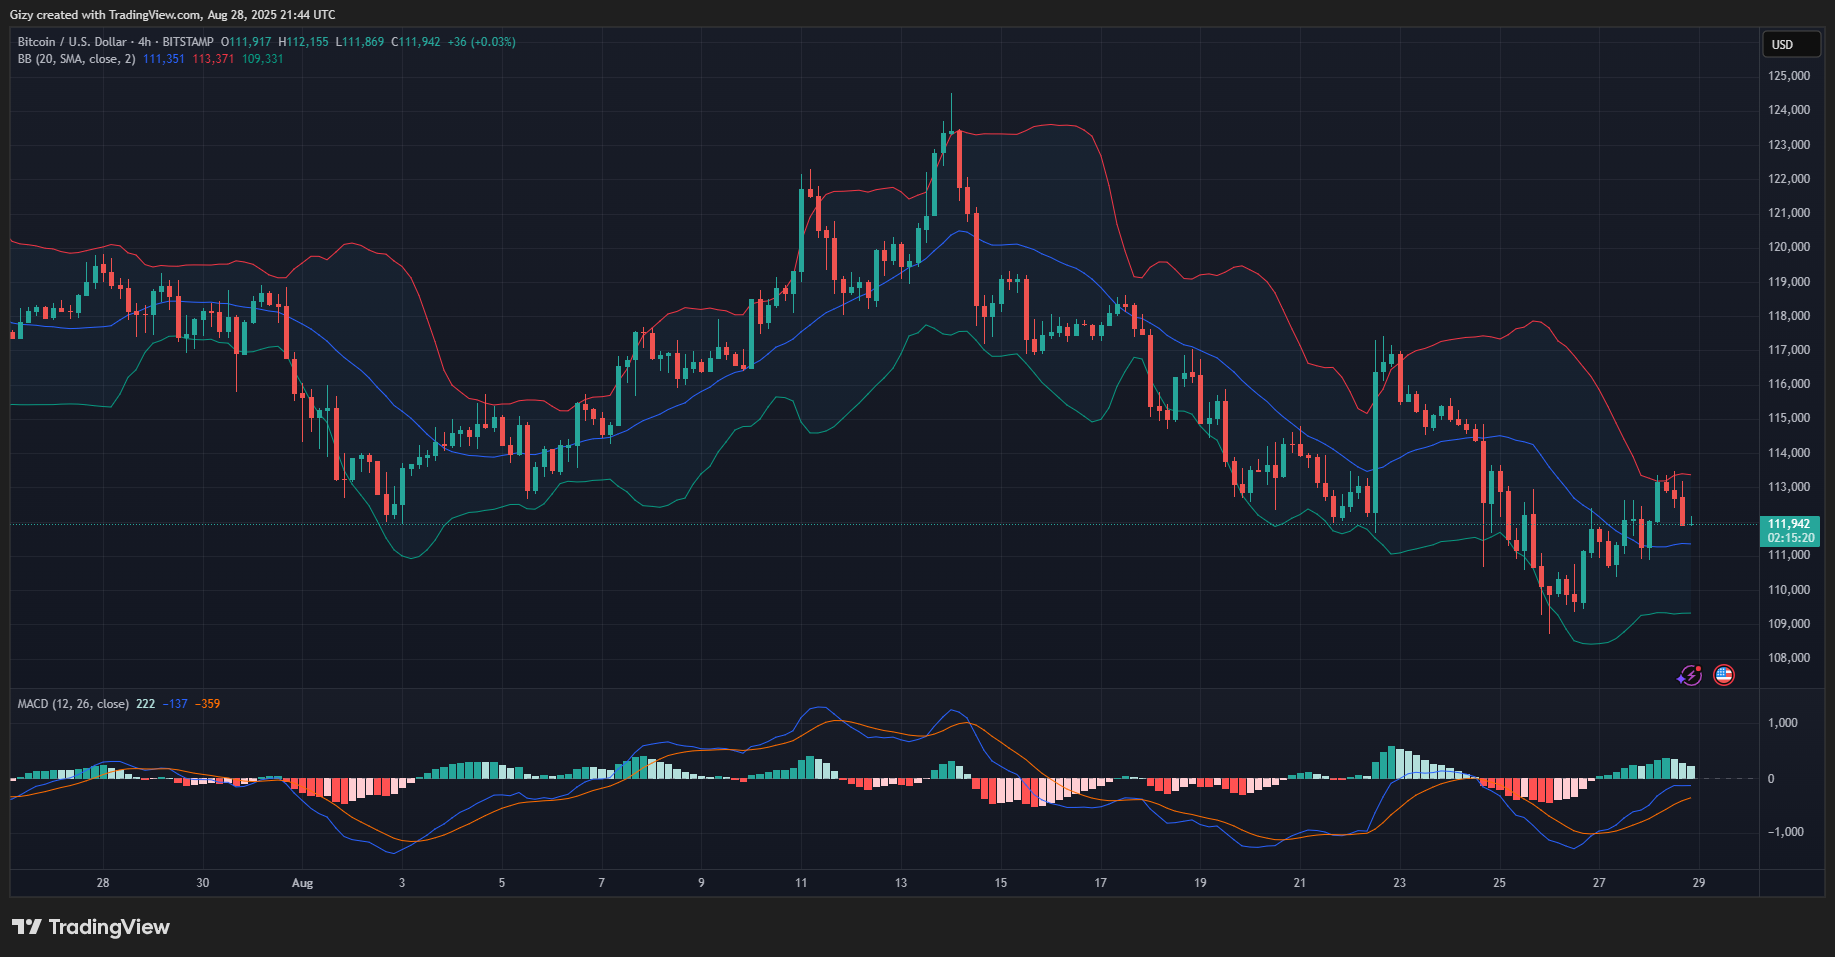
Nonetheless, the candle representing Thursday’s price action shows an extended wick sticking out the top. This means that BTC traded higher than its current price but retraced.
The 4-hour chart reveals that the asset gradually lost upward momentum starting in the early hours of the day. It continued downward but showed signs of recovery at the time of writing. However, some indicators are silent about the next price action.
Nonetheless, previous price movements indicate that the coin is trading above a critical mark. The $112k support is considered a make-or-break level, as failure to hold it may result in a drop to $110k. Conversely, a surge in buying pressure will send BTC above $114k.
ETH/USD
Ethereum is seeing the same trend as BTC. Its bid toward recovery has hit a brick wall as it saw a drop in upward momentum in the early hours of Thursday.
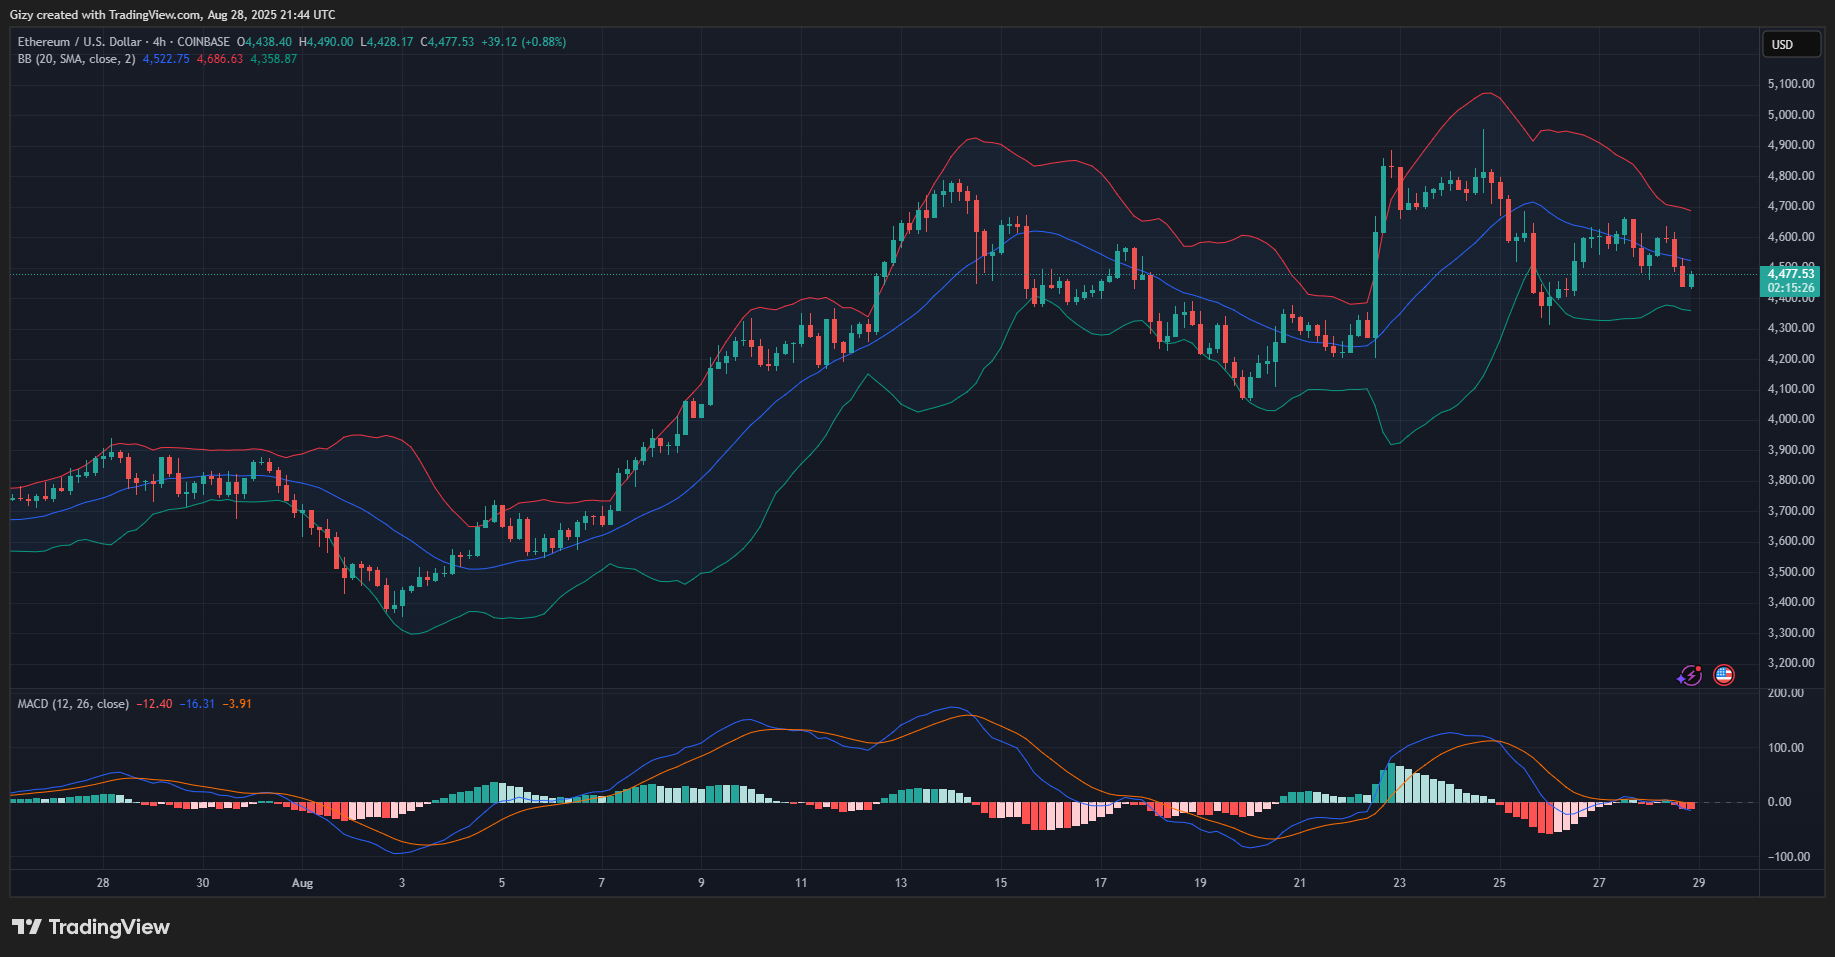
Nonetheless, the 1-day chart indicates that the coin saw notable increases before the gradual drop in momentum. The 4-hour chart reveals that the gradual drop began in the session starting at 8:00 UTC and continued through noon.
However, the coin is seeing a slight pullback at the time of writing. Although not significant, previous price movements suggest that the downtrend will resume. The altcoin’s latest increase started at a level with no significant demand concentration.
For context, previous recoveries that led to further increases started between $4,380 and $4,400. Prices may drop to this level to guarantee a tougher rebound. Nonetheless, it risks further declines if the bulls fail to stage buybacks at this level.
XRP/USD
The 4-hour chart reveals that XRP saw sizeable upticks in the first half of Thursday. However, trading conditions changed at noon, resulting in an almost 2% drop before recovering at the time of writing.
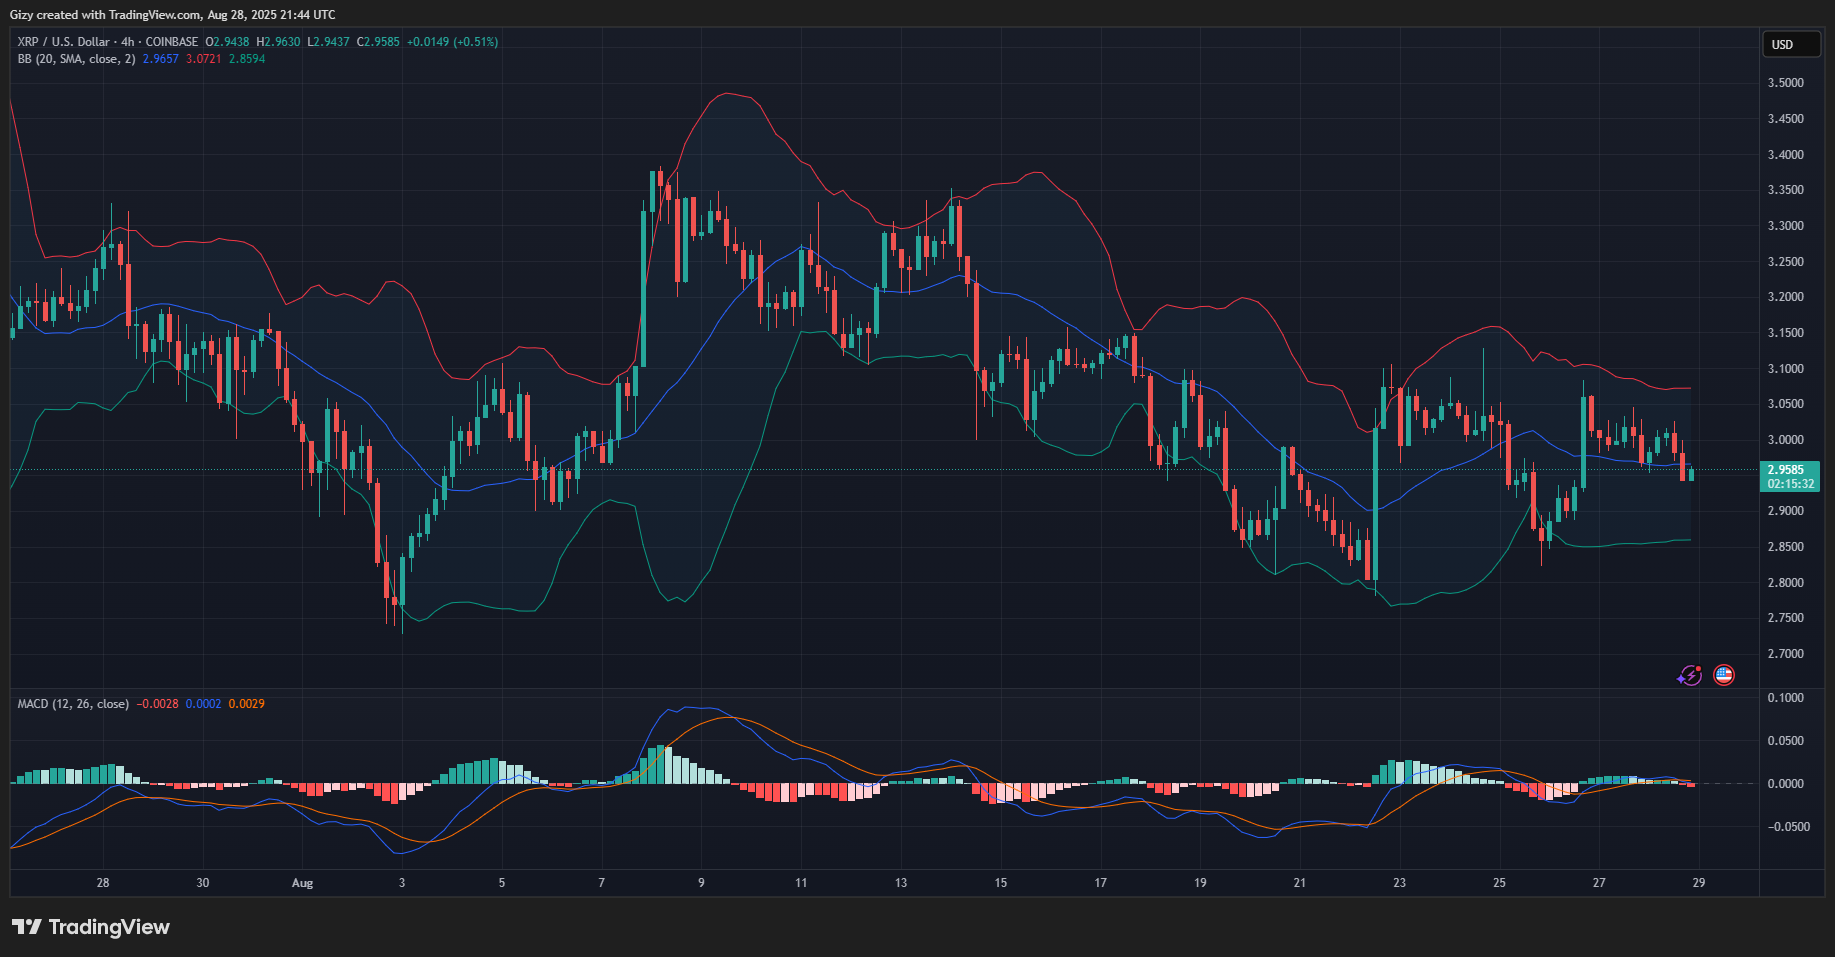
The altcoin trades below bollinger’s middle band. A closer look reveals that when the asset falls below this metric, it almost always continues downward until it reaches the lower band. If this trend persists, the coin may continue to drop, reaching a low of $2.85.
However, a rebound may send it up, breaking above $3 in the coming days; nonetheless, the likelihood of this happening is slim.
BNB/USD
BNB erased the previous day’s losses and is up by almost 2% on Thursday. However, it is grappling with notable selling pressure at the time of writing.
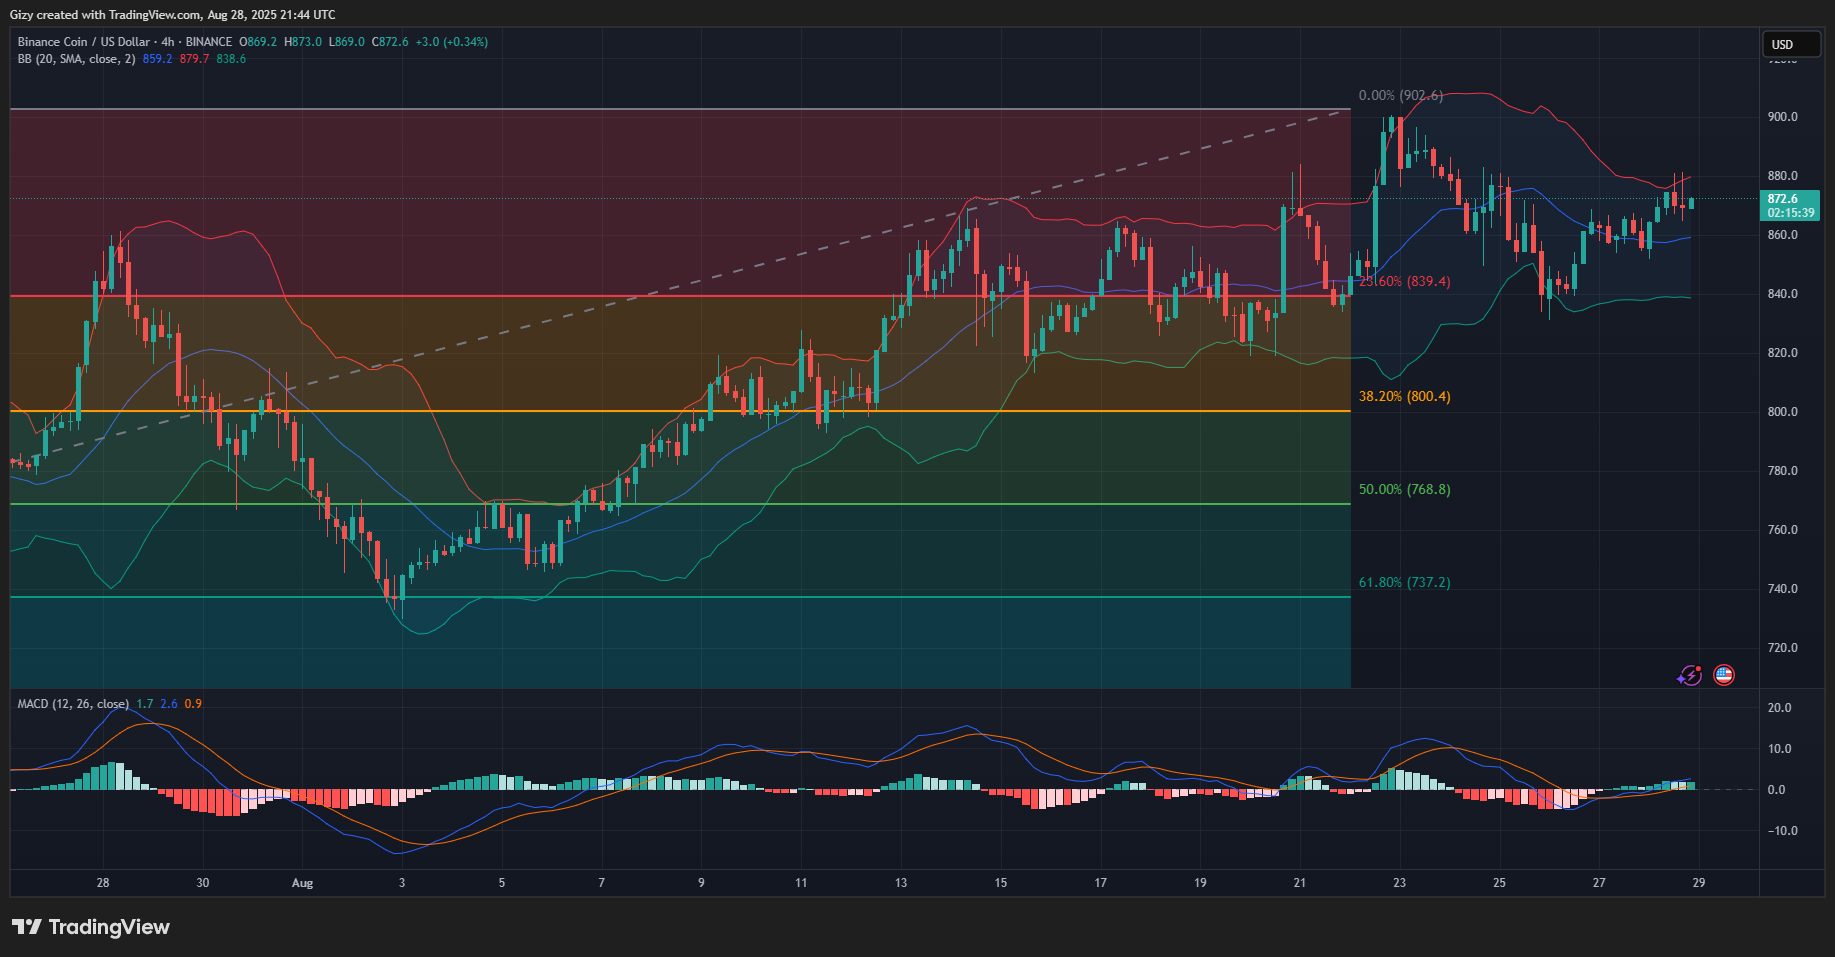
The 4-hour chart reveals that the asset broke above the bollinger bands at noon. It did it again during the session, but retraced and traded between the middle and upper bands. While BNB prints a green candle, the indicator suggests that the downtrend will continue.
Previous movements indicate an impending drop to the middle band at $860. Conversely, the asset may likely retest the upper band again as it attempts to break above $880.
SOL/USD
The 4-hour chart indicates an ongoing buyback attempt yielding results. It is worth noting that, like BTC, SOL saw notable selling pressure earlier and dropped to $207.
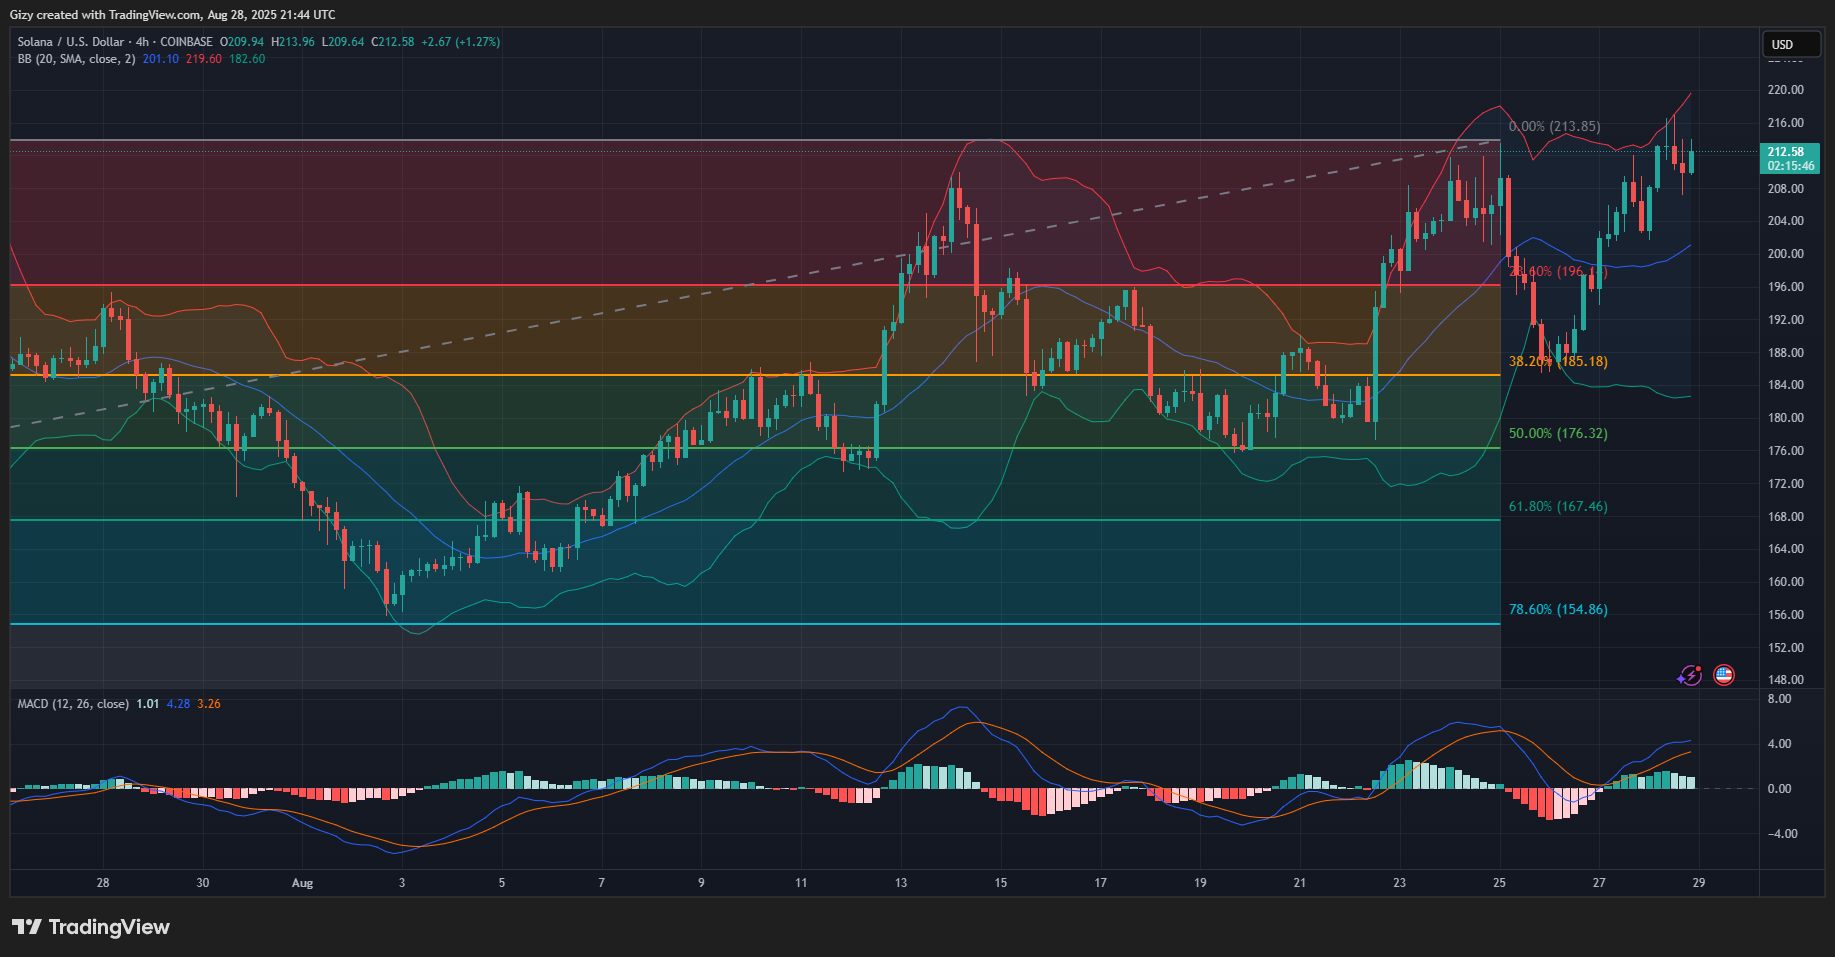
However, it is recovering and is fast approaching its previous high. Readings from the relative strength index indicate that the altcoin is experiencing a significant increase in buying pressure, which may lead to a breakout from the bollinger band.
If that happens, Solana may be edging closer to testing the upper band at $220. However, retracements may follow after testing this mark. The coin may retrace to its local support at $208, and further declines will send it to $200.
DOGE/USD
Like BTC, DOGE saw notable declines at noon but is recovering at the time of writing. Nonetheless, it is heading for another green, making it its third consecutive one.
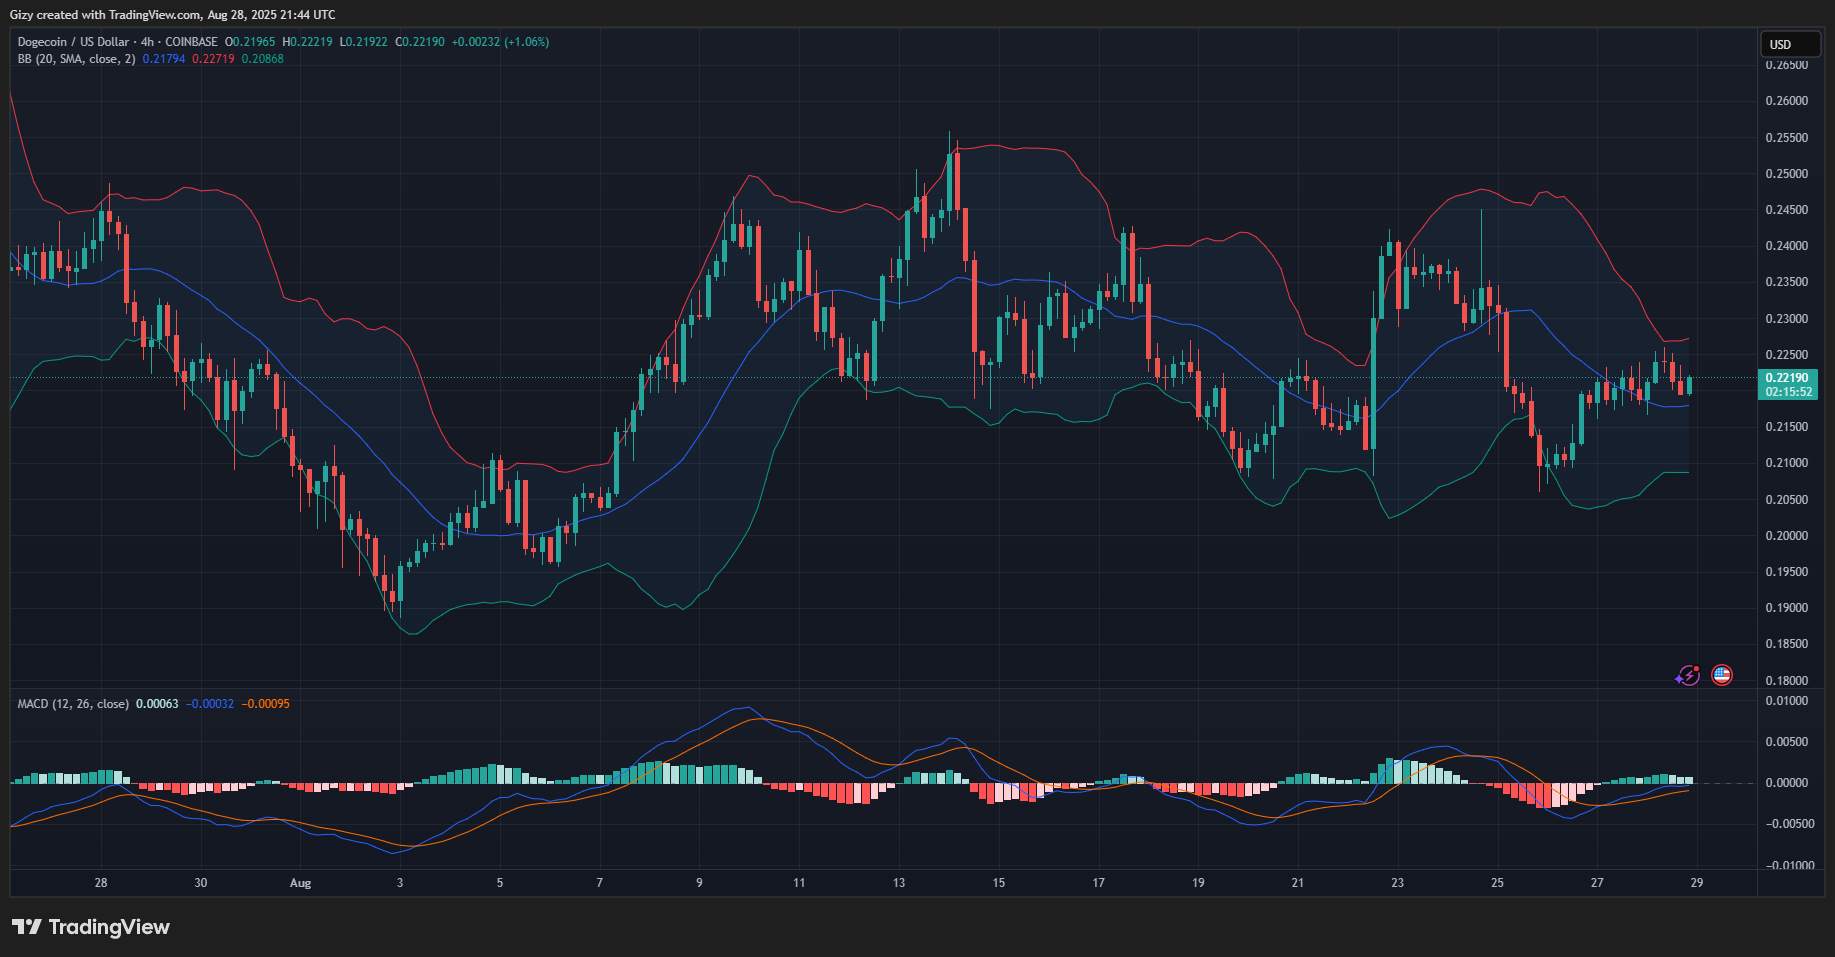
However, the bollinger bands indicate that there is a high chance for Dogecoin to retrace even lower, suggesting its current uptick on the 4-hour chart may be short-lived. If this holds, the memecoin may drop below the middle band at $0.217.
Conversely, continuing the uptrend will send the coin closer to the upper band at $0.227.
ADA/USD
The 4-hour chart shows that ADA mirrored BTC in the early hours of Thursday. It started its descent following the previous price spike and continued downwards for 12 hours.
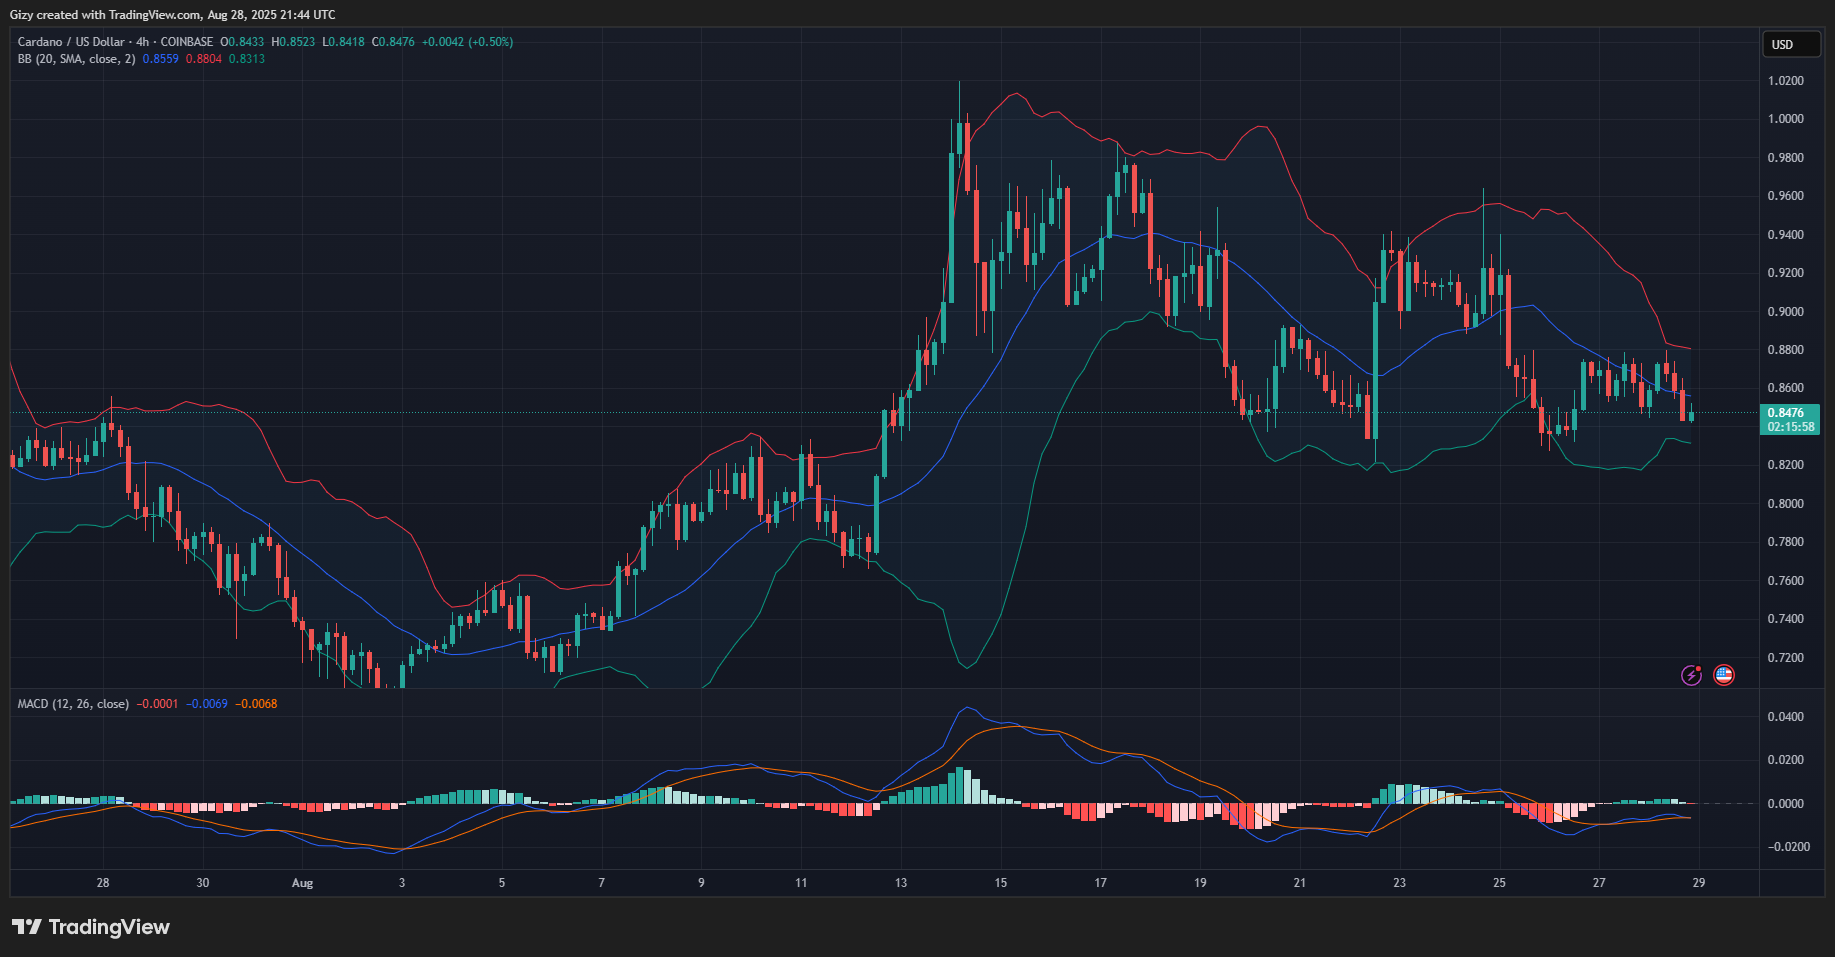
However, it is printing a green candle at the time of writing, indicating an ongoing recovery. Nonetheless, previous price movements indicate an increased likelihood that the uptick will continue, as the asset is currently trading in a demand zone. The coin may retest its three-day high at $0.88.
On the other hand, the bollinger bands suggest that ADA may retrace even lower, testing the lower bands at $0.82.