
LINK is seeing another massive decline at the time of writing. It is seeing massive losses at the time of writing, similar to those seen on Monday.
Recent data indicate that the asset experienced a massive 96% increase in trading volume over the last 24 hours. However, current prices suggest that the bulk of the volume is from sellers.
The crypto market is seeing massive retracements at the time of writing. The global cryptocurrency market is at $3.74 trillion, almost 3% lower than it started the day. Nonetheless, like LINK, the sector saw a notable increase in trading volume.
PYTH is one of the assets grappling with significant selling pressure. It gained over 100% on Thursday and tried to continue the uptrend on Friday. As a result, it peaked at $0.25 but retraced, hitting a low of $0.20. The coin is also trading more than 4% lower than it started the day.
Regarding fundamentals, this is why the market is bleeding. US President Donald Trump recently announced the fresh tariffs. Investors were displeased with this development, causing panic across several sectors.
The crypto market is seeing a slight recovery at the time of writing. Let’s examine how some of the top 20 assets will react in the coming days.
LINK/USD
Chainlink opened Friday at $25.1 but retraced to $25.4 and is currently trading at $25.4. It is down almost 7% over the last 11 hours. However, it erased the previous day’s gains and edged closer to incurring the same amount of losses as it did on Monday.
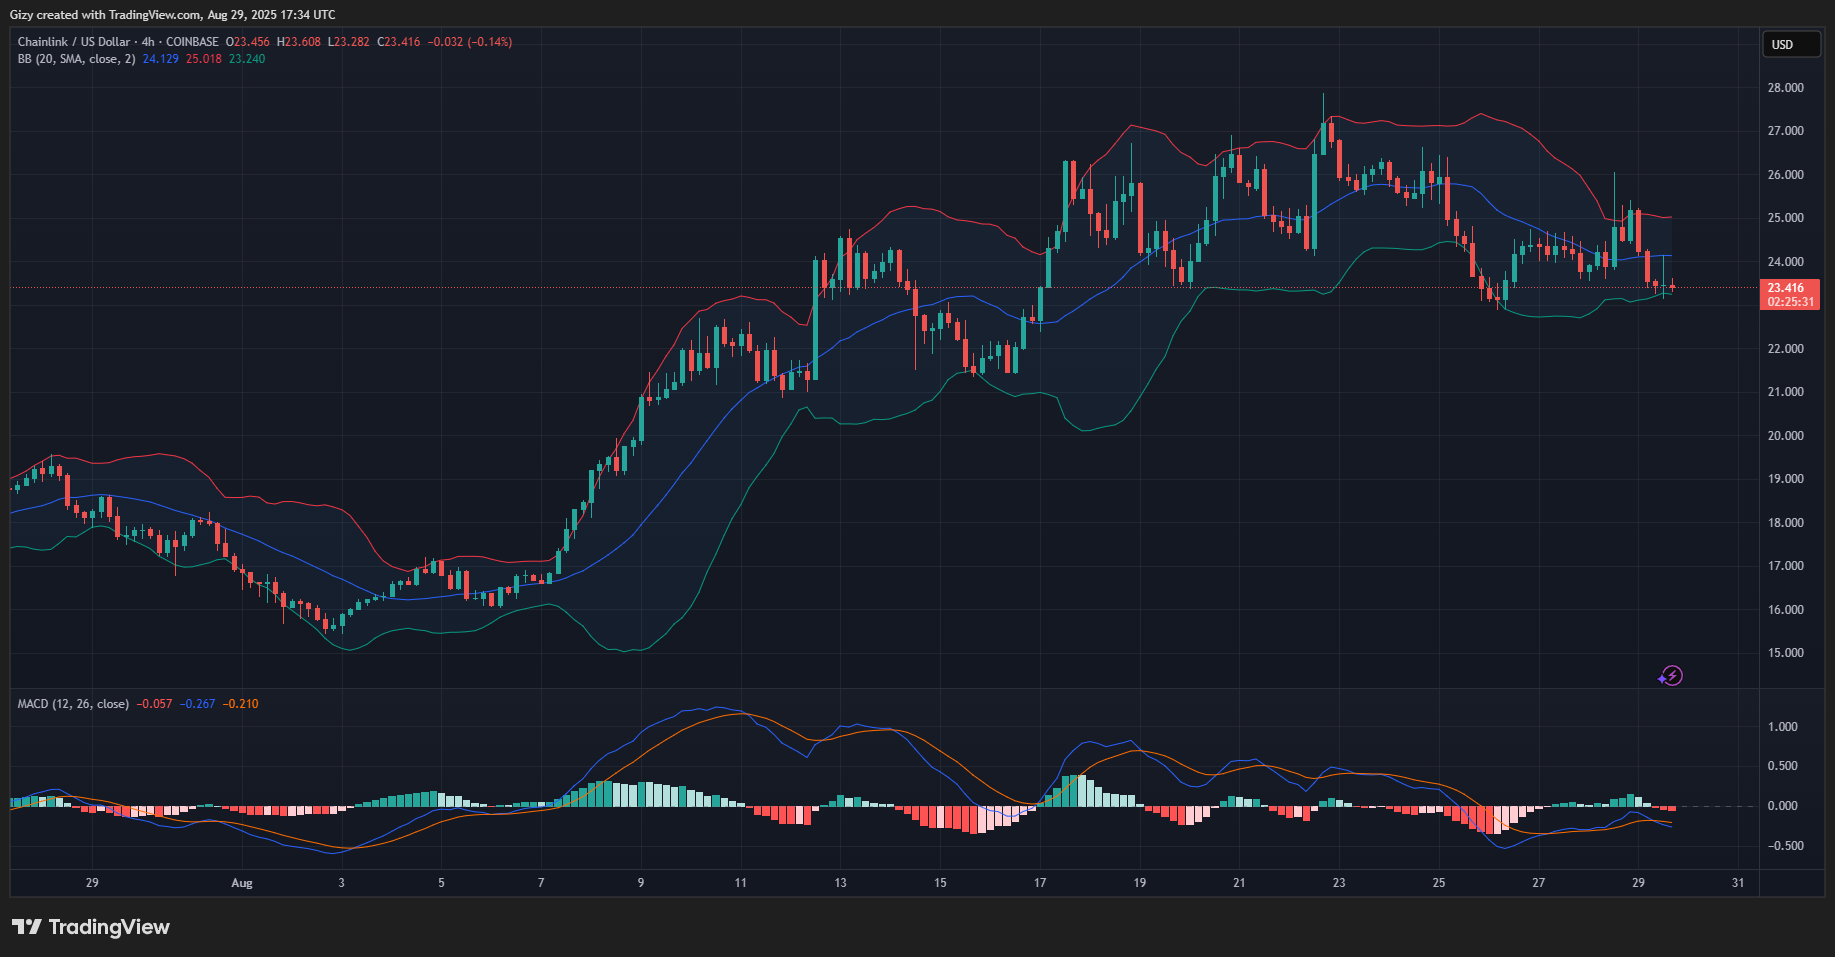
The 4-hour chart shows that the altcoin has yet to register any green since the day started. Nonetheless, its latest candle offers a glimmer that the surge may soon come to an end. Although red, it has a wick sticking out, indicating slight buying pressure.
The bollinger band shows that LINK rebounded after testing the lower band. This is not the first time the asset has rebounded around this metric. The previous events saw the coin surge to higher levels. If it repeats, LINK may surge closer to $25.
However, this does erase the fact that it may retrace further. MACD is currently printing sell signals following its bearish divergence. Previous price movement suggests a significant drop to $ 21.50 if the decline continues.
HYPE/USD
Hyperliquid (HYPE) is heading for its third consecutive day of decline. It lost almost 3% on Thursday and is edging closer to a repeat. It is down by over 2% on the 1-day scale but shows signs of recovery.
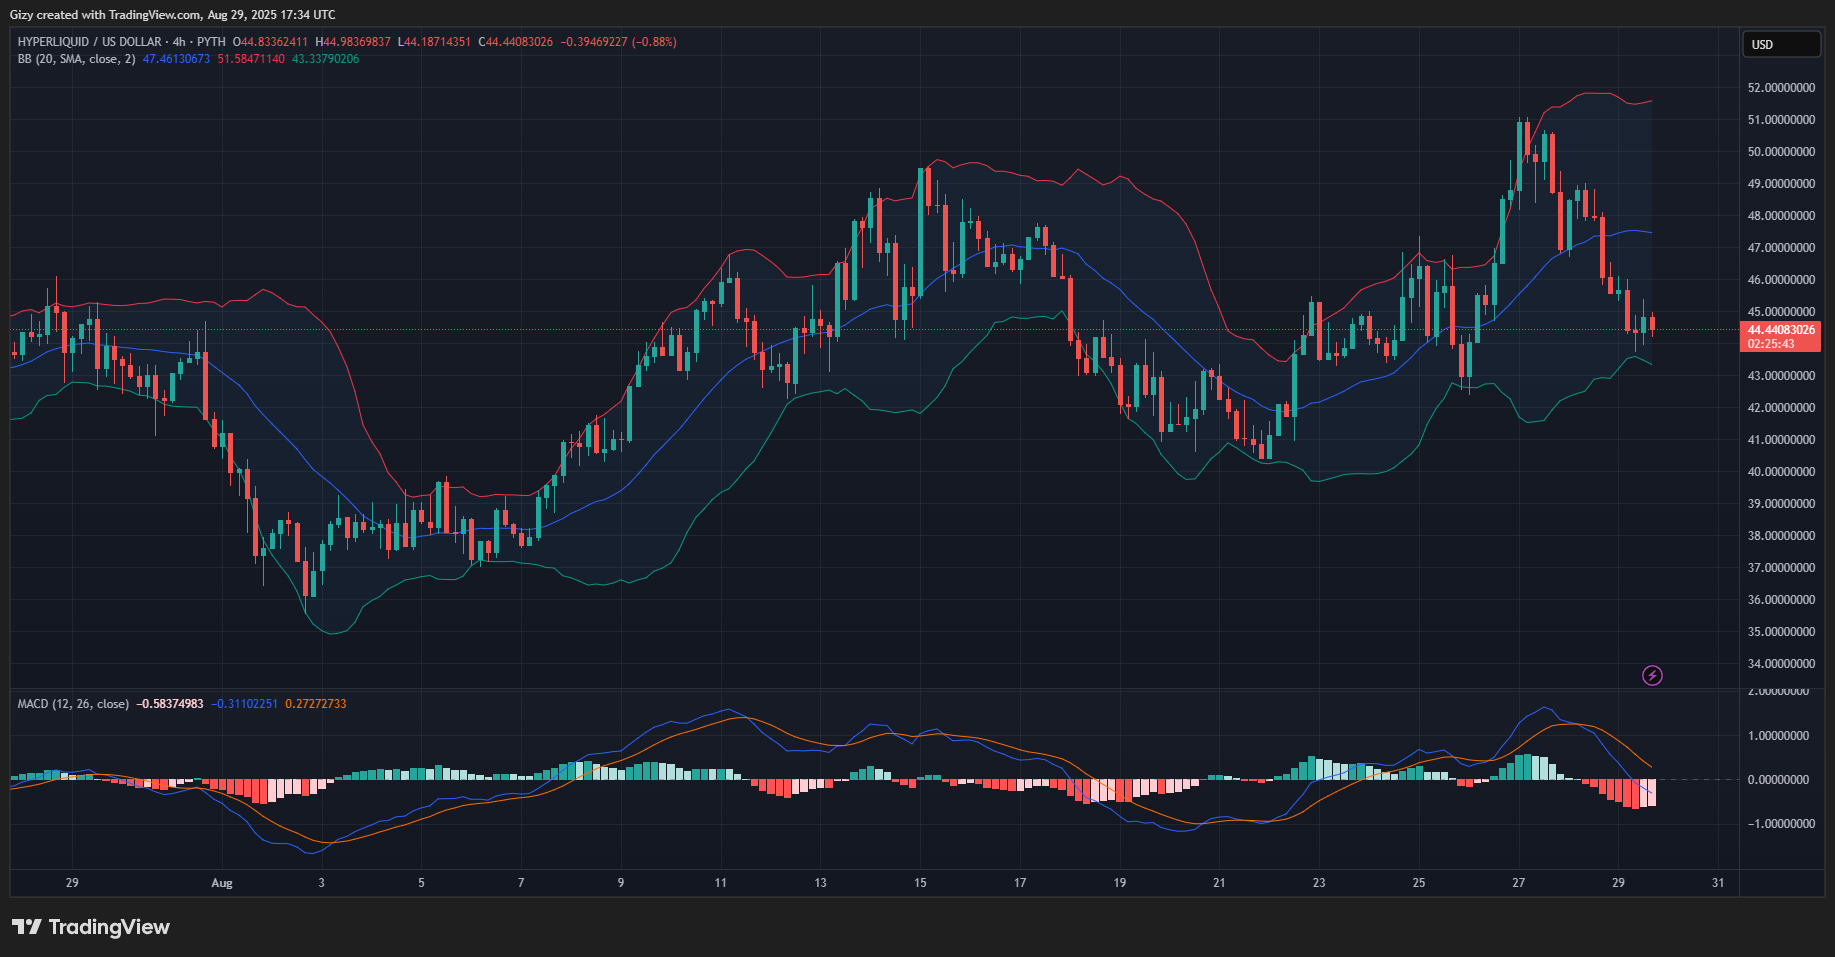
The 4-hour chart shows that the coin rebounded a few minutes ago and printed a green candle at the time of writing. The bollinger band suggests that the recovery may continue as the asset found support at the lower band.
A similar event occurred on Monday, and HYPE experienced significant increases afterward. If this trend repeats, the asset will likely surge closer to the middle band at $ 47.5. It is also worth noting that the $47 resistance recently served as the launchpad to test $50.
Previous price movement also supports the prediction of a further uptrend as the rebound took place around the $44 and $43.5 demand zone. Rebounds at this level were strong; the same may happen this time.
SUI/USD
SUI dropped by nearly 6% on Friday, erasing Thursday’s rebound as selling pressure persisted across the Sui blockchain.
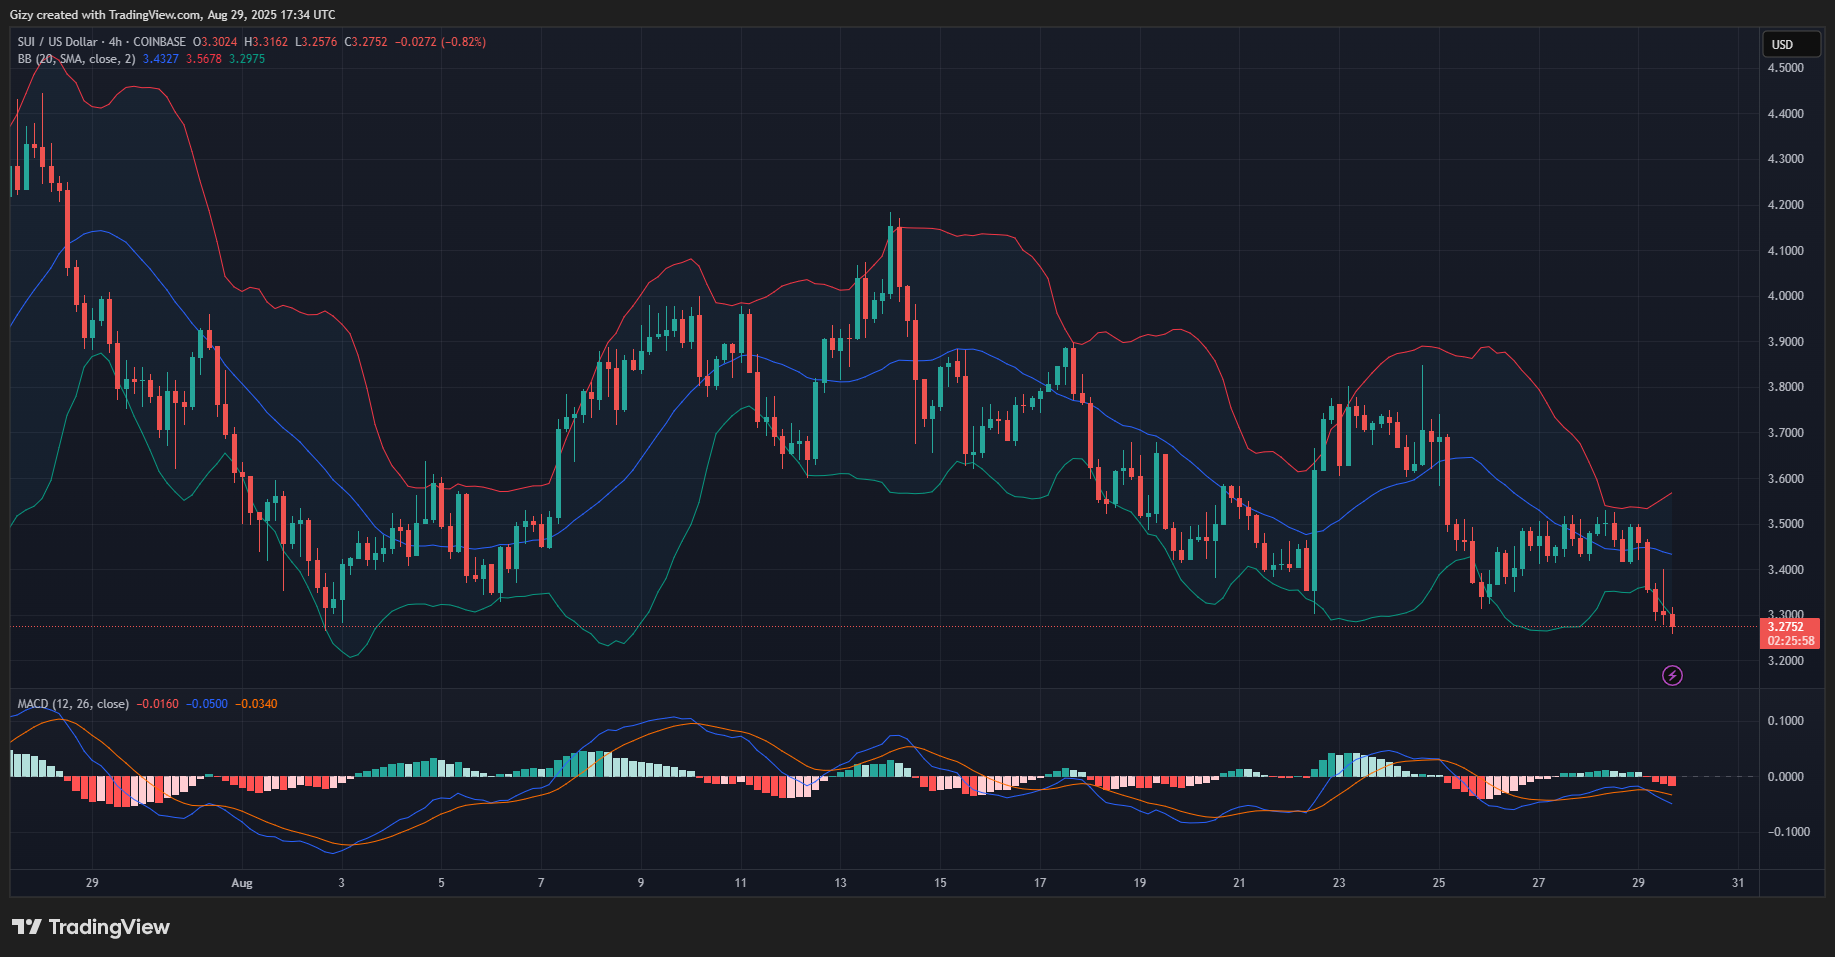
The coin dropped below the Bollinger band in the session starting at 8:00 UTC and has since continued to trade below amid attempts to recover.
Nonetheless, the previous candle is a point of interest as SUI peaked at $3.40. However, the coin has bounced off the same support level three times, indicating that it is trading at a demand zone. This may trigger further increases.
XLM/USD
XLM started the day at $0.382 but retraced and now trades at $0.354. The 4-hour chart shows that the altcoin has not registered any significant increase, as every buyback attempt ended with a slight decline.
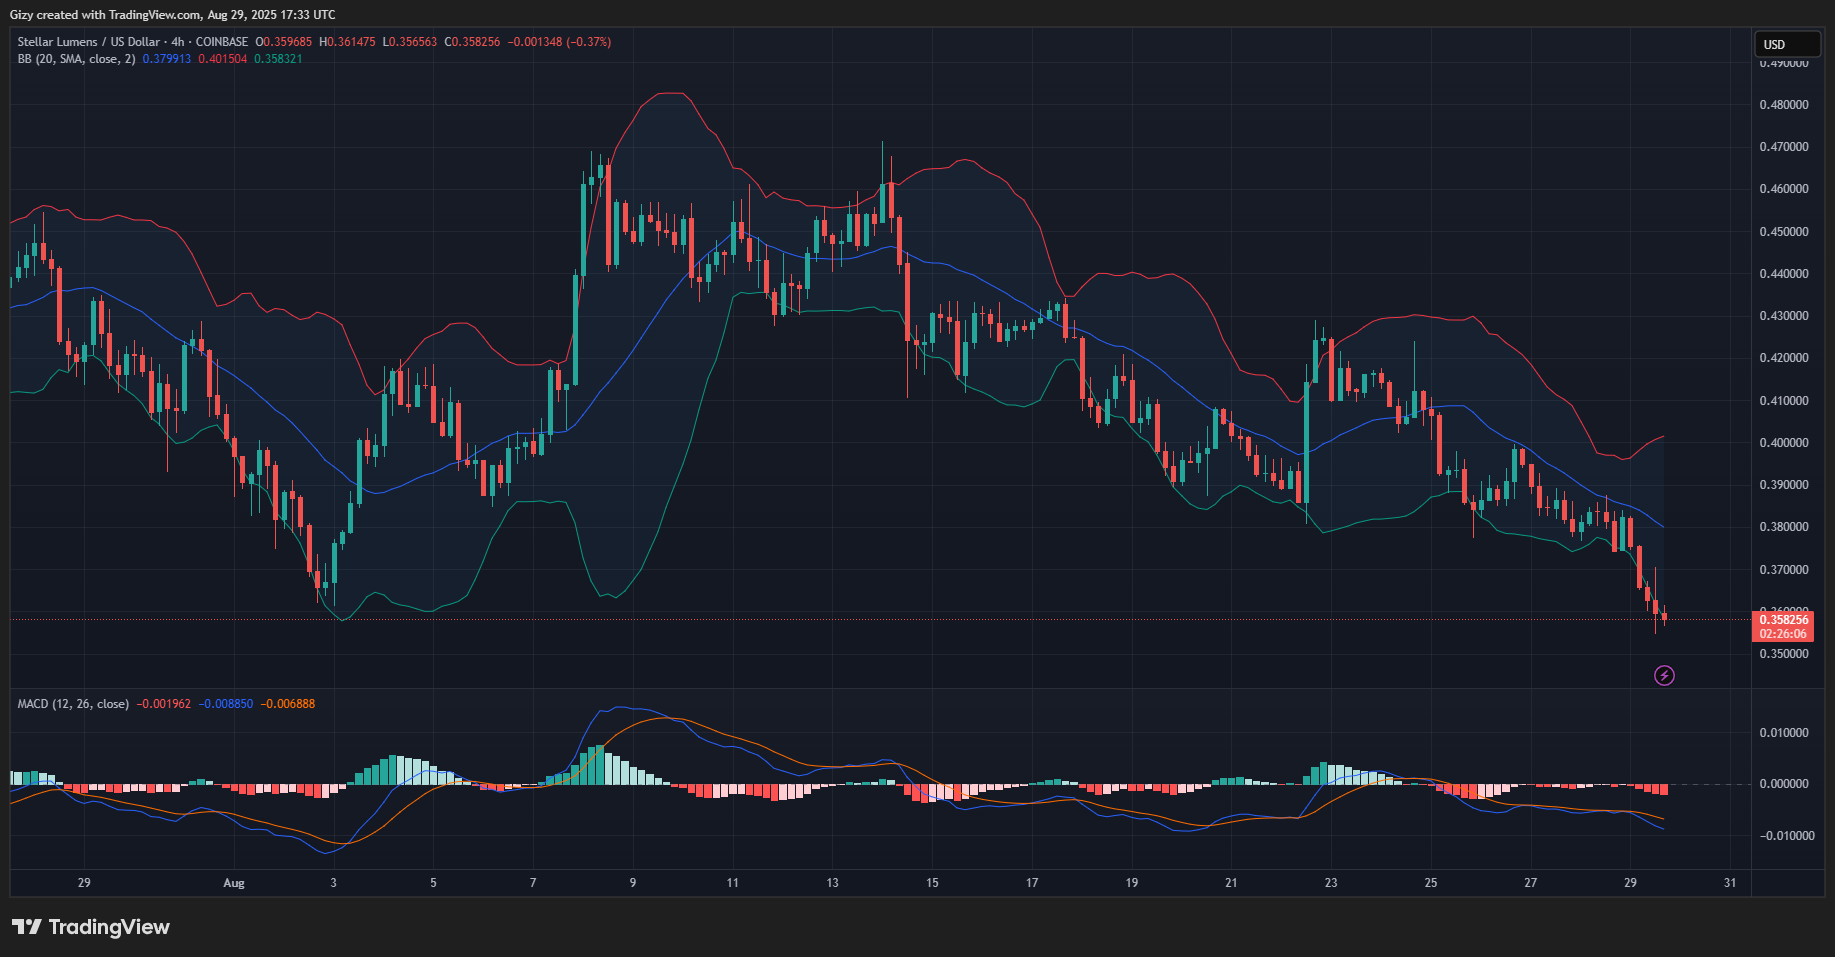
Like LINK, the asset rebounded and is seeing slight increases at the time of writing. The previous candle shows that it found support at $0.355. The last time it tested this mark was on August 2, and it saw massive increases afterwards.
XLM may surge higher, reclaiming the $0.380 mark in the coming days. Nonetheless, further decline will send prices as low as $0.34.
BCH/USD
BCH has registered a 3% loss since the start of the day. It opened at $557 and reached a high of $560, but is currently trading at $537. It printed a doji on the 4-hour chart at the time of writing, peaking at $539 after opening at $534, then retracing to a low of $533.
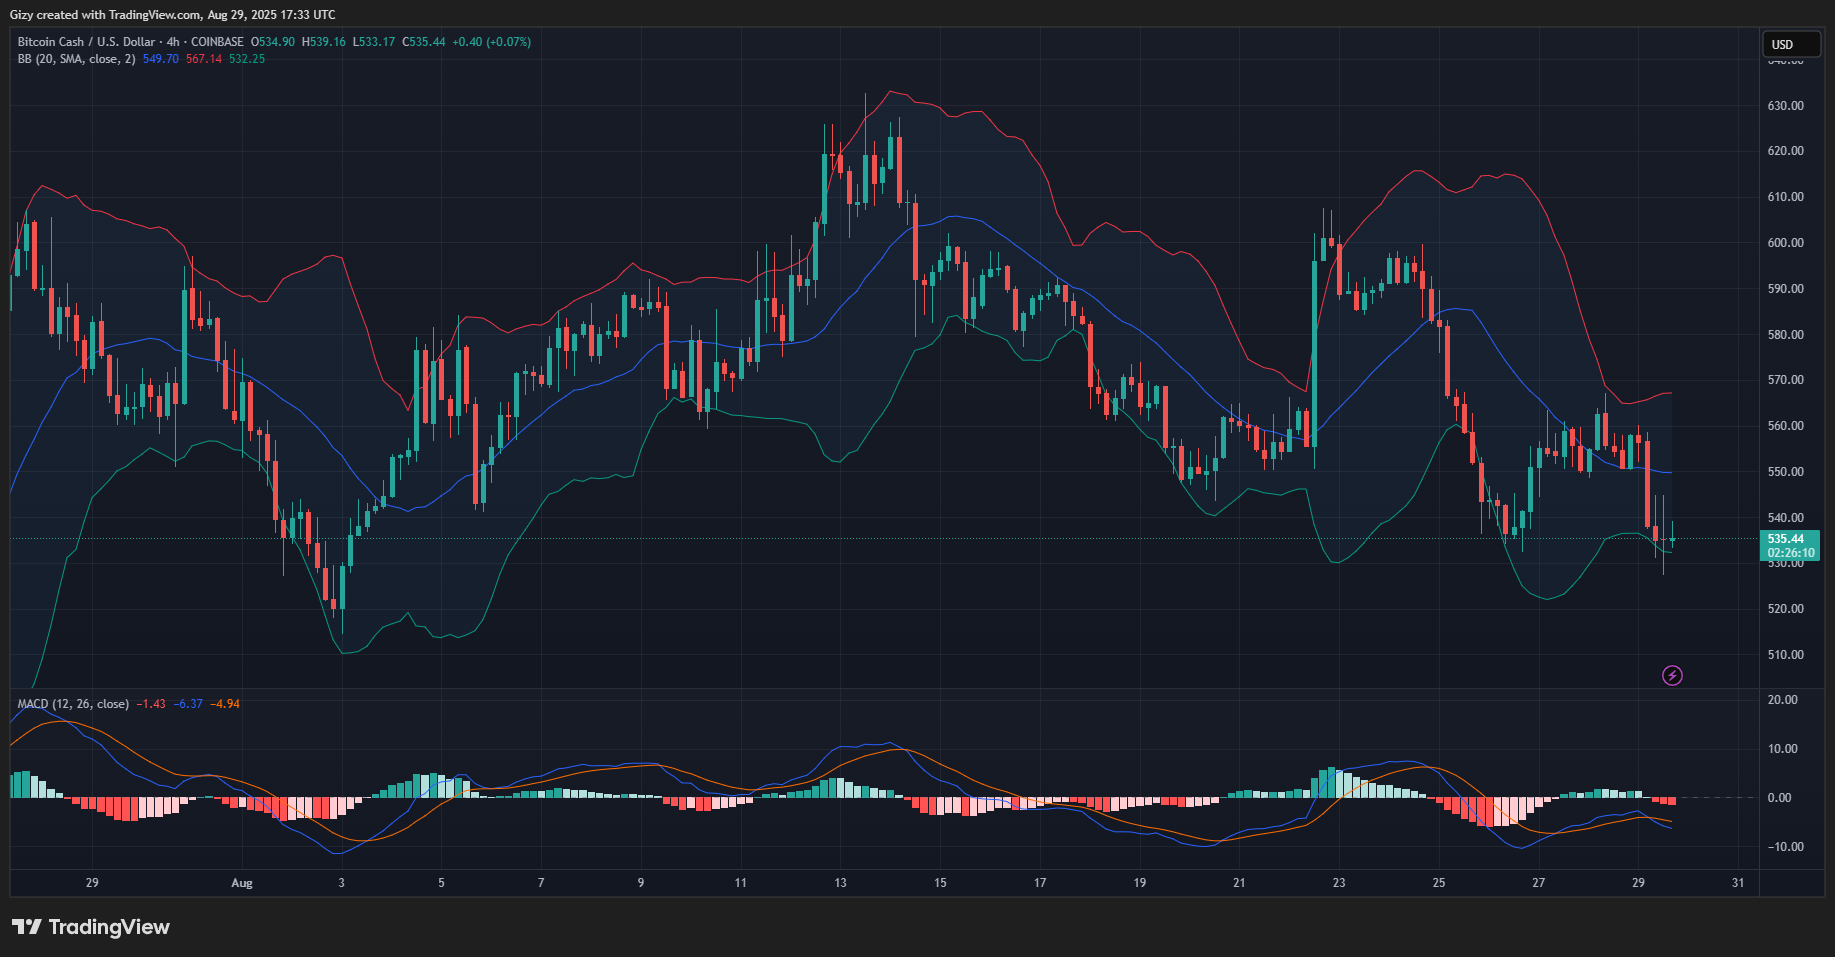
BCH is seeing slight increases at the time of writing. The previous candle is one of the longest on the chart, indicating that the coin rebounded. With buybacks in view, the coin may continue to rise upwards.
However, previous price movements indicate that it will experience rejection at $545. Nonetheless, it is worth noting that the asset is registering a higher low, and it rebounded off bollinger’s lower band. This may signal further uptrends, sending the asset to $560.
AVAX/USD
Avalanche experienced a decline in trading volume today and is currently experiencing a 5% loss. The 4-hour chart indicates that the price dropped to a low of $ 23.30, then rebounded and attempted to surge higher, but made only minor notable changes.
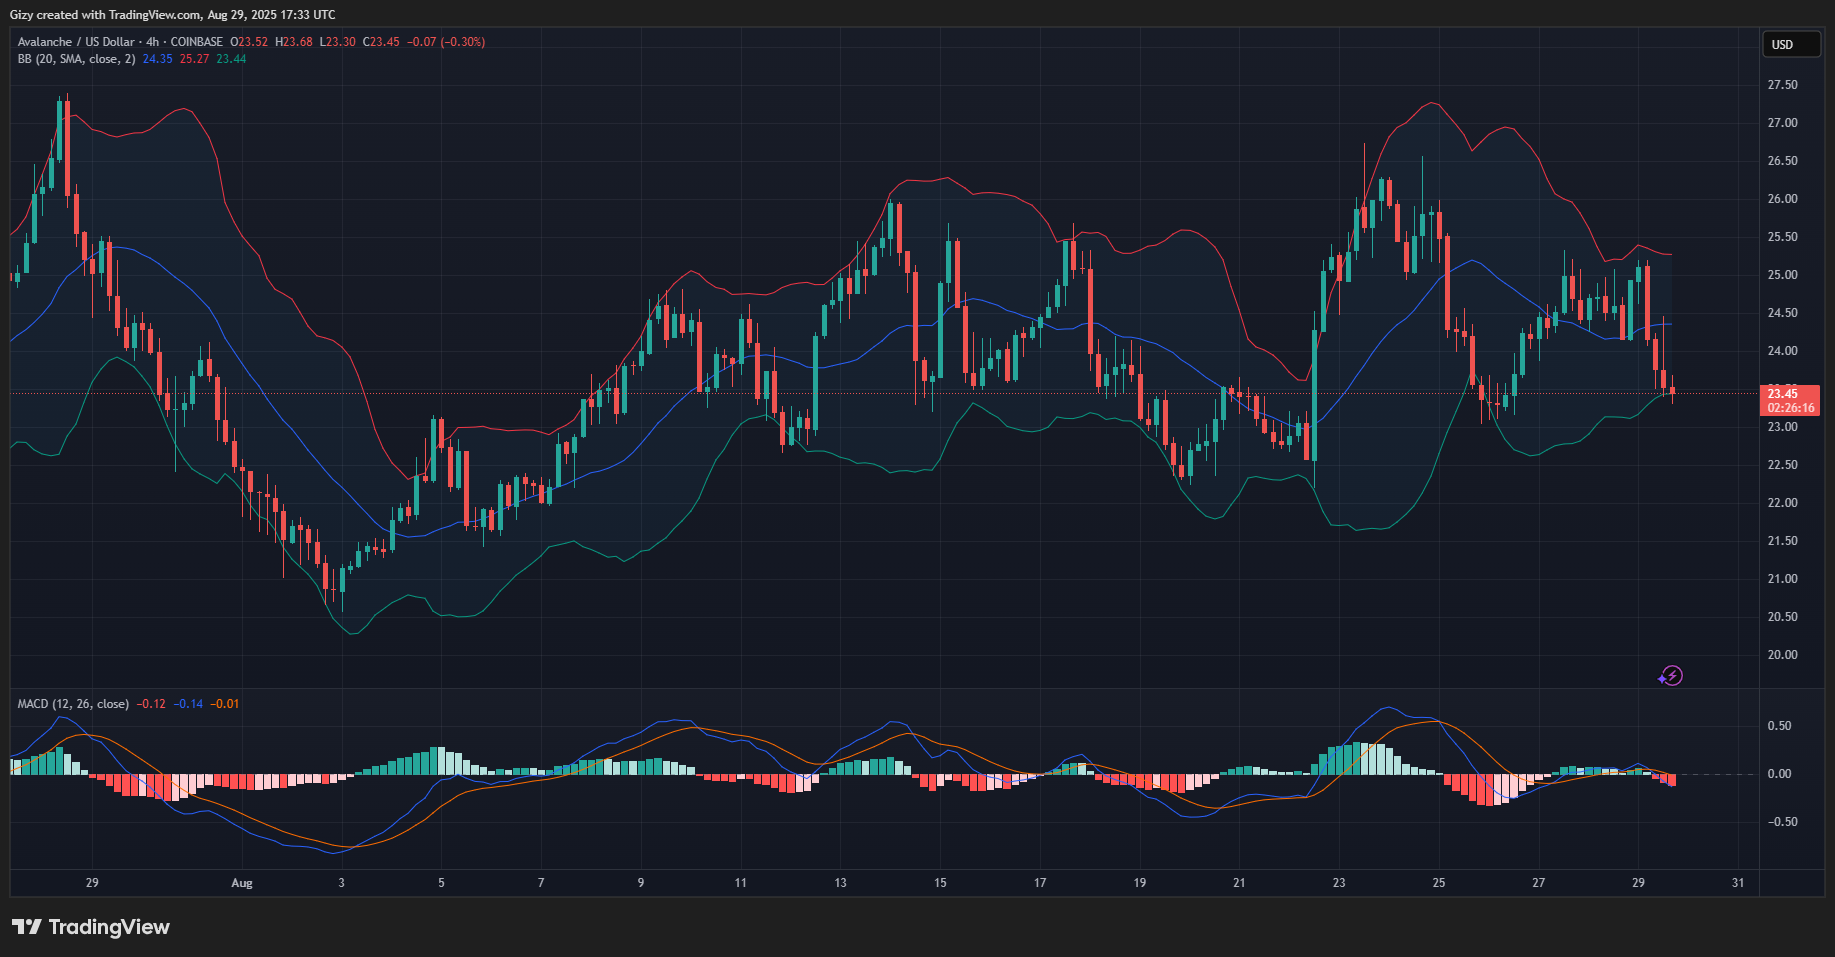
The chart shows that AVAX rebounded after briefly slipping lower a few minutes ago. However, it is worth noting that the bounce happened around a demand zone, but previous price movements suggest that the uptick may be short-lived; this demand often fades out.
AVAX may resume its downtrend, dropping to a stronger level around $23.
HBAR/USD
Hadera started the day at $0.239. It is currently facing a massive downtrend in trading activity, having lost 5% since the start of the day. The 4-hour chart indicates that it did not register any notable increase.
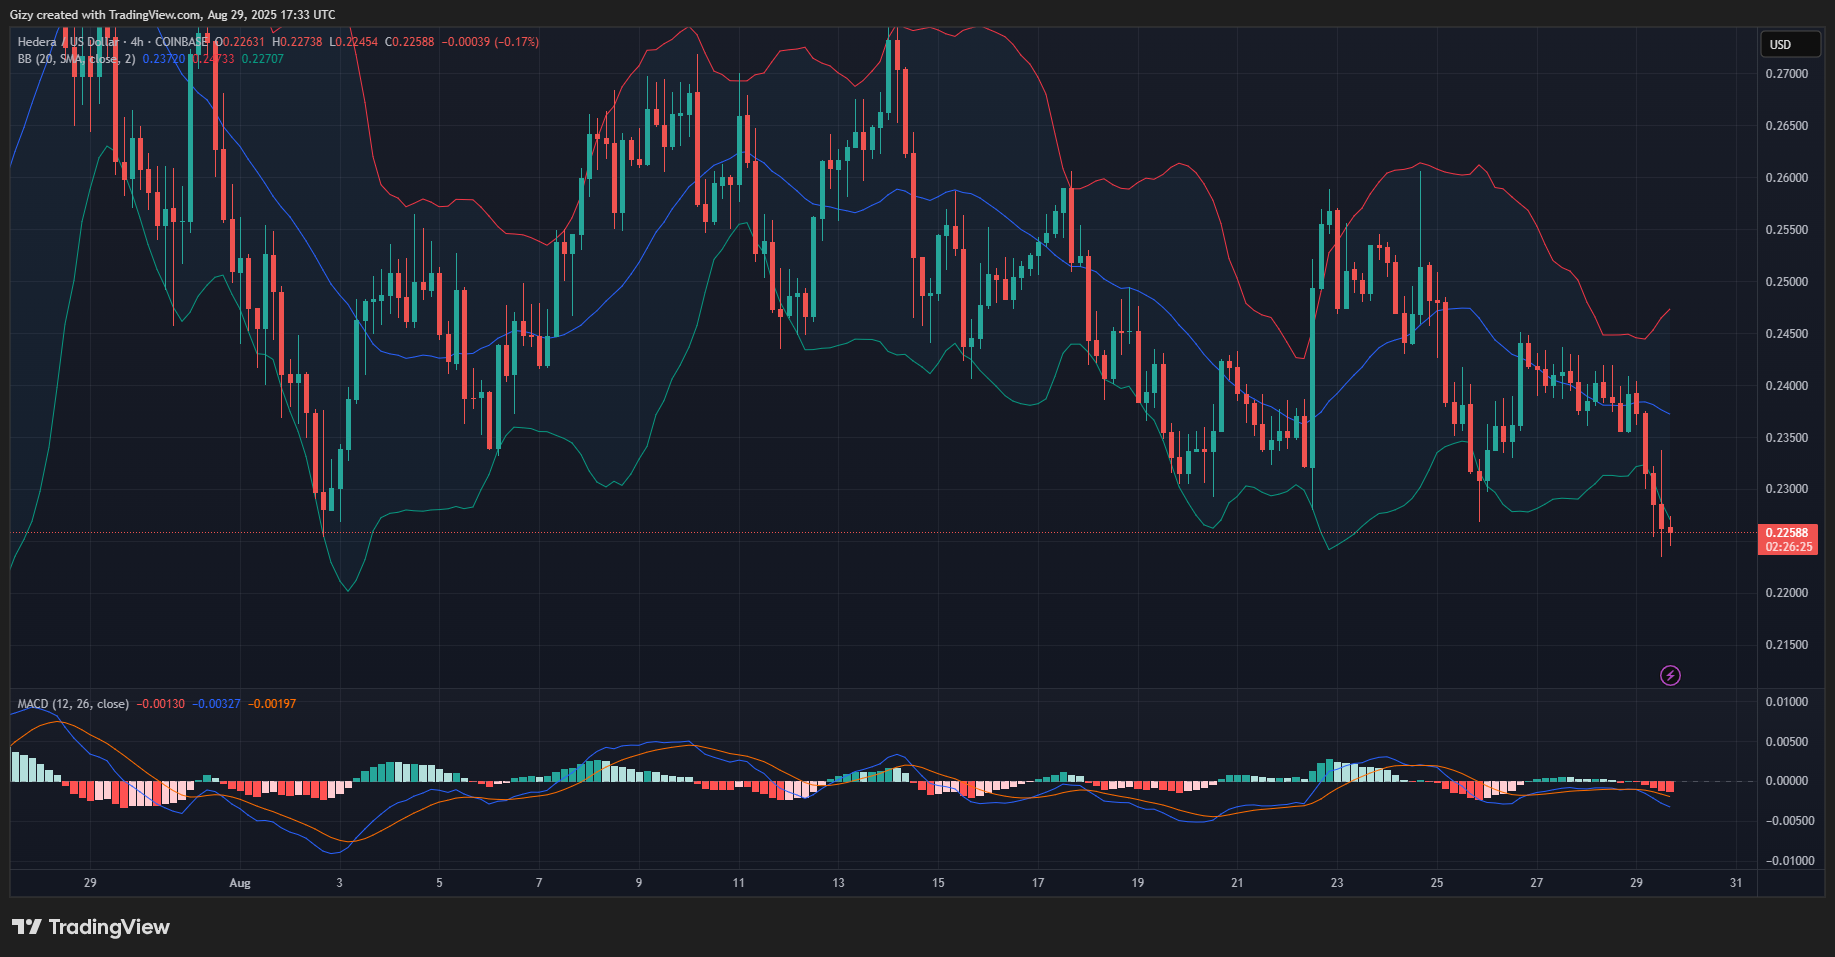
Nonetheless, HBAR is fast approaching its previous low as its slight uptick fizzled out. It is worth noting that the asset reached its lowest value in August and is now at a make-or-break level. Failing to hold this key level will send it to $0.21.
However, further rebound at this level sees the altcoin surge above $0.235.


