PEPE recorded one of its biggest surges on Wednesday, ending the day with gains exceeding 9%. The uptick followed sustained upward momentum over the previous two days.
Commenting on the price spike, one analysis identified two possible catalysts. The first was news that Justin Sun may be the largest PEPE holder, with wallets associated with him reportedly receiving 3% of the total supply. The second was Canary Capital’s updated filing for a spot ETF tied to the asset.
The report also noted that the uptrend was driven purely by fundamentals and that the buzz surrounding these recent announcements would eventually fade. It added that, following a rejection at a well-known resistance level, the likelihood of further declines remained high.
Interestingly, PEPE recorded another massive surge on Thursday. A search for possible catalysts points back to the previously mentioned fundamentals. This suggests that traders are still holding on to expectations that something significant may be coming for the altcoin. They may also be anticipating ETF approval following Canary Capital’s updated filing.
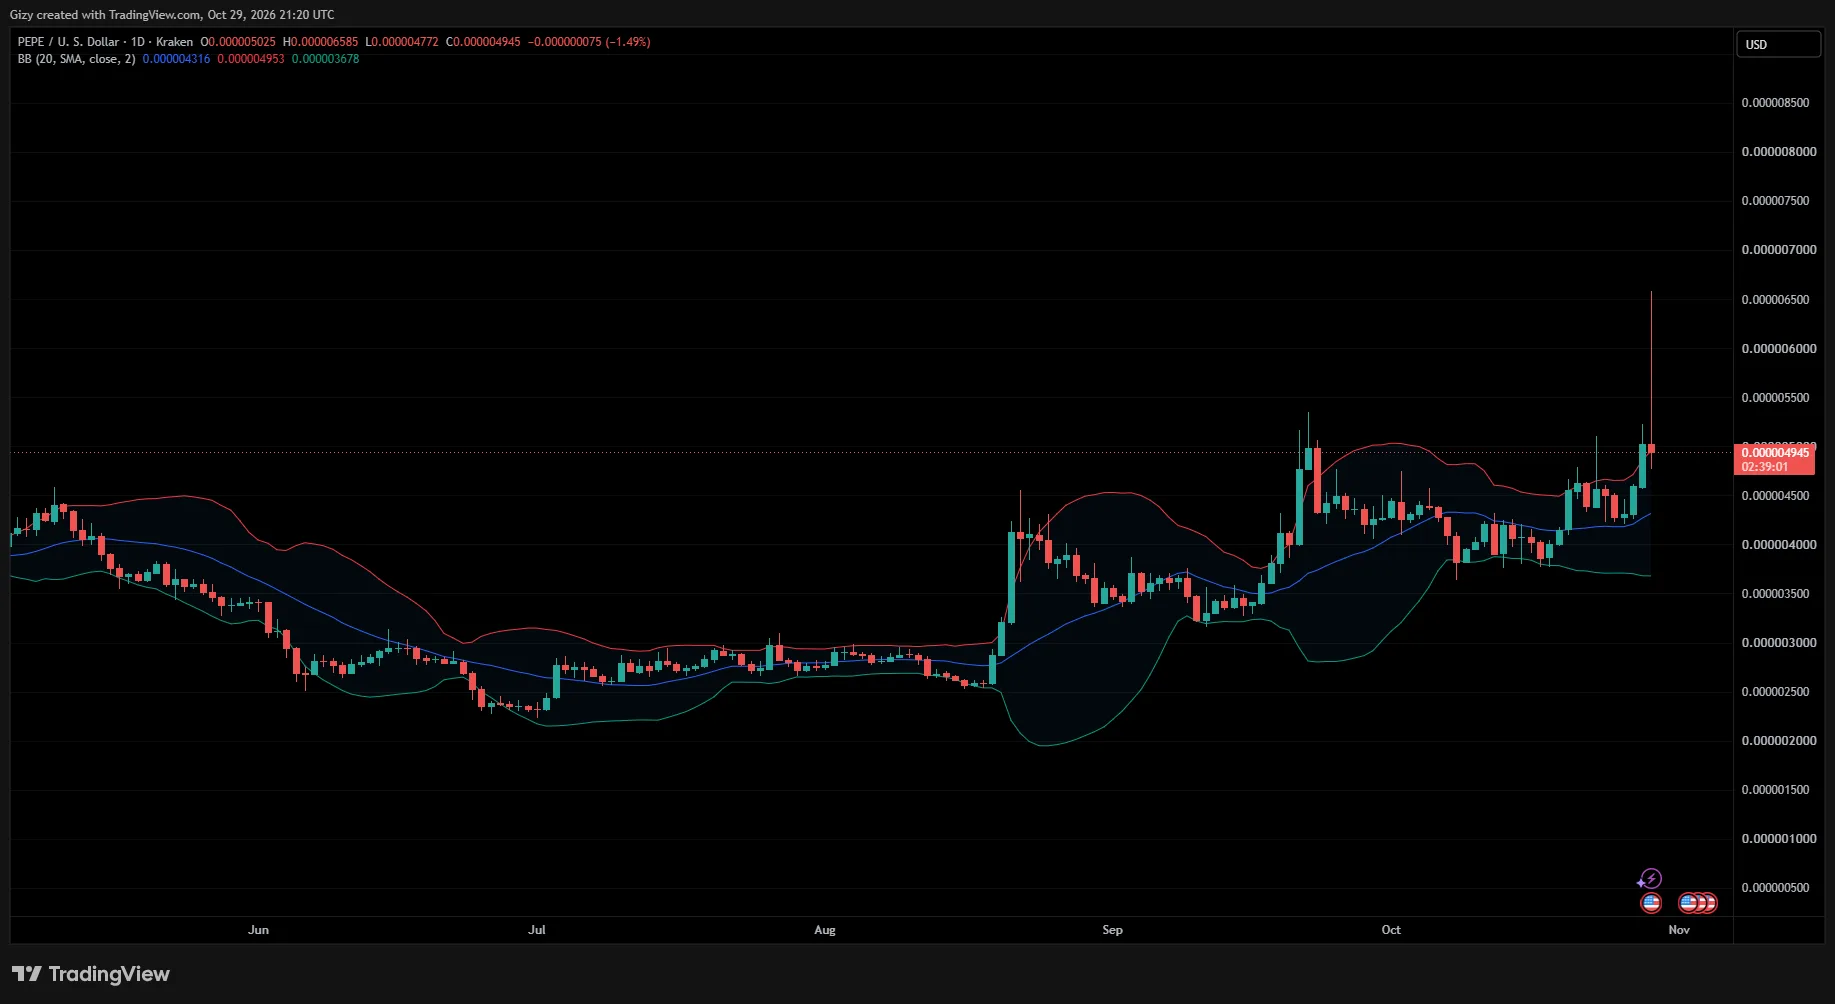
Looking at price action, the memecoin broke above $0.0000050 and peaked at $0.00000658. The 4-hour chart shows that almost all the gains occurred during the session that started at 12:00 UTC. At its peak, the altcoin was up more than 30%, but it crashed shortly afterward.
Nevertheless, PEPE remains up more than 4% on Thursday despite the sell-off. This raises the question of whether the uptrend is finally over. Such a sharp move strengthens the possibility of further selling pressure in the coming days. However, if PEPE closes near its current price of $0.0000052 and posts another green candle above that level on Friday, it could attempt to fill the fair value gap created over the last 24 hours.
PEPE Up 23% This Week
On the 1-week chart, this is the asset’s most profitable session of the month. PEPE is up 23% in almost four days, extending the previous week’s uptrend, during which it gained more than 6%.
Looking at its price action this October, two of the last three weeks ended with notable losses. However, the asset has since recovered from part of its decline. As a result, it could end the month with gains exceeding 15%.
Shifting attention to the 1-month timeframe reveals a more bullish picture. A green close to the current session would mark PEPE’s fourth consecutive month of notable gains. Cumulatively, the memecoin is up almost 120% over the last four months.
The uptrend began with an impressive 18% gain in July, followed by an almost 30% increase in August. Interestingly, a recurring pattern becomes visible when examining price action during this period. The memecoin created a fair value gap (FVG) in one month and filled it in the following month.
This pattern began in July, when PEPE surged to a high of $0.0000031 but closed at $0.0000027, creating an FVG of approximately 11%. It filled this gap in August and created another one worth more than 21%. The pattern continued into October, when PEPE filled the FVG created in September.
The candle representing the current month also shows another long upper wick. It remains uncertain whether the memecoin will fill this gap in November.
Beyond this recurring pattern, maintaining an uptrend for four consecutive months is an impressive feat. It could also be an early indication of a broader bull market. After considering these developments, the question is whether the uptrend will continue over the next 30 days.
The Odds of an Uptrend
For the first time since its inception, PEPE has maintained upward momentum for four consecutive months. A review of its previous price action on the 1-month chart shows that it has never recorded gains for three consecutive months. Its previous maximum was only two.
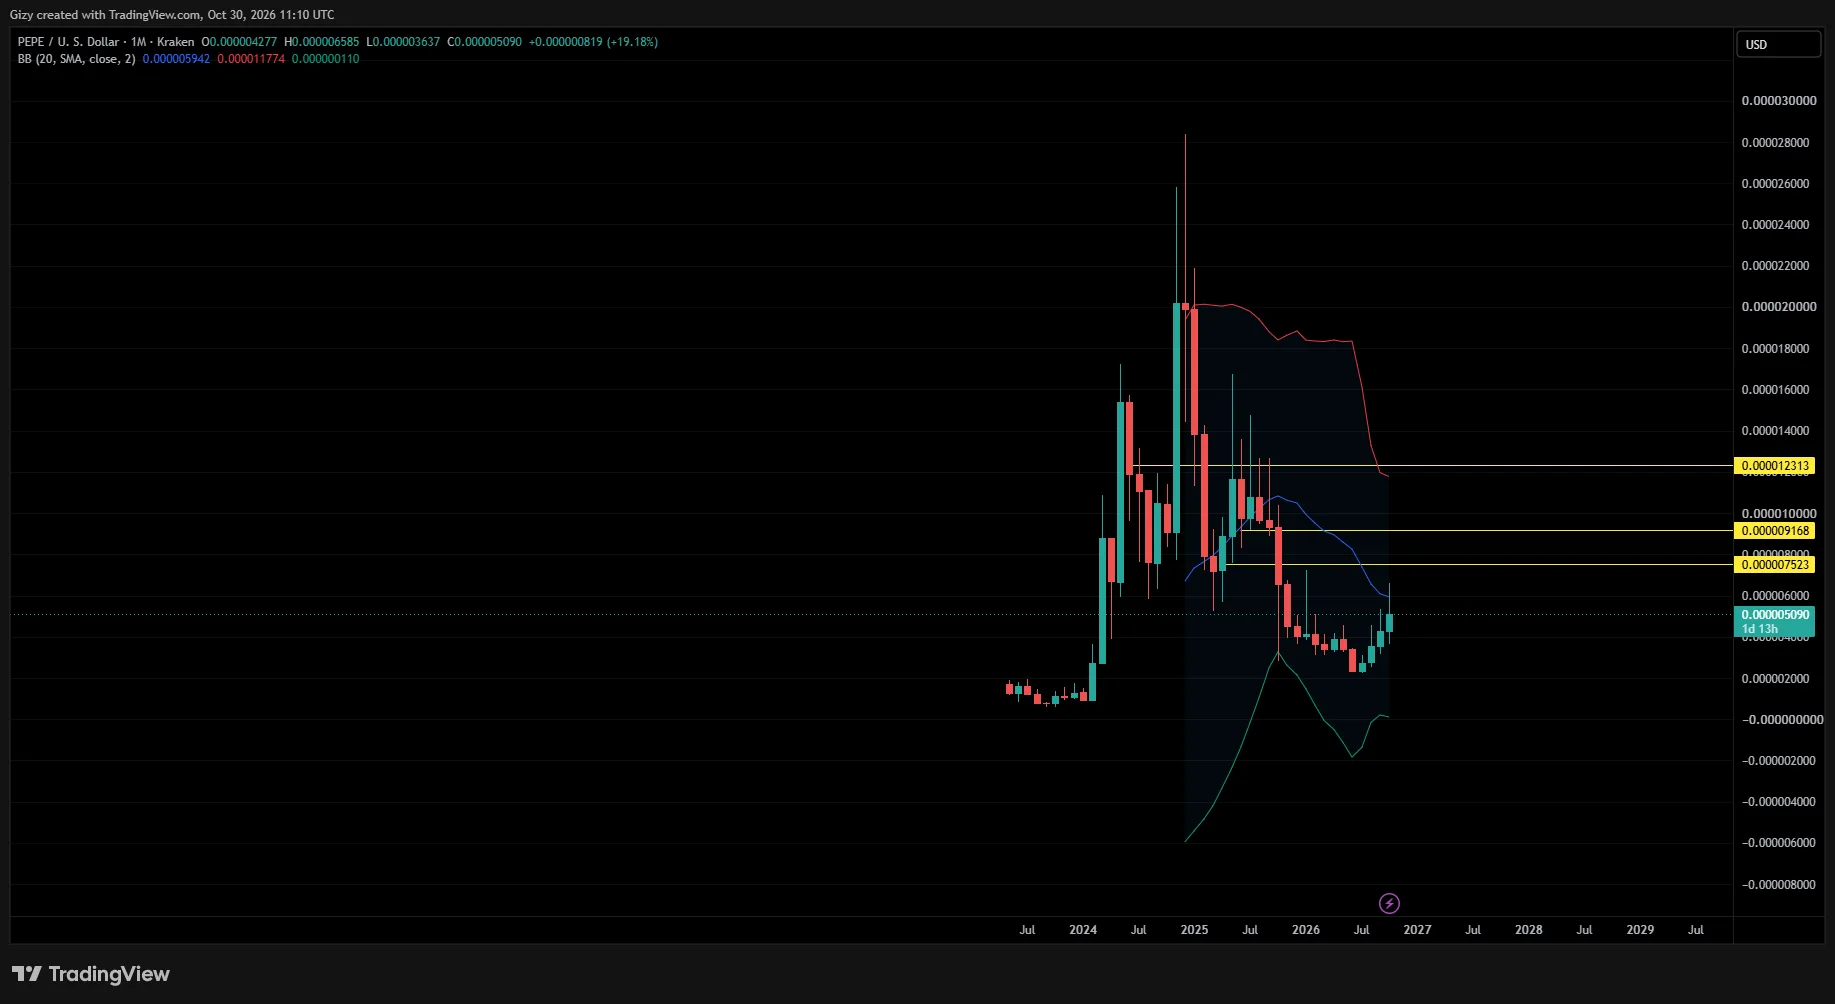
While gaining 120% in 120 days is impressive, the risk of a retracement increases as prices climb. At the time of writing, the likelihood of a significant correction appears elevated. One indication is the long upper wick on October’s candle.
This is a double-edged signal, as it could provide the basis for another surge while also indicating intense buying exhaustion. If the latter is the case, the coming month could end with significant losses.
The Bollinger Bands on the 1-week chart also suggest that a decline could occur. The recent retracement followed several attempts to break above the upper band. Although such moves do not always signal a sell-off, breakouts above the bands have often been followed by significant pullbacks.
On the 1-month timeframe, the middle Bollinger Band is acting as resistance. If a downtrend develops, a decline toward $0.0000040 is possible.
Although the outlook for November is bearish, this may not necessarily derail the longer-term prospects for the 2027–28 bull market.
PEPE Price Targets for 2027/28
Key Targets
- $0.0000075
- $0.0000092
- $0.0000012
- $0.00000156
The scale of the next bull market remains uncertain. However, if history is anything to go by, previous price movements may offer some insight into what to expect. Following its initial 10x surge a few months after becoming a tradable asset, PEPE experienced two additional periods of significant upward momentum. The first ended with an almost 280% increase before a retracement followed.
The second rally ended with a 130% gain. Across these two periods, the asset recorded an average increase of approximately 210%. If a similar uptrend occurs over the next two years, it could translate into a surge toward $0.0000156.
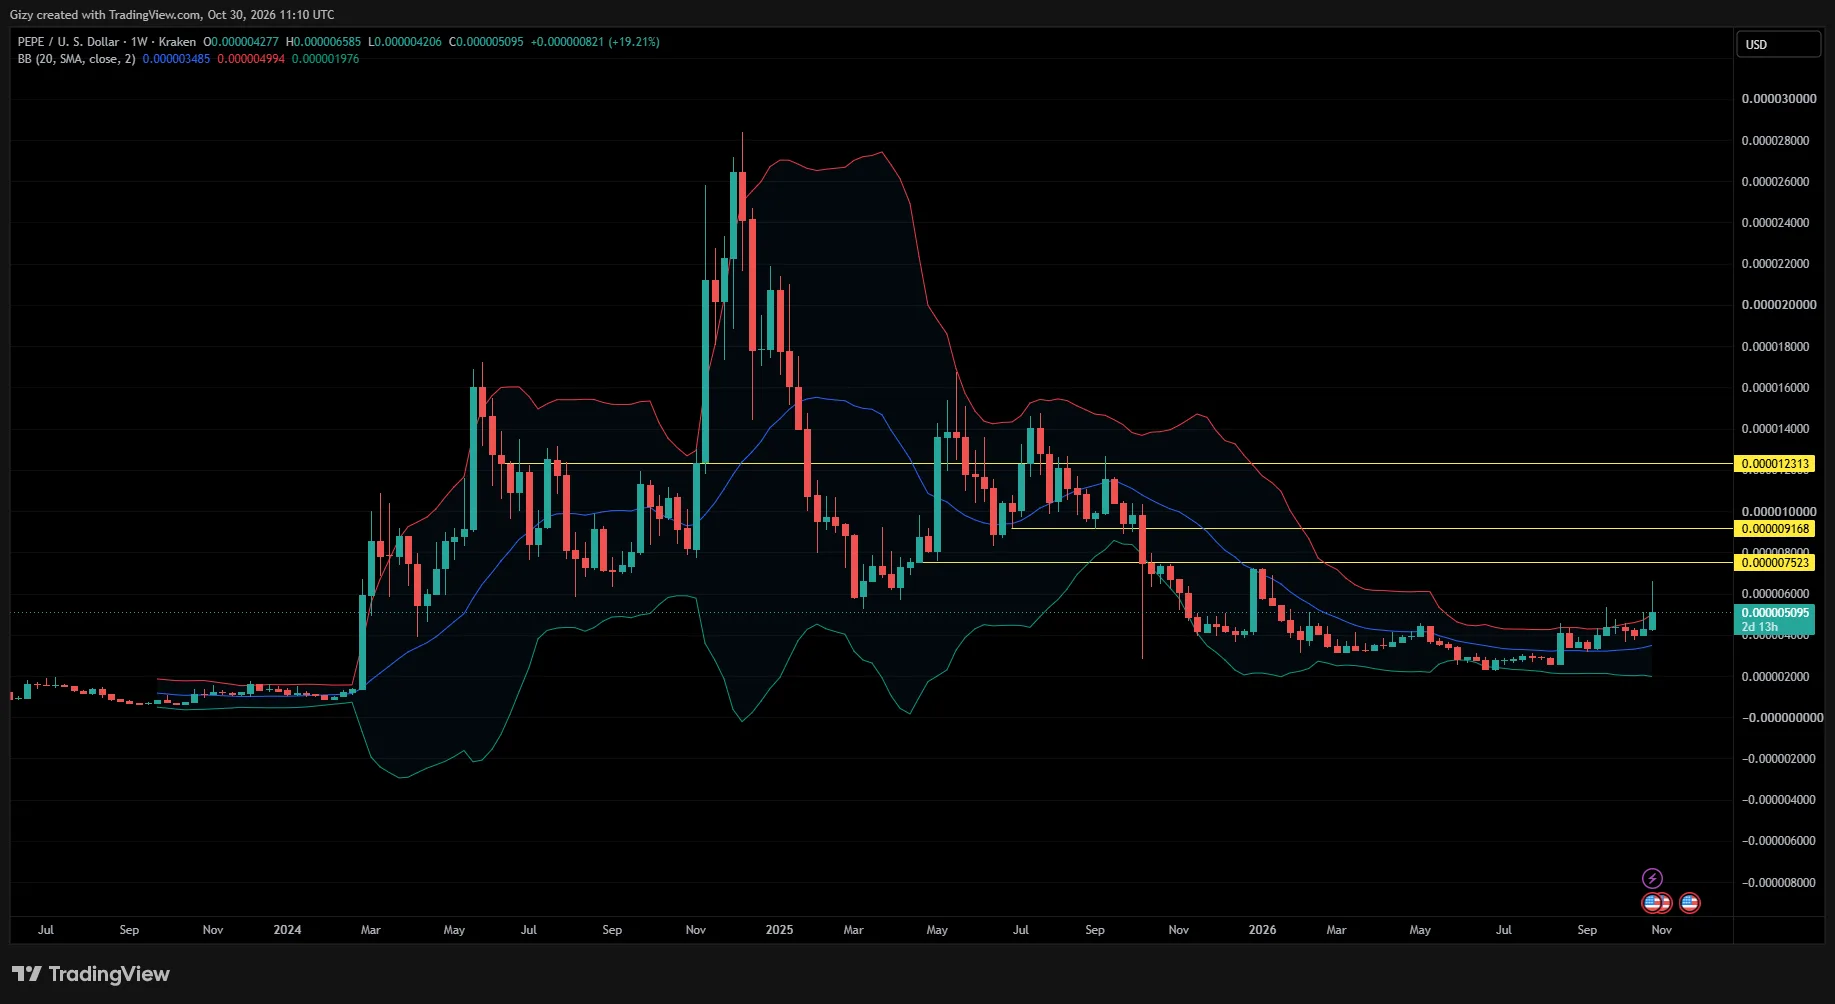
While this prospect may seem enticing, there are several price levels to watch. The 1-week chart provides a clearer picture of why these levels matter.
The first is $0.0000075, a level PEPE struggled to break above for more than a year. After losing it in October 2025, selling pressure accumulated around the level, preventing subsequent attempts to reclaim it.
If bulls manage to break above this mark, the next level to contend with is $0.0000092. This level acted as a strong support in 2025 and could become an even stronger resistance given its previous significance.
The final obstacle on the path to $0.0000156 is $0.000012. It has acted as resistance for much of the last two years. Previous price movements show that several attempts to break above it have failed, reinforcing its position as the toughest resistance level on the list.
Interestingly, PEPE’s first attempt to reclaim this level since 2025 began from around $0.0000075. This suggests that breaking through the earlier resistance could increase the likelihood of eventually overcoming the strongest barrier.
Beyond price action, one catalyst to watch during this period is the potential ETF approval. Such a development could accelerate PEPE’s price movement in the coming years.