DOGE recorded notable gains during the first half of the week, peaking at $0.081. However, it has since turned red on the 1-week chart and could be heading for another bearish close.
The broader cryptocurrency market printed its largest bearish candle of the week on Thursday, shedding more than 4%. The decline continued on Friday, but buying pressure subsequently returned, allowing valuations to recover slightly. The Binance hack triggered the massive sell-off, and DOGE surrendered all the gains it had accumulated earlier in the week.
One outlook predicted that the cryptocurrency market could record notable recoveries over the weekend. However, at the time of writing, this recovery is yet to materialize, with most assets edging closer to one of their most bearish monthly closes.
Beyond the current week’s performance, October has been largely negative for the market. ETFs recorded massive outflows during this period, adding to the selling pressure. Among funds tied to altcoins, almost all are heading towards the end of the month with significant withdrawals.
For example, one report suggests that Solana ETFs are heading for their worst monthly performance ever, with outflows approaching $100 million. Beyond the pressure on investment funds, SOL has also faced intense selling pressure in the spot market.
It remains to be seen whether the coming months will bring some relief. Let’s examine what the charts suggest for November.
DOGE/USD
DOGE is edging closer to ending the week in the red, marking another period without notable gains. The week beginning October 5 was particularly bearish, with the asset retracing by almost 10%.
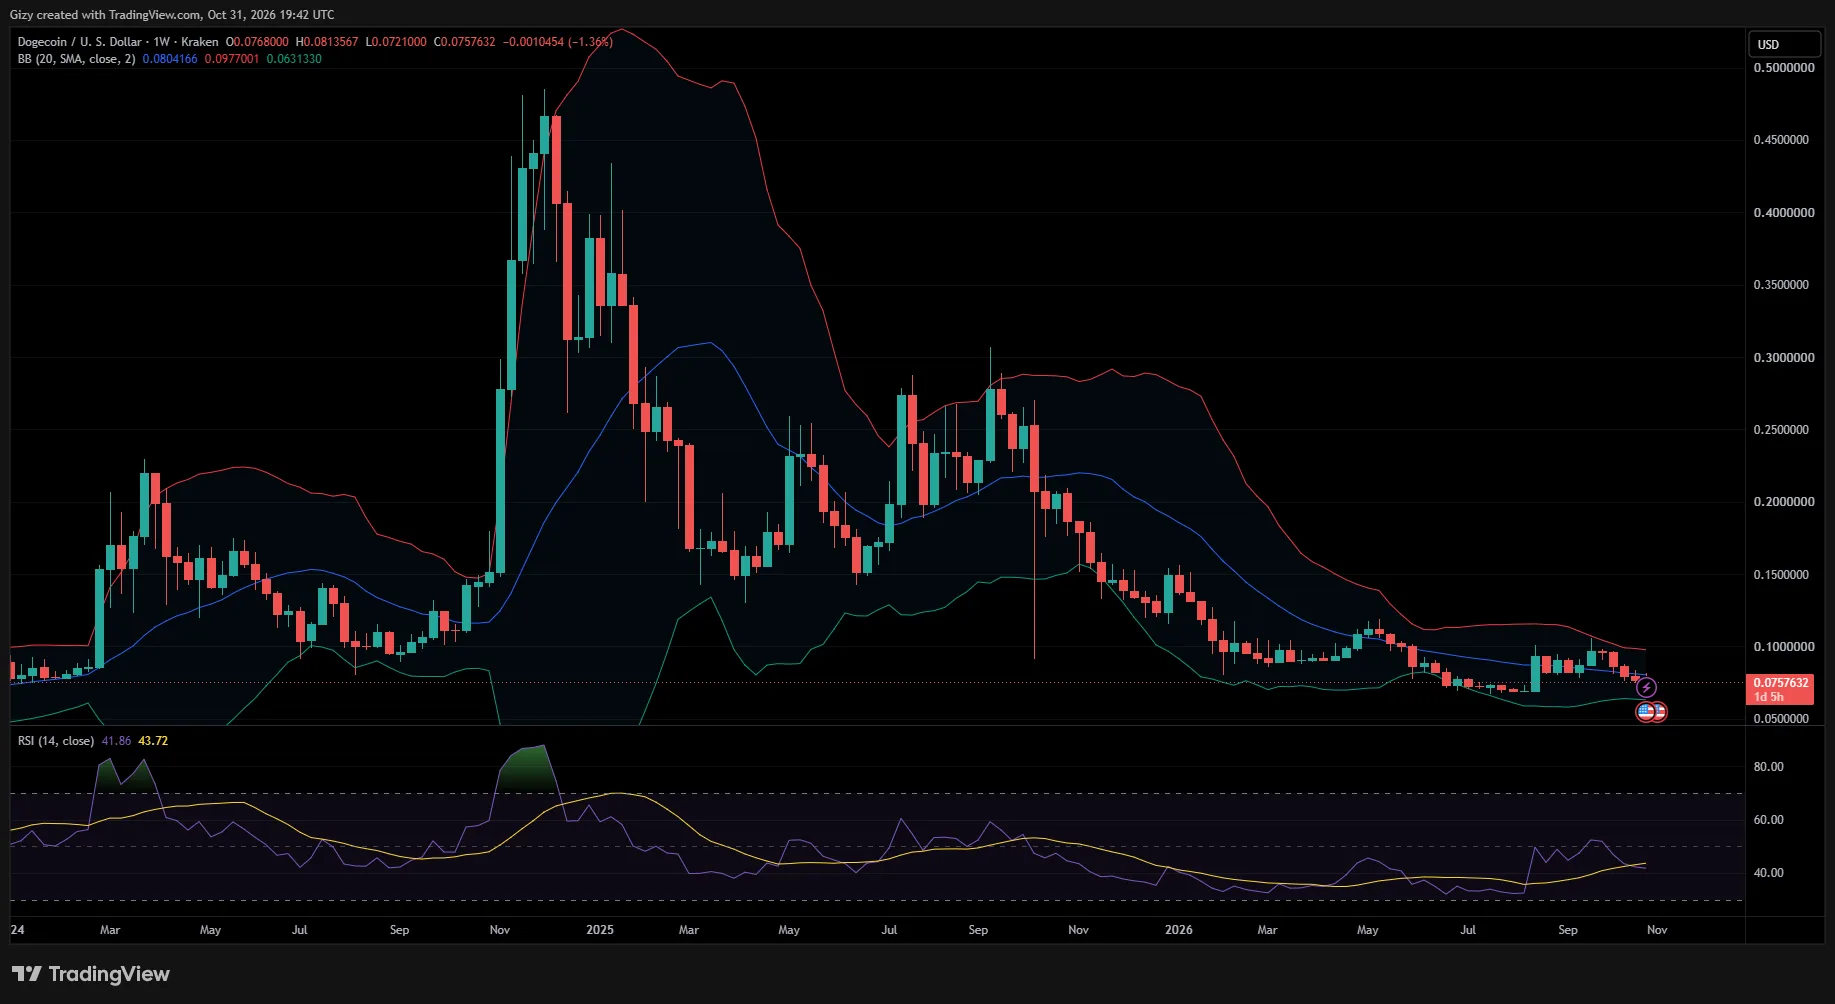
On the 1-month timeframe, the altcoin is set to close with losses exceeding 20%. This decline follows two consecutive months of upward movement, leaving Dogecoin close to erasing the gains accumulated during that period. Despite the ongoing correction, the chart offers relatively few clues about what November may bring.
However, the 1-week chart suggests that the likelihood of further declines remains significant. There are two key factors to consider: the Bollinger Bands and critical support levels.
DOGE attempted to reclaim the middle Bollinger Band last week but faced rejection slightly above it. Another attempt this week produced a similar outcome. Looking at the last two weekly candles, both opened and closed below the SMA, suggesting that the asset has decisively lost this level.
Following such a breakdown, the next level to watch for a potential rebound is the lower band. At the time of writing, this boundary sits around $0.063.
Beyond the indicator, the closest major support to the current price is $0.069. DOGE has rebounded from this level on multiple occasions, making it an important area to watch. A decline towards this mark is possible next month.
ADA/USD
Cardano is down by a few percentage points on the 1-day timeframe. The chart also shows a bearish pattern that has persisted for an extended period. Since October 6, the asset has remained in a downtrend, with successive price movements forming an almost consistent downward slope. The current candle suggests that this trend may continue.
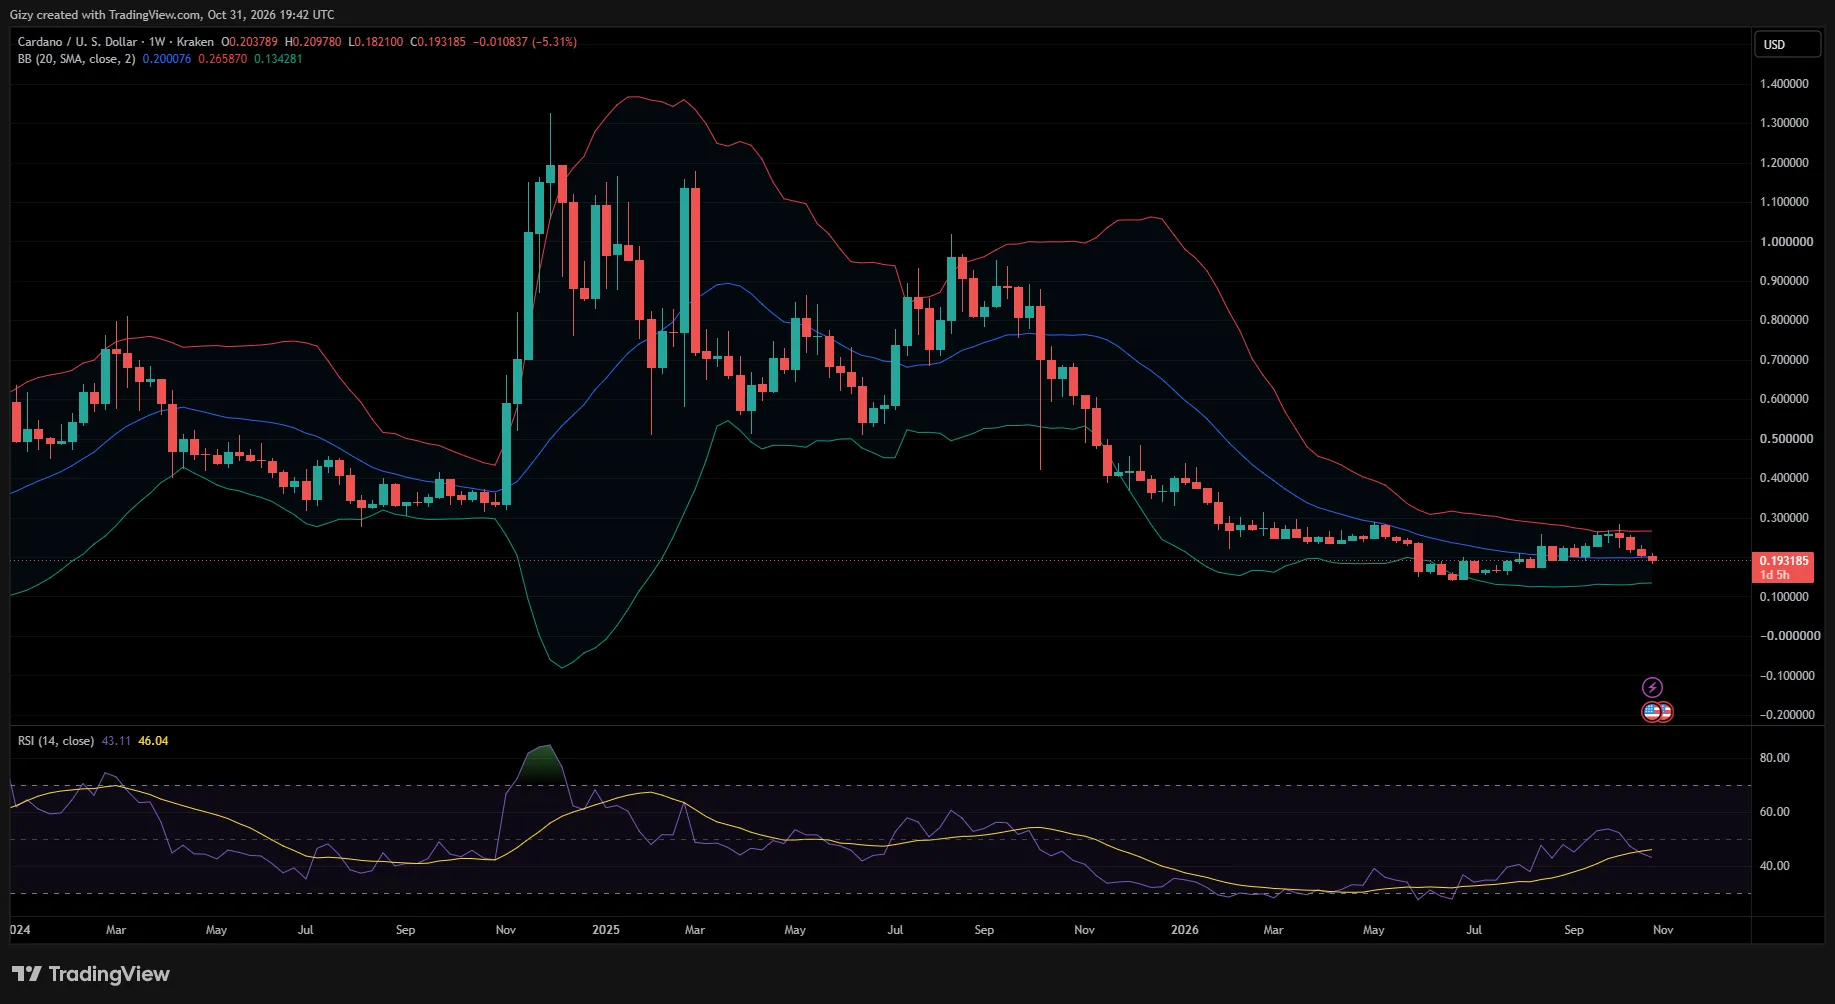
On the 1-week chart, the altcoin is heading for its fourth consecutive bearish close. In hindsight, October has been particularly negative for ADA. Its largest weekly losses occurred during the session beginning October 12, when it shed more than 12%.
Looking beyond the monthly losses, the latest downtrend began after ADA tested the upper Bollinger Band. It has since retraced towards the middle band. Although it is currently trading slightly below this level, the breakdown is not yet decisive. The coming week could therefore be an important turning point.
Interestingly, the 1-day chart suggests that the altcoin could attempt a recovery during this period. Recall that ADA retraced sharply on Thursday, much like BNB. During the decline, RSI entered oversold territory but subsequently rebounded. Based on the latest price action, the asset could see further upward movement over the next seven days.
Returning to the 1-week chart, a bullish close above the SMA next week could provide a stronger foundation for recovery in November. Such a development would increase the likelihood of a shift in the broader trend.
SUI/USD
Sui also experienced a significant downtrend throughout October, following the broader market’s bearish trajectory. Thursday’s sell-off was particularly severe, with the asset recording greater losses than DOGE. It shed almost 7% before recovering a significant portion of those losses the following day.
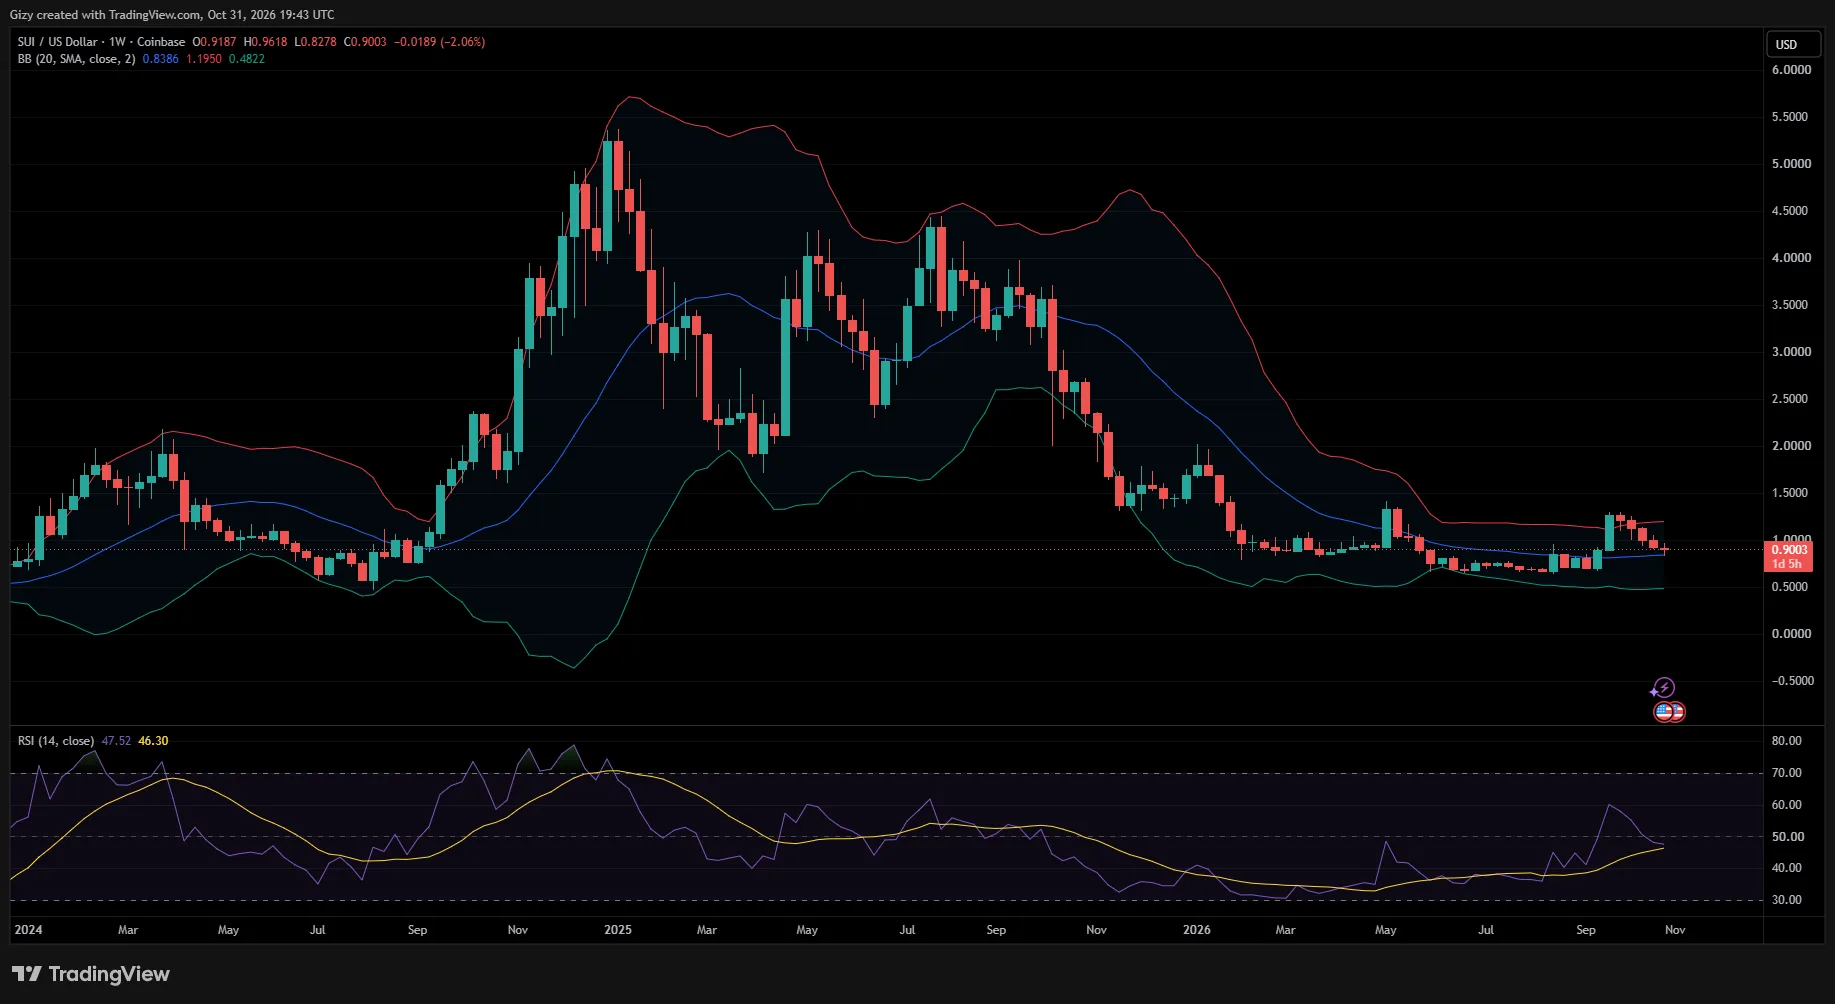
However, upward momentum has remained relatively weak at the time of writing. SUI could end the week with losses exceeding 3% following the sell-off. Although this represents its smallest weekly decline this month, it would still mark the fifth consecutive bearish close.
A closer look at the 1-week chart suggests that selling exhaustion may be setting in. Over the last two weeks, SUI has printed progressively smaller candles, indicating that downward momentum could be weakening. However, whether this translates into renewed buying pressure remains to be seen.
If buyers return, SUI could record a notable recovery next week. A move back towards $1 may follow later in November. Nonetheless, another bearish close over the next seven days could weaken this outlook.
The Bollinger Bands also suggest that the next two weeks will be critical. The altcoin recently rebounded from the middle band, making this an important level to defend. A continued decline over the next two weeks could result in a decisive breakdown, potentially opening the way towards the lower band.
CAKE/USD
On the 1-day chart, CAKE is holding relatively steady around $1.90. Its RSI has also stabilized after recently approaching oversold territory. Based on the latest price movements, buying pressure could return next week, potentially triggering a notable recovery.
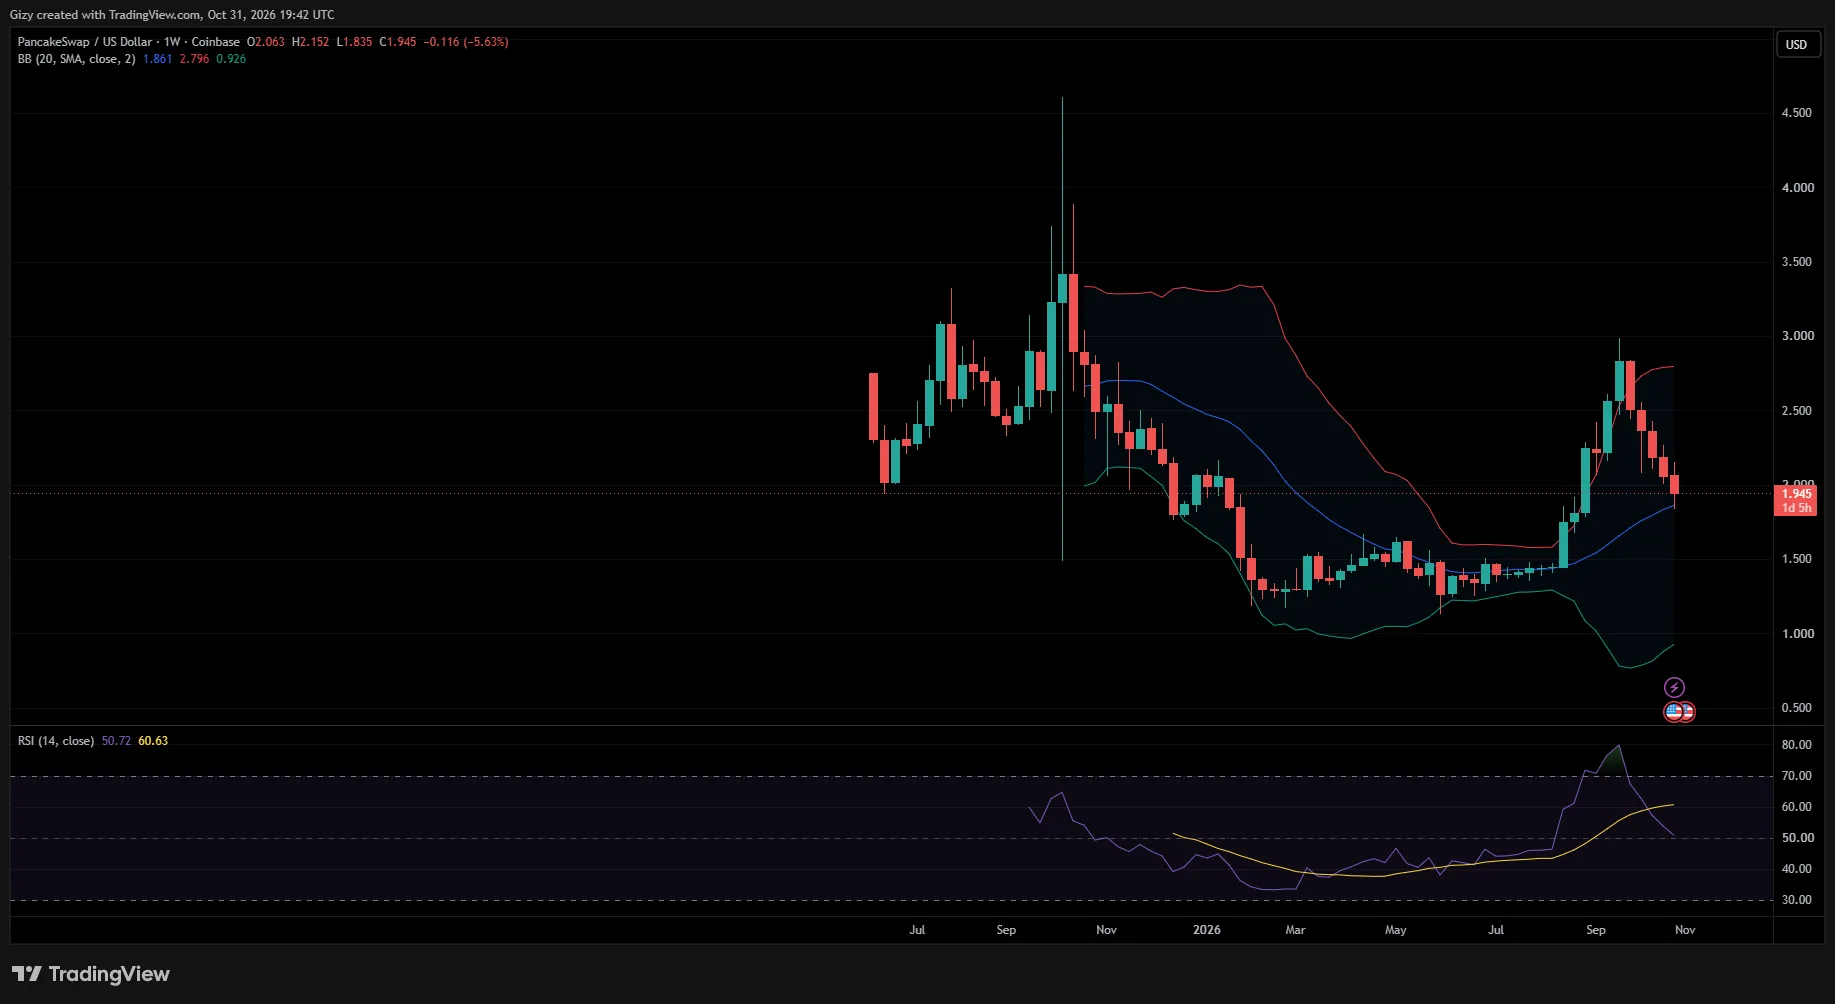
The bulls will look to build on the current support and attempt to reclaim $2.10. Additionally, the Bollinger Bands show that prices have moved back above the lower band on this timeframe, suggesting that the likelihood of further recovery has increased.
On the 1-week chart, however, it is important for the altcoin to record a stronger recovery next week. Further downward pressure could expose it to new lows. A decisive breakdown below $1.80 could open the way for a decline towards $1.64.