

Momentum Trading is not a new concept when it comes to trading. It has been around for a while, and many are reaping its benefits, especially by utilizing momentum trading for cryptocurrencies.
Interestingly, many people engage in this form of investing without realizing it. You may liken it to some of the things you learned and practiced, but you can’t put a name to it, and it feels right.
Many may have those wide-eyed moments when they realize that they have been practicing a strategy that is not only decades but centuries old. However, it is also worth noting that many prefer this style of buying and selling compared to others.
While some are already practicing it, others may have tried out other strategies and are looking to explore new trading plans. Interestingly, this style also appeals to newbies to the concept of crypto trading. In a nutshell, everyone and anyone can try it out.
In this article, we will look at several aspects of momentum trading, which include what it is, its origin, some examples, and whether you should engage in it. Let’s start with the definition.
Momentum Trading in Cryptocurrencies Explained
A sweep through the internet reveals several definitions for momentum trading. It is a strategy that pursues directional movements of an asset’s price with the hope that the asset will continue in the same direction within an established trend.
Another definition is that it is a style that heavily relies on the notion that an asset that has performed well recently will continue to perform similarly in the near future. Interestingly, another explainer said that momentum investing is a strategy that capitalizes on the recent price performance of an asset. In this game plan, traders buy only when an asset has exhibited strong upward price momentum and sell when it has shown weak performance.
In all these definitions, it is clear that momentum trading heavily relies on price direction and trajectory. Traders who employ this strategy time their entries and exits around this factor, hoping that the movement persists.
So, what is momentum trading in crypto? It is the use of a crypto asset’s speed and strength to determine when to buy or sell. Interestingly, this strategy utilizes momentum indicators, chart patterns, and candlesticks to spot these points of entry and exit.
However, it is worth noting that it is mainly used as a short-term style that relies solely on the rise and fall of an asset, without considering other factors such as fundamentals. With the concept of buying low and selling high in crypto, investors seek cryptocurrencies that are within a demand zone, purchase the coin, and hold it until it reaches its peak.
Many liken this strategy to flying a kite. Those who fly one usually use the wind’s direction to their advantage, favoring either direction to help the kite stay up. Similarly, traders capitalize on the rise but take note of the fall of an asset while engaging in momentum trading.
Having gone through the definition of this style of trading, many may express shock, as this is what they’ve unknowingly practiced for a while. However, you may be in for another shocker!
Origin Of Momentum Trading
Momentum trading did not start today; it dates back centuries. One of the early practitioners dates back to before the 1800s. David Ricardo, a renowned and influential British economist, was the first documented individual who practiced this style of trading.
He was a stockbroker who began his career and dabbled in economic theory in 1799. However, he retired from his earlier role as a wealthy man and continued the remainder of his life as an economist.
Interestingly, Ricardo did not reveal the source of his wealth to the public until James Grant spoke about it in 1838, years after his death. Grant noted that the economist was a successful investor because he applied three pivot rules. The first is “never refuse an option when you get it.” The second is “cut short your losses,” and the third is “let your profit run on.”
These three rules would form the basis for early momentum trading. The more emphasis on cutting short losses and letting profits run reveals the low risk appetite of Ricardo and other investors who practiced this strategy. This is especially true as these trades mostly buy an asset around a demand zone.
It is said that several renowned Wall Street figures adopted this style, applying Ricardo’s rules. Based on the documented events, it is clear that momentum trading is one of the oldest investment strategies.
Charles Dow Practiced Momentum Trading
Another notable individual who practiced this style of investing is Charles H. Dow, founder of the Wall Street Journal, co-creator of Dow Jones & Company, and the one who laid the groundwork for the Dow Jones Industrial Average.
In line with Ricardo’s theory of letting your profit run, Dow postulated that an asset on the rise will continue in this path, while one on the decline is likely to continue falling. This led to the creation of the Dow Theory, which places great importance on identifying trends for successful investing.
Another individual who adopted momentum trading is Jesse Livermore. Early in the 20th century, he revealed that real wealth lay in understanding market primary movements rather than individual fluctuations.
Interestingly, more notable individuals joined the list of those who practiced the trading strategy between the 1920s and 1960s. These figures include Richard Wyckoff, George Chestnutt, Richard Donchian, Nicholas Darvas, and Jack Dreyfus.
They also contributed to momentum investing, using techniques such as relative strength analysis, moving averages, and BOX theory, as well as investing in stocks that hit new 52-week highs.
Regarded as the Father of Modern Momentum Investing
Although not the first momentum investor, Richard Driehaus is regarded as the father of modern momentum investing.
Born in 1942, he began his career as a research analyst at A.G. Becker in 1968, gaining a reputation for his unconventional approach to investing. Driehaus’ philosophy opposed the popular traditional style of investing popularized by Benjamin Graham and Warren Buffett.
He postulated that there is more money to be made by “buying high and selling higher” than by buying underpriced stocks and waiting for them to surge.
Interestingly, he fully practiced this theory when he established his own investment firm, Driehaus Capital Management. His approach suggests that investors can generate higher profits by identifying stocks with rising earnings growth, increasing volume, and rising prices.
How To Use Momentum Trading For Bitcoin (With Examples)
After reading about how momentum trading dates back centuries, it likely boosted your confidence in it. Additionally, the fact that renowned professionals attributed their wealth to this style beckons a deep dive into how to use it.
While many investors use it these days for short-term trading, others apply it for medium-term investment. Let’s examine some examples of implementing the momentum trading strategy for BTC.
Example 1
Bitcoin has experienced a series of declines, and many traders and investors believe the coin is either dead or will continue to decline further. In applying momentum investing, this would be the best time to buy. You might decide to consult the relative strength index before making a decision.
While looking at RSI, take note of whether the asset is oversold. If yes, this could be your entry point. The chart below provides a clearer picture of when to apply this strategy.
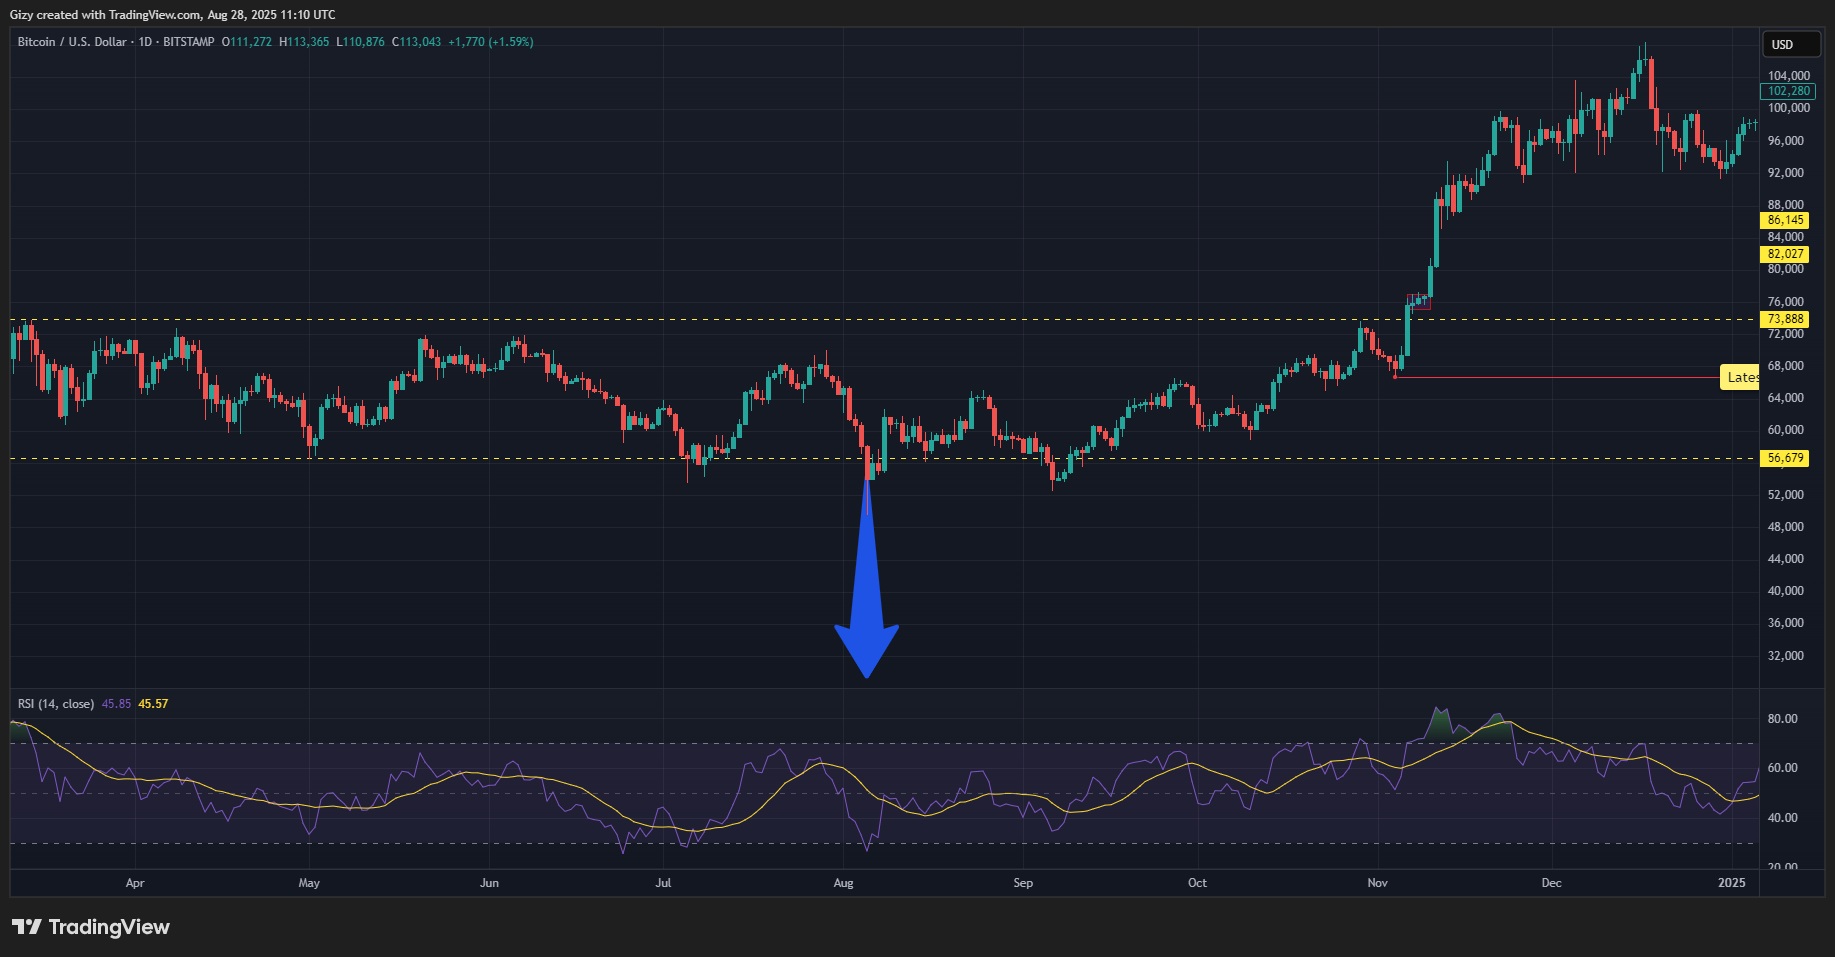
Bitcoin was oversold on Aug 5, 2024, when the RSI dropped below 30. Clearly, there was huge fear, uncertainty, and doubt as investors feared further declines. However, a savvy trader who bought the asset at this point would have profited 119% as BTC surged from $49k to $109k following this event.
Example 2
Bitcoin dropped by over 7% between Oct 30 and Nov 4, 2024. It’s worth noting that it has been in an uptrend for weeks. The drop sparked concerns that the coin had reached its peak and would experience significant downward momentum in the coming days. However, the candlestick pattern signalled further increases. This may be your point of entry.
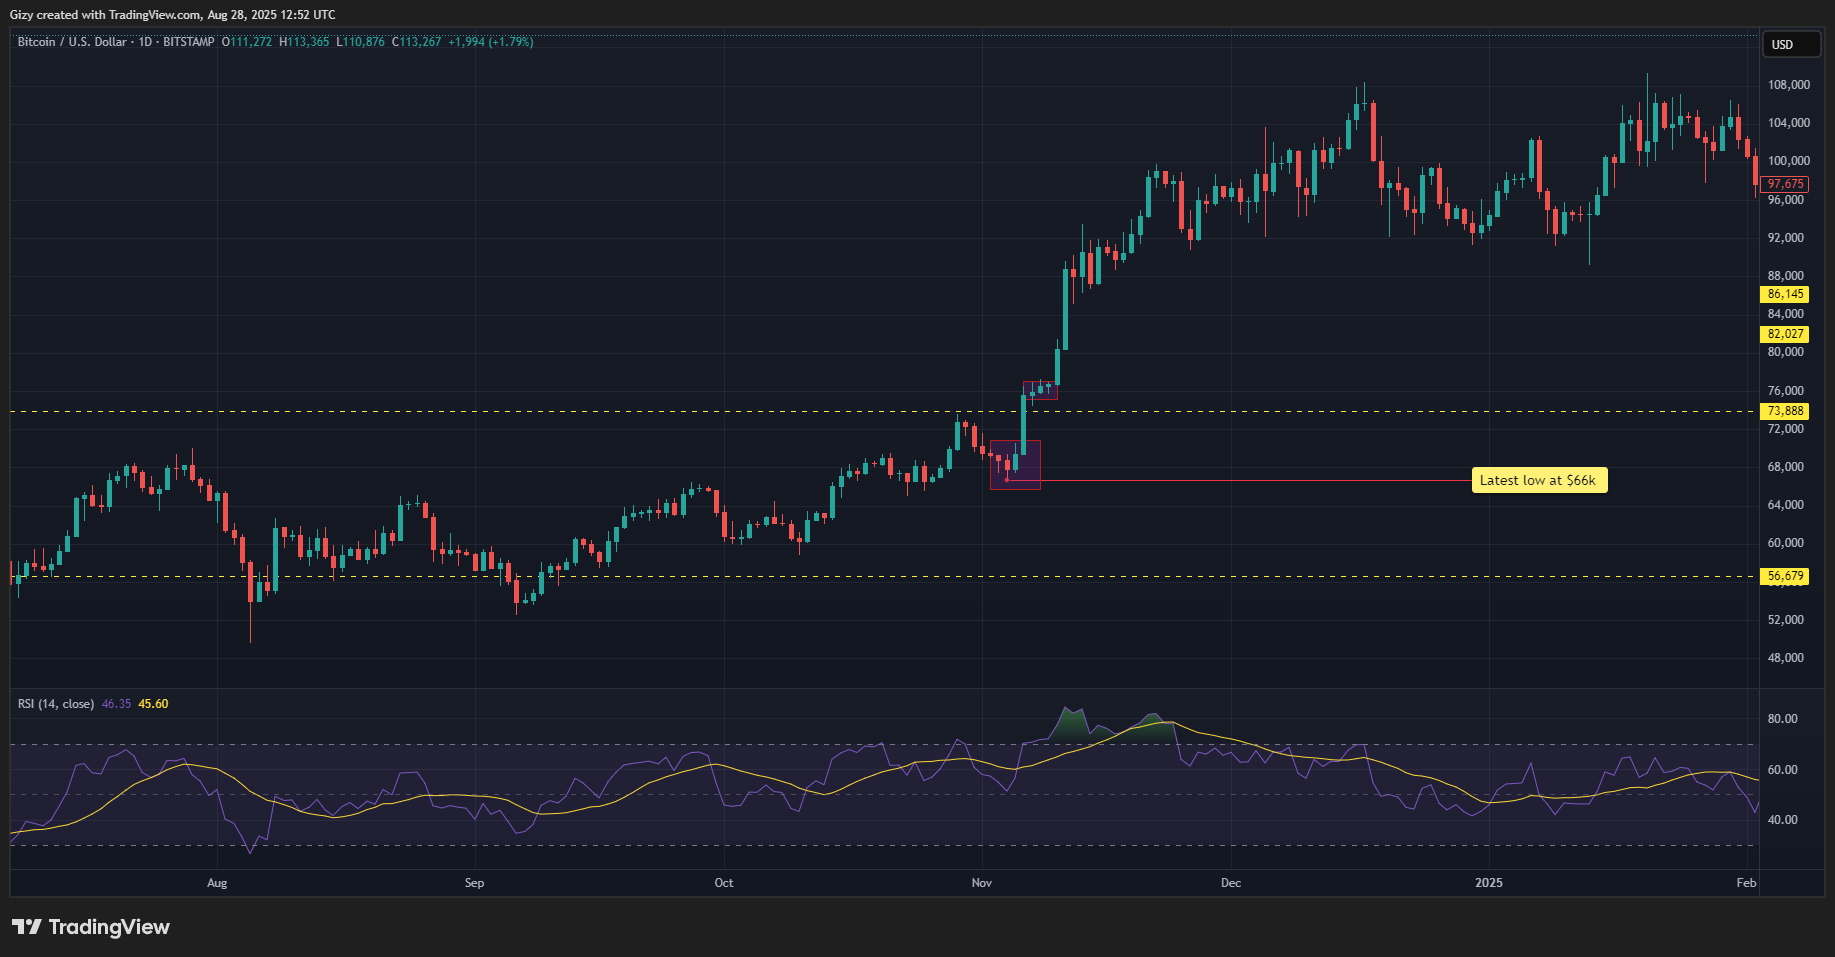
The apex coin surged by almost 80% after this period. A savvy trader who employed momentum investing would have reaped substantial gains.
Example 3
Bitcoin traded between two key marks from February to October 2024. A trader who applies momentum trading will take note of the price trend and place his trades accordingly. For example, BTC traded between $60,000 and $40,000 during this eight-month period.
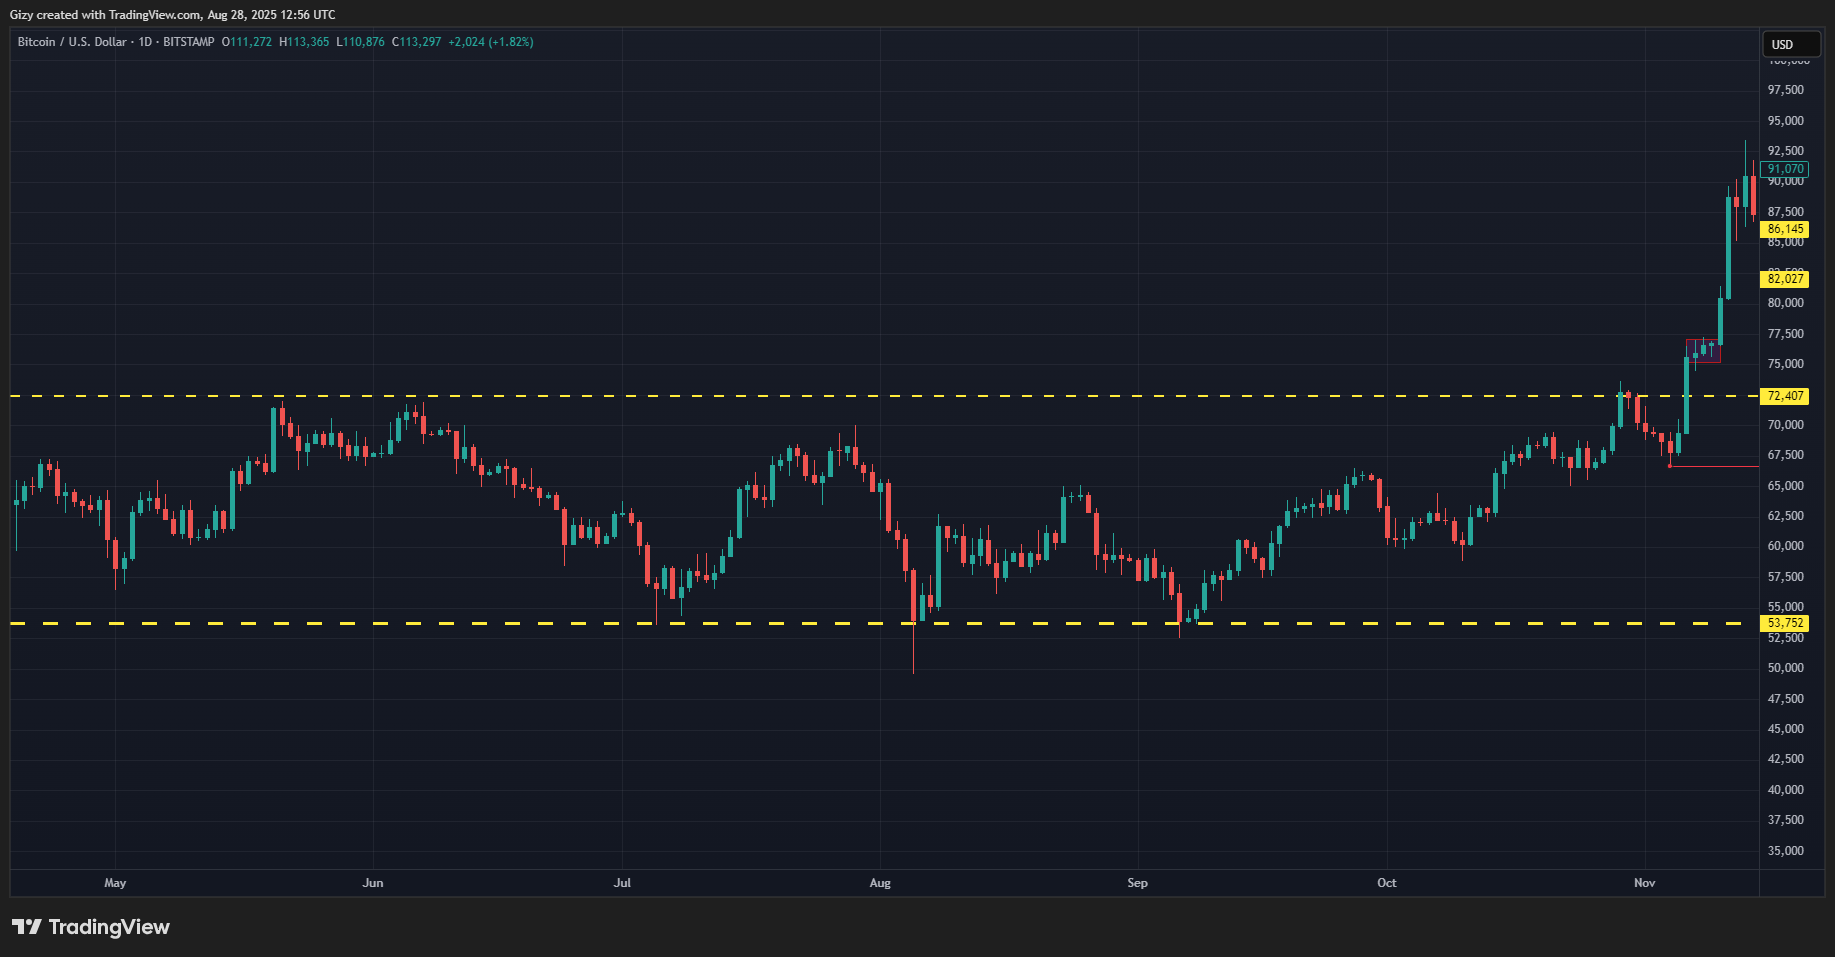
A spot trader may decide to enter or exit trades at the top or bottom, yielding several rounds of substantial gains.
Momentum Strategy: Spotting Entry and Exit Signals
The previous examples likely provided some insight into how to spot entry and exit levels. However, spotting these levels involves more. There are indicators, candlesticks, and chart patterns. We will review them and go over their application to identify entries and exits.
Candlestick Patterns
There are two candlestick patterns to watch when adopting momentum trading. The first is the engulfing pattern, which comes in two types: bullish and bearish. The second is the hammer candlestick, which also comes in bullish and bearish variations. Let’s start with the first.
The Engulfing Pattern
As previously stated, there are two types of engulfing patterns. In the case of a bullish engulfing pattern, a larger green candle that overshadows the previous red appears at the end of a downtrend. This signifies a gradual increase in upward momentum.
In spot trading, this bullish engulfing may serve as an entry level, and for perpetual trading, it would mark the entry or exit point.

(Image via Forexopher)
However, the bearish engulfing pattern happens at the end of an uptrend. Traditionally, the identifying feature is a larger red candle that overshadows the previous green. In spot trading, this bearish engulfing may serve as an exit level, and for perpetual trading, it would mark the entry or exit point.
The Hammer
The hammer pattern is split in two: the standard hammer and the inverted hammer. The normal hammer appears at the end of an uptrend, characterized by a candle with a long wick sticking out the bottom and a small body. It is worth noting that the wick formed as the coin retraced, but a small buyback occurred, pushing prices up.
Bearing in mind that this only happens at the end of an uptrend and signifies rising selling sentiment compared to the other green sessions, this will be the exit point for spot traders. On the other hand, for perpetual trading, it would mark the entry or exit point.
(Image via FOREX.com)
The inverted hammer appears at the end of an uptrend, characterized by a candle with a long wick sticking out the top and a small body. It is worth noting that the wick formed as the coin surged, but a minor selloff occurred, causing prices to drop.
For spot traders, this marks the entry point, while perpetual traders may decide to go long.
Indicators
There are several types of momentum indicators that you can apply to Bitcoin momentum trading. They include the relative strength, moving average convergence divergence (MACD), stochastic oscillator, and average directional index (ADX). However, we will look at the application of just one.
The Relative Strength Index
The relative strength index is one of the most relied upon in momentum trading. It has a neutral zone (spanning 30 to 70), an overbought zone (spanning 70 to 100), and an oversold zone (spanning 30 to 1). In Bitcoin momentum trading, the key zones to watch are the overbought and oversold areas.
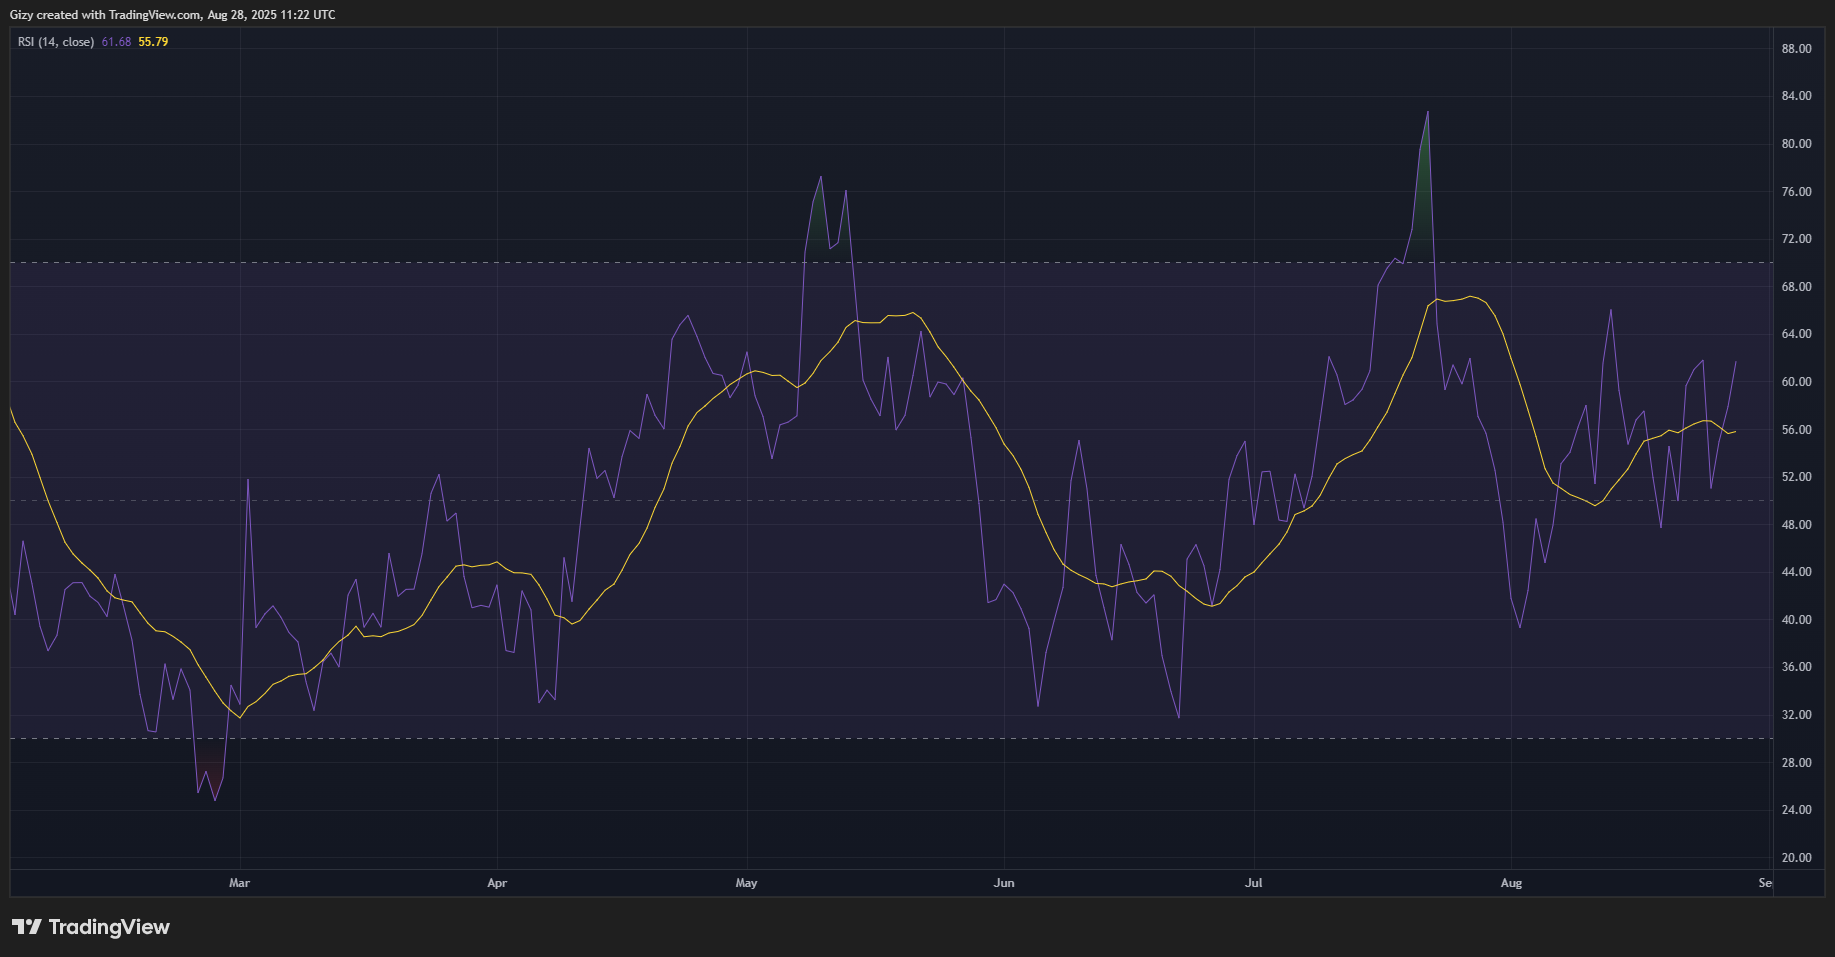
For spot trading, when the RSI drops below 30, this may indicate that selling pressure is at its maximum and will serve as the entry level. Meanwhile, perpetual traders may decide to go long at this level.
However, when the RSI surges above 70, this may indicate that buying pressure is at its maximum and will serve as the exit level for spot and perpetual traders may decide to go short at this level.
Chart Patterns
One of the most compatible chart patterns for Bitcoin momentum trading is the ascending and descending triangle. Both chart patterns typically signify continuation.
For an ascending triangle, it appears during an uptrend, marked by a horizontal resistance line and an upward-sloping support line connecting higher lows. It indicates that buying pressure is rising and signals a potential breakout.
It is worth noting that the pattern exhibits rises and falls that become shorter over time. For spot traders, the smallest part will be the entry price, while perpetual traders may decide to go long.
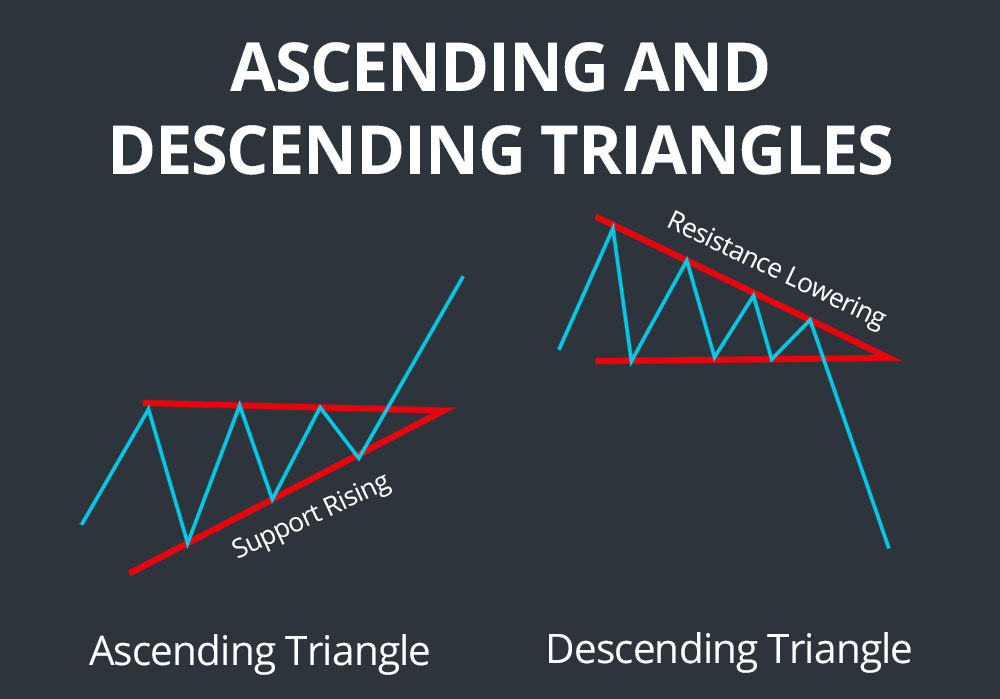
Conversely, a descending triangle signals the continuation of a downtrend. A horizontal support line and a downward-sloping resistance line connecting lower highs are the hallmarks of this pattern. Nonetheless, it indicates that selling pressure is rising and signals a potential breakout.
For spot traders who bought the coin when it started dipping, the smallest part will be the exit price, while perpetual traders may decide to go short.
However, many traders avoid using these chart patterns as the ascending triangle may result in a downtrend, and the descending triangle may sometimes result in an uptrend. Nonetheless, this strategy applies Ricardo’s third rule of letting your profit run on.
Should I Use Momentum Trading For Altcoins
The early practitioners of momentum trading did not utilize it for cryptocurrencies, as the asset did not exist. The first documented individual to use this strategy was a stockbroker, and others followed suit in the 1900s.
However, several sectors of trading employ this style, which means it is not limited to Bitcoin. All of the indications for spotting entries and exits apply to momentum trading for altcoins. Let’s go over some of their applications on Ethereum (ETH) and Solana (SOL).
Engulfing Pattern on Ethereum
A closer look at the Ethereum 1-day chart reveals a case where a bullish engulfing pattern occurred. The candle representing trading action on Jun 23 is a green one. Interestingly, its size eclipsed the red, and massive gains followed.
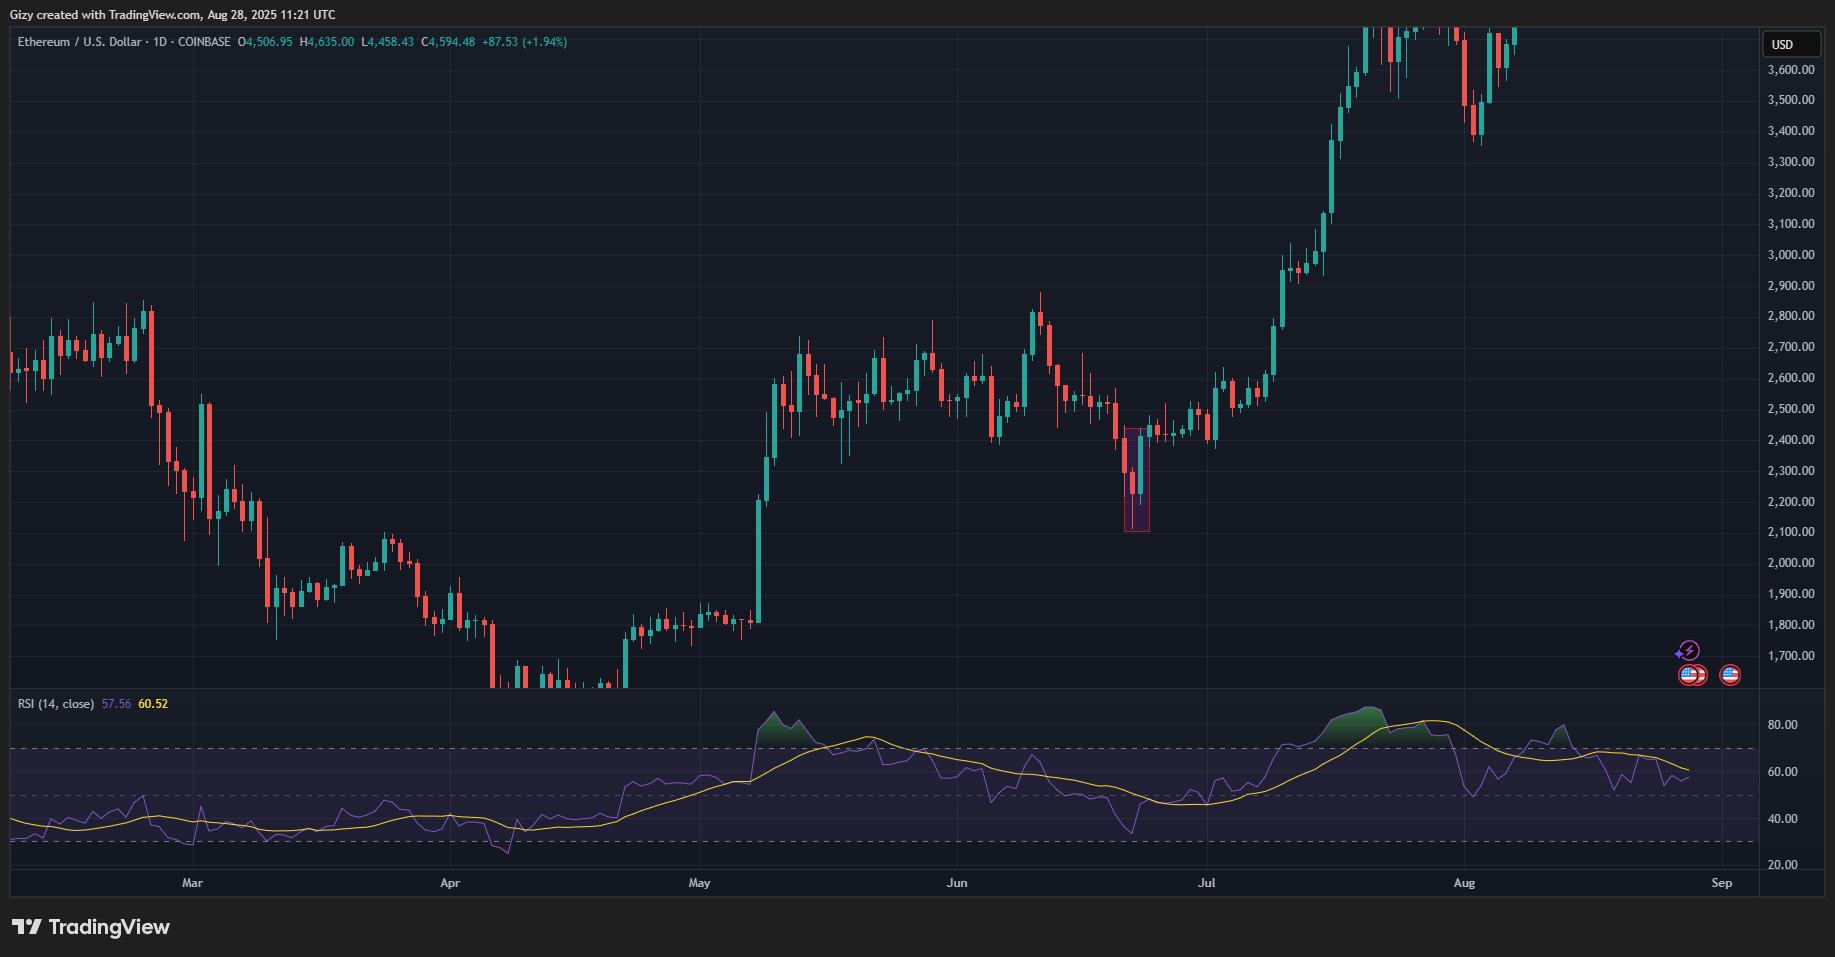
ETH surged after this candle, gaining over 80% in the aftermath. A spot trader would have reeled in such a gain, and a perpetual trader would have gained more from longing after spotting the bullish engulfing.
Relative Strength on Solana
The 1-day chart reveals that SOL was overbought between Jul 18 and 22. The coin plummeted afterward as the reading from RSI indicated peak upward momentum.
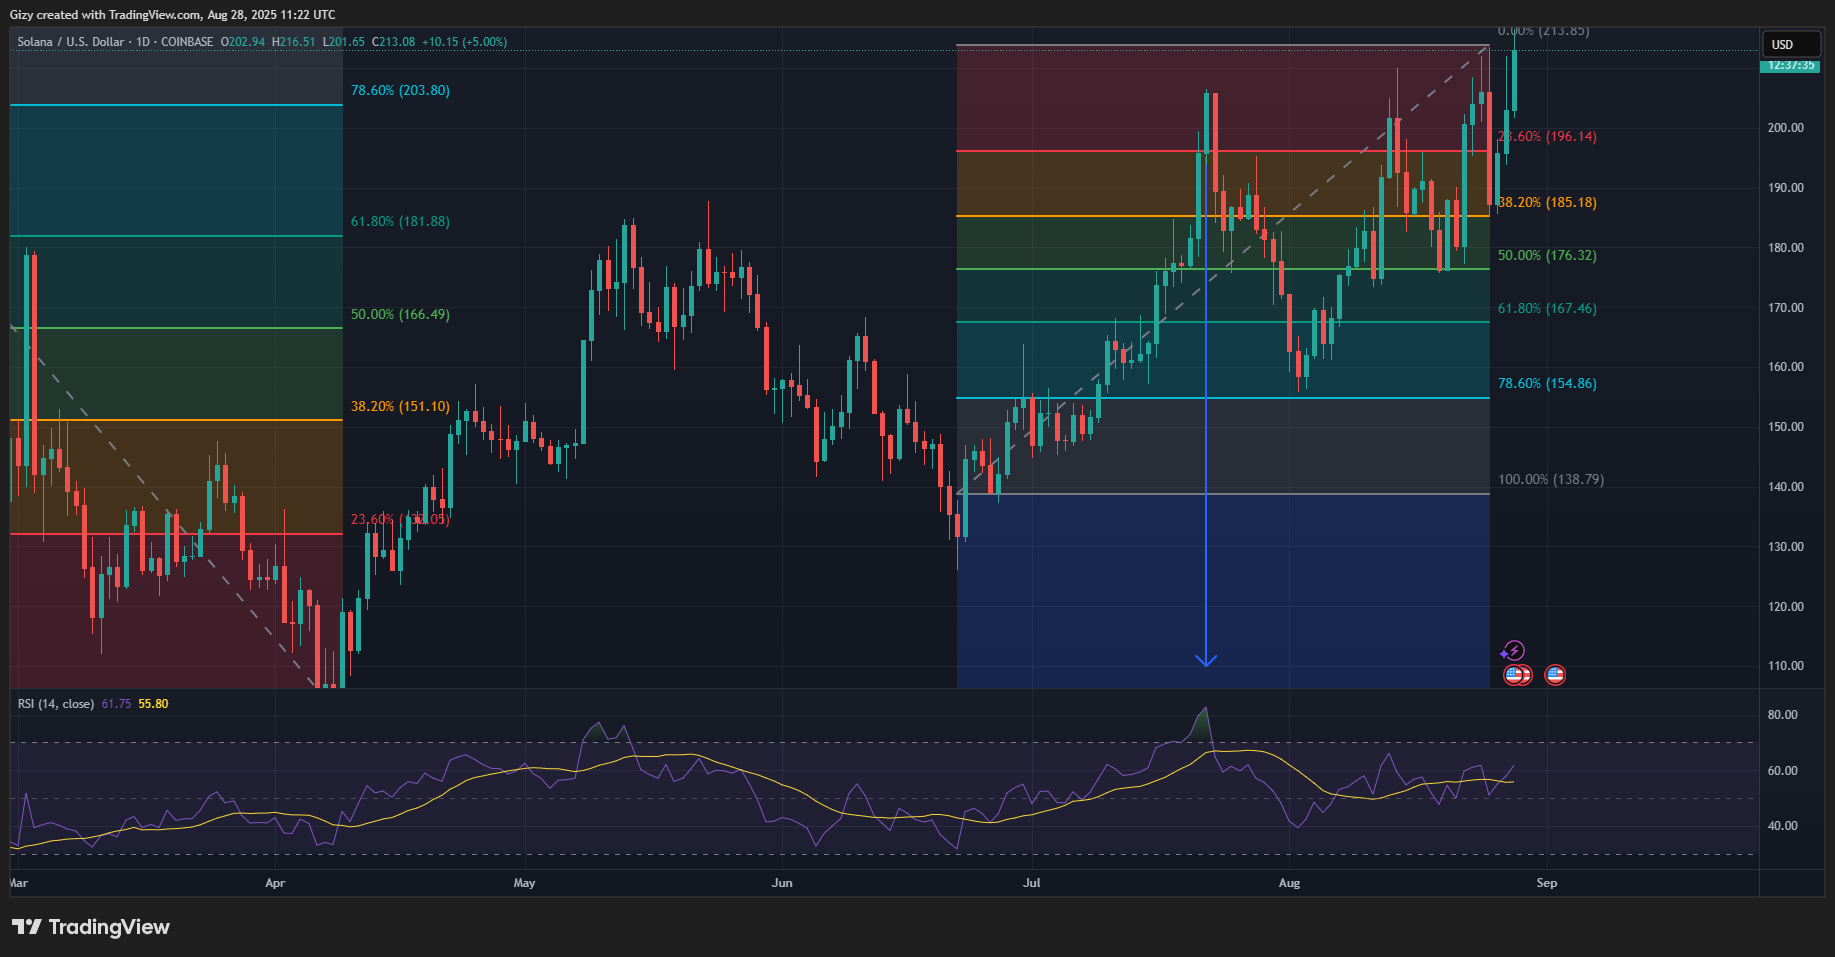
SOL retraced after the metric peaked at 82, losing over 23% in the aftermath. A spot trader would have used the relative strength to spot his exit, taking profit at the end. Nonetheless, a perpetual trader would have gained more from shorting.
Momentum Trading vs. Other Trading Strategies
In this section, we will examine some of the pros and cons of momentum trading over other strategies. The two strategies we will use are Contrarian and Growth trading.
Timeframe
Since momentum changes frequently, it is not advisable to engage in Bitcoin momentum trading for long-term purposes, such as 3 years or more. The profitability of such an endeavor with this strategy is minimal compared to when it is used for short-term purposes.
Conversely, trading strategies like contrarian investing, which entail going against crowd sentiment, are more flexible and can function in all time frames.
Risk
Momentum trading is considered one of the riskiest investment strategies. This is due to a number of false positives. While applying the engulfing candlesticks pattern, prices may continue their previous trend. Additionally, many traders avoid using chart patterns as the ascending triangle may result in a downtrend, and the descending triangle may sometimes result in an uptrend.
Nonetheless, strategies like growth trading require significant research that takes into account factors such as the identity of the buyers. Why are they buying an asset?. This plan aligns with crowd sentiment, and its risk level is low.
Trading Conditions
When it comes to trading to carry out Bitcoin momentum trading, there are several. It is one of the most flexible options, as it utilizes not just indicators, but also chart and candlestick patterns, which are almost always present.
However, contrarian investing, which entails going against crowd sentiment, is primarily applicable at market extremes. It buys when FUD is high and sells in FOMO, making it less flexible.
What to Remember About Momentum Trading in Cryptocurrencies
Momentum trading is a wonderful concept with easy application. Knowing the history bolsters confidence in it, and knowing that it does not rely solely on one factor to determine entries and exits makes it appealing to newbies.
The principles covered in the article also apply to momentum trading in cryptocurrencies, as illustrated in this guide and the numerous examples provided. The article also covered several applications and included images for easy understanding, concluding with a brief overview of the pros and cons.
Remember that, whether it is momentum trading BTC or altcoins, this strategy can yield substantial profits. However, it also entails risks. As such, this write-up should not be construed as financial advice.








 Jonathan Agozie | August 14, 2026
 Mishael Nwani | August 14, 2026


 Fortune Samuel | July 2, 2026
 Cynthia Ezirim | July 1, 2026
