
Ethereum is on track to close July with its most significant increase in the last 3 years. It had a perfect start to the 4th quarter amid predictions that Q3 is the least positive 3months of the year.
There were fears of how prices would trend in July as the coin barely moved in the previous month. It registered losses of almost 2% last month after gaining over 41% in May. Market watchers anticipated notable corrections following its failure to surge during the 6th month of the year.
However, fundamentals played a massive role in how prices played out over the last 30 days. One of the biggest announcements was the signing of what many termed the “Crypto Bill” in the US. Ethereum surged in the days leading up to the official signing, reclaiming previous highs. Nonetheless, institutions played a huge role in the increase of the apex altcoin registered.
The latest firm to make a significant leap towards Ethereum reserve is BTCS. The Blockchain infrastructure firm recently filed to raise $2 billion by selling its shares. The NASDAQ-listed company will use the funds to support its crypto purchase and other operational needs. Just a day before submitting the filing, the company disclosed that it bought 14,240 ETH. The latest purchase brought its total holdings to 70,028 ETH, which is worth $265 million.
Another firm that is making significant headway in Ethereum accumulation is BitMine. The company unveiled a $1 billion stock buyback plan aimed at enhancing its crypto-asset-per-share ratio. Before this announcement, it had aggressively acquired Ethereum, dumping its BTC holding for 625,000 ETH at an average price of $3,755 per unit. This brings its total holdings to $2.36 billion.
Spot Ethereum Hits Record High
Spot Ethereum ETFs recorded an inflow during the week ending July 11, registering its second-highest weekly total since inception. Interestingly, SoSo Value reports that 42% of the total inflow was recorded on July 10.
A few weeks later, the US Spot Ethereum Exchange traded funds registered its highest weekly inflow of $1.85 billion. According to data from SoSoValue, BlackRock’s ETHA saw a new inflow of $440 million.
This increase in ETF inflows positively affected prices. As a result, Ethereum was mostly bullish throughout July.
A look at the 1-week chart shows that the altcoin surged above 3k for the first time in more than 4 months. It ended the session with gains exceeding 15%.
The altcoin continued its uptrend the following week after a slight decline. It broke above $3,500 for the first time since January. It peaked at $3,856 during this period and closed with a gain of more than 26% amid a slight decline.
Trading actions during the previous week showed that the asset slowed its uptrend. It is also worth noting that it registered notable declines, dropping to a low of $3,507. Nonetheless, it rebounded and ended the session gaining over 3%.
The 1-week chart suggests that the asset is seeing a drop in buying pressure at the time of writing. A close at the current price will see it register its first red candle after five weeks of consistent increases.
Nonetheless, Ethereum is edging closer to ending the month with gains exceeding 53%.
A Slightly More Bullish Month
The image below suggests that the asset is heading into a slightly more bullish month. It gains over 5% on average every July. A previous prediction indicated an impending decline after it attained a certain level. However, the coin registered massive increases over the last thirty days.
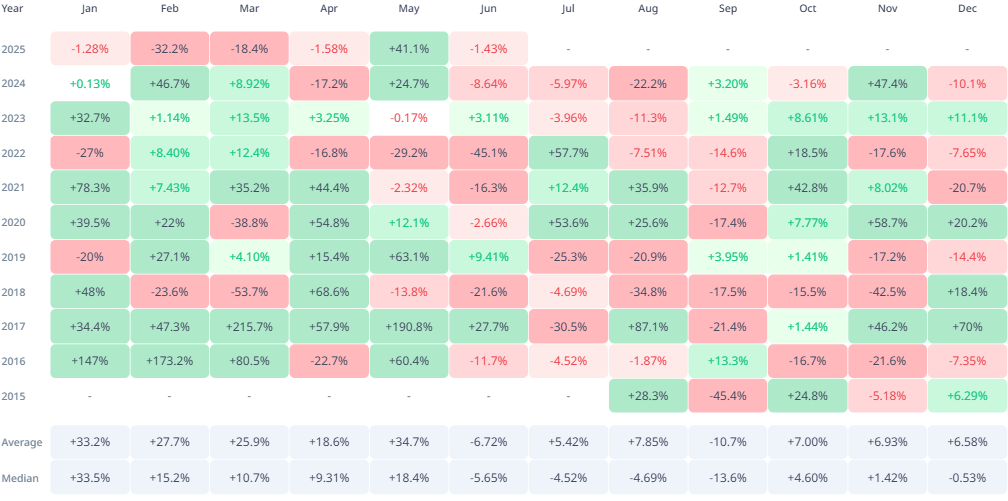
August is considered a more bullish period for Ethereum as it records higher gains during this period. It saw an average increase exceeding 7% during this period, which is higher than the 5% in the seventh month.
Nonetheless, since its inception in 2015, ETH has registered losses six times, with the highest decline happening in 2018. The asset lost 34% after a similar result the previous year.
Conversely, the altcoin has seen notable gains four times. It registered its biggest gains in 2017 when it surged by over 87%. A closer look at the previous data reveals that while the asset registered more months of losses, it remains positive on average.
There is no specific pattern to the outcome. Nonetheless, a closer look at how prices played out in the last two reveals that the trading worsened in August. If this trend holds, ETH will see notable declines in the next thirty days.
Ethereum Flips Bearish
The 1-week chart paints a grim picture of how prices will play out in the coming days. It is worth noting that the image below indicates a drop in buying pressure as the bulls show signs of exhaustion.
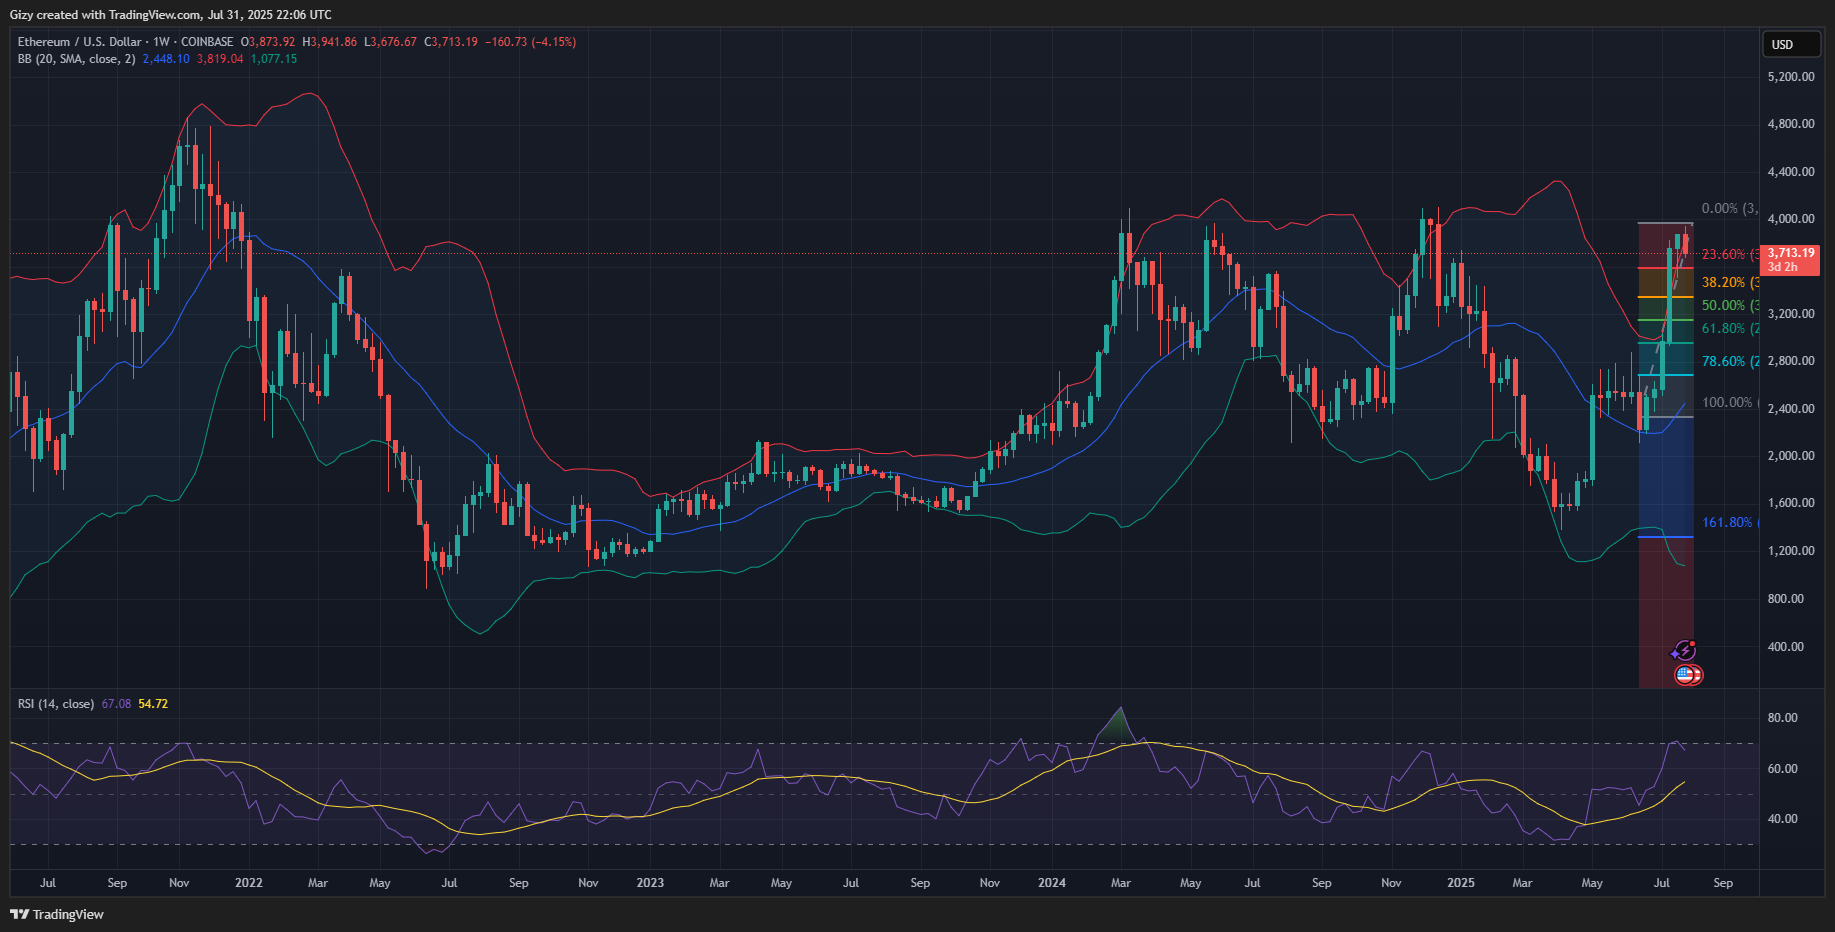
The coin slowed its uptrend and consolidated for most of the last two weeks. Its current trend may indicate an impending trend reversal that will result in massive price declines.
Indicators on the 1-week chart support this prediction. The bollinger band shows that the asset broke above it two weeks ago. It currently trades above the upper band but may drop below it if trading conditions worsen.
Nonetheless, previous price movements suggest that Ethereum will drop following its breakout from the BB. It will retrace as low as the middle band. However, the metric is currently below $2,500. Recent accumulation data suggests that the altcoin may not drop to that mark in August.
The relative strength index reveals that the asset was overbought two weeks ago. It is currently at 68, indicating that selling pressure is gradually increasing. A continuation of this trend will seal the next thirty days as a bearish period.
With both indicators pointing to an impending decline, the Fibonacci retracement level points to several key levels to watch. There is notable demand concentration around the 23% mark at $3,500. However, ETH will lose this mark.
Ethereum may drop as low as the 38% fib level around $3,300. It remains to be seen how prices will react after testing the mark.
Conversely, the calls for a surge above $4,000 are high. There is a high likelihood the asset will attain this mark.


