
Ethereum is edging closer to registering its first red month after two months of consecutive increases. The 1-day chart reveals that it is grappling with significant selling pressure on Tuesday.
It dropped to the previous day’s low but currently trades slightly higher at the time of writing. Nonetheless, the asset is clawing back some of the losses it incurred last week. The re-ignition of the uptrend on Sunday spurred further gains and a green close to the previous session.
Ethereum opened in September at $4,391 but is edging closer to its end with slight losses, currently trading at $4,173. Its bearish close is unsurprising, as a previous outlook pointed out that the coin would experience significant declines in the ninth month.
It cited a previous record of how the altcoin traded during this period and the losses it accumulated. The write-up also highlighted reading from several indicators to back its claims. While the altcoin did not drop to the level it predicted, it retraced to $3,800 last week but rebounded.
However, onchain data suggests that the asset experienced a drop in trading action over the last 30 days. It registered lower capital inflow m compared to the previous month. One such evidence is the decline in the number of institutions adding more coins to their portfolio. There were very few over the last thirty days, with some large investors posting significant losses after the recent decline.
Nonetheless, while spit volume remained weak, the previous driving force for the uptrends, exchange-traded funds, registered lower volume in September. For example, in August, the total net assets were $28.5 billion. The figure dropped by a billion in the ninth month. Aside from the volume, selling pressure increased during this period, with ETFs posting a net flow of only $158 million.
Ethereum Gears for the Most Profitable Month
Historically, October has been the most bullish month of the fourth quarter. Ethereum gained over 7% on average and registered its largest surge in 2021, when it increased by over 42%. However, it is not always all rosy for the coin as it posted its biggest loss of 16% in 2016.
Aside from the historic evidence, investors are becoming increasingly positive about what Q4 and the tenth month hold.
Regarding how prices may unfold in October, the 1-week chart suggests a high likelihood of further declines. It is worth noting that the altcoin broke above the bollinger bands a few weeks ago. It has since been in decline and saw its biggest loss last week, when it retraced from $4,447 to $3,385. The session ended with losses of almost 7%.
Previous price movement suggests an impending drop to the middle band at $3,500. This may be ETH’s next price target if the downtrend continues. Additionally, the moving average convergence divergence prints sell signals, with the 12 EMA edging closer to intercepting the 26 EMA.
A closer look at the charts suggests notable demand concentration around $4k. Although Ethereum broke the mark last week, the bulls may continue to defend this key level. The Fibonacci retracement level suggests a potential decline to the 38% mark at $3,600 if the highlighted barrier is breached.
US Government Shutdown on the Horizon
The US government is edging closer to a shutdown if it fails to reach a consensus by the end of September. Investors anticipate significant selling pressure in reaction to a shutdown. Nonetheless, a previous analysis extensively discusses how it may affect the crypto market.
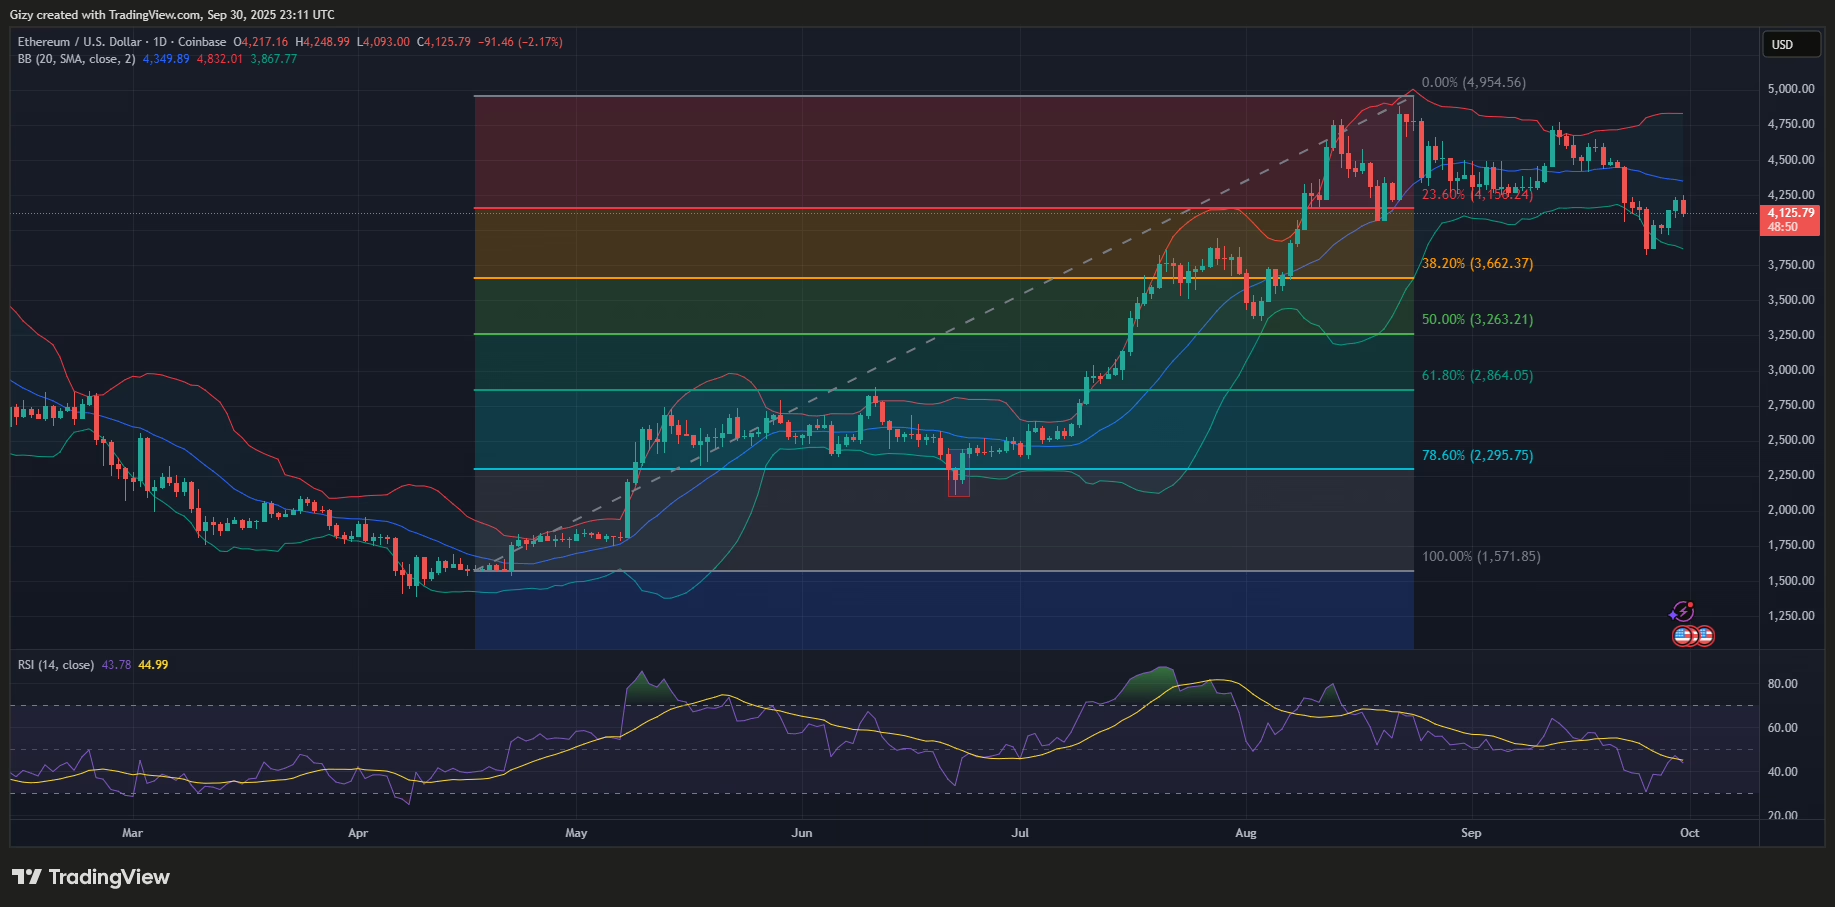
However, the 1-day chart remains positive amid growing uncertainty. Several indicators are currently positive and printing buy signals. One such is the bollinger bands. The chart reveals that ETH slipped below the lower bands a few days ago but has since recovered.
The altcoin was edging closer to the middle band but experienced notable selling pressure. Nonetheless, the buyback may resume. Sending the coin closer to the upper hand at $4,800. It may face notable pressure in the middle band before such increases.
Away from the bands, the 12 and 26 EMAs are edging closer to completing a crossover. MACD may signal further price increases if this happens.
Both indicators hint at further increases in the coming days. Nonetheless, the Fibonacci retracement levels reveal that the altcoin is struggling to stay above the 23% mark. It broke the mark on Monday but slipped below it a few hours ago.
Previous price movements suggest that the altcoin may linger above this mark for an extended period before a breakout. It has been a key accumulation point, with rangebound movement proceeding between $4,200 and $4,400.
Ethereum May Sink in Q4
While many proponents are optimistic about how prices will play out in the fourth quarter, there are indications that it may not all be up only. The 1-month chart shows that the altcoin is experiencing a notable decline after breaking above the bollinger bands.
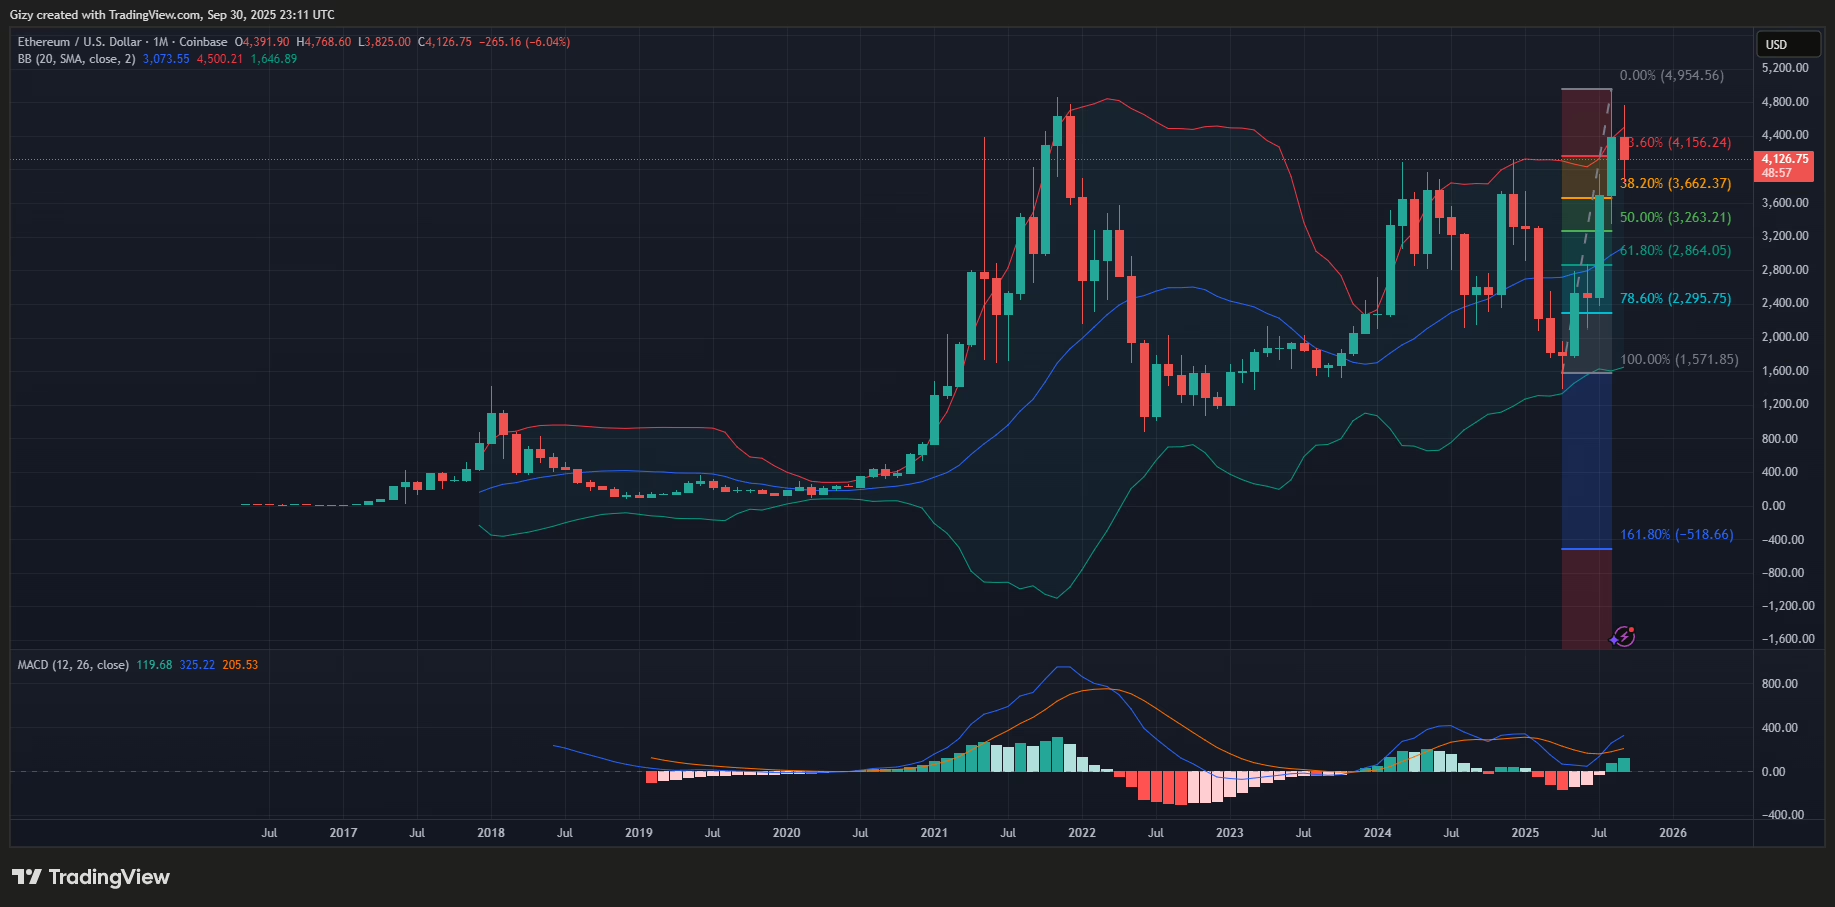
Ethereum broke above the indicators twice in the last two months. However, previous price movements suggest that the altcoin registers significant declines after such breakouts. A closer look at the chart reveals that the asset broke the upper bands in December 2024, and a massive downtrend followed, lasting five months.
Nonetheless, an earlier breakout resulted in a three-month decline. In both cases, the downtrend lasted for more than two months. September may be the first, and further declines may follow in October and November.
Conversely, previous price movements do not entirely rule out further increases. Ethereum registers significant increases in Q4, posting average gains of 25%. Additionally, MACD supports the assertion of further increases.
In the event of further increases, ETH may break above $5k and edge closer to $6k. In a worst-case scenario, it may retrace below $3,500.


