
Ethereum is seeing notable increases at the time of writing. It is trading at $4,487, after opening at $4,374, indicating a nearly 3% increase.
The asset continues to rise after incurring a loss on Friday. Data from CoinMarketcap shows that it is gaining attention again as trading volume increases. Nonetheless, its latest candle signifies that volatility is gradually returning to the coin.
August had several highlights as the altcoin edged closer to sending the month with massive gains. One of the biggest is the spike in ETF demand. A report stated that Ethereum exchange-traded funds (ETFs) attracted $461 million in inflows on August 9, with BlackRock accounting for the accumulation through purchases worth $250 million, followed by Fidelity with $130 million.
Data from SoSoValue shows that the ETH spot ETFs outperformed Bitcoin’s. On a monthly scale, the investment fund will conclude its eighth month of the year with its second-largest inflow since inception. For context, it closed July with the highest demand in ETFs, with netflow being positive at $5.43 billion in July. However, August will end with an influx of $3.87 billion.
A further breakdown of this metric reveals that the funds experienced massive buying in the week ending 15, with inflows exceeding $2.85 billion.
Aside from ETFs, one of the primary drivers of Ethereum’s surge was spot demand. It saw massive accumulation a few weeks ago as some whales switched strategy, dumping their BTC for ETH. Nonetheless, data from CryptoQuant shows that exchange reserves have declined repeatedly.
Ethereum Registers a New All-Time High
Ethereum surged to a high of $4,955 for the first time since its inception. The hike on Aug 24 and corrections followed after. While the news thrilled many, it was a sell signal for others, causing the asset to retrace to its opening price.
Nonetheless, trading actions before the milestone were one of the highlights of the month. On August 22, the altcoin printed its longest candles as it surged from $4,224 to a high of $4,886. Although slight corrections followed, the asset closed with gains exceeding 14%.
The trigger for that surge was fundamentals. It is worth noting that the asset experienced notable declines before the hike. Several negative macro data points from the US flooded the market with fears of massive inflation. Investors were anticipating an interest rate cut in September. However, that information suggested a slimmer chance of it happening.
Noteworthy are the events that occurred on August 18 and 19. ETH lost over 9%, dropping from $4,475 to $4,227 following the release.
However, against all odds, the Federal Reserve chairperson announced that some factors would cause the cut to happen. Investors now have more to look forward to in the ninth month.
Nonetheless, it is worth noting that the uptrend was short-lived. Coinglass shows several wipeouts following the sudden change in trajectory. One of the biggest liquidations happened on August 25 when traders lost a staggering $900 million, with the bulls accounting for $818 million, and the largest liquidations happened on ETH.
However, the market, at the time of writing, has open interest slightly higher than the previous day, raising a question about how September will play out with interest rates in view.
Interest Rate Cut May Barely Make a Dent
An interest rate cut is almost certain within the next thirty days. It remains one of the most anticipated events of the next month.
However, previous records indicate that the altcoin is heading into its most bearish month. The Ethereum monthly return chart indicates a slim chance of a green close in the ninth month of the year. On average, the coin loses 10% and the median figure is -13%.
September has historically been the weakest month for Ethereum, typically resulting in higher losses compared to other months.
Since its launch in 2015, Ethereum has closed the ninth month with significant losses in six out of the last ten years, with its steepest drop in 2015 when it plunged 45%. On the other hand, it has posted gains four times, with the most impressive one in 2016, when it surged by more than 13%.
ETH has seen more losing months than ones with gains, justifying its average result. There isn’t a consistent pattern; however, recent history shows that trading conditions have been consistently bullish over the last two years. If that trend continues, Ethereum could experience another notable increase in the coming 30 days.
However, current price actions are leaning towards more price declines amid the notable gains in August.
Ethereum to Retrace Below $4k
Ethereum is seeing a recovery from a significant drop. The 1-week chart shows that the altcoin has declined by almost 6% after rebounding from $4,250.
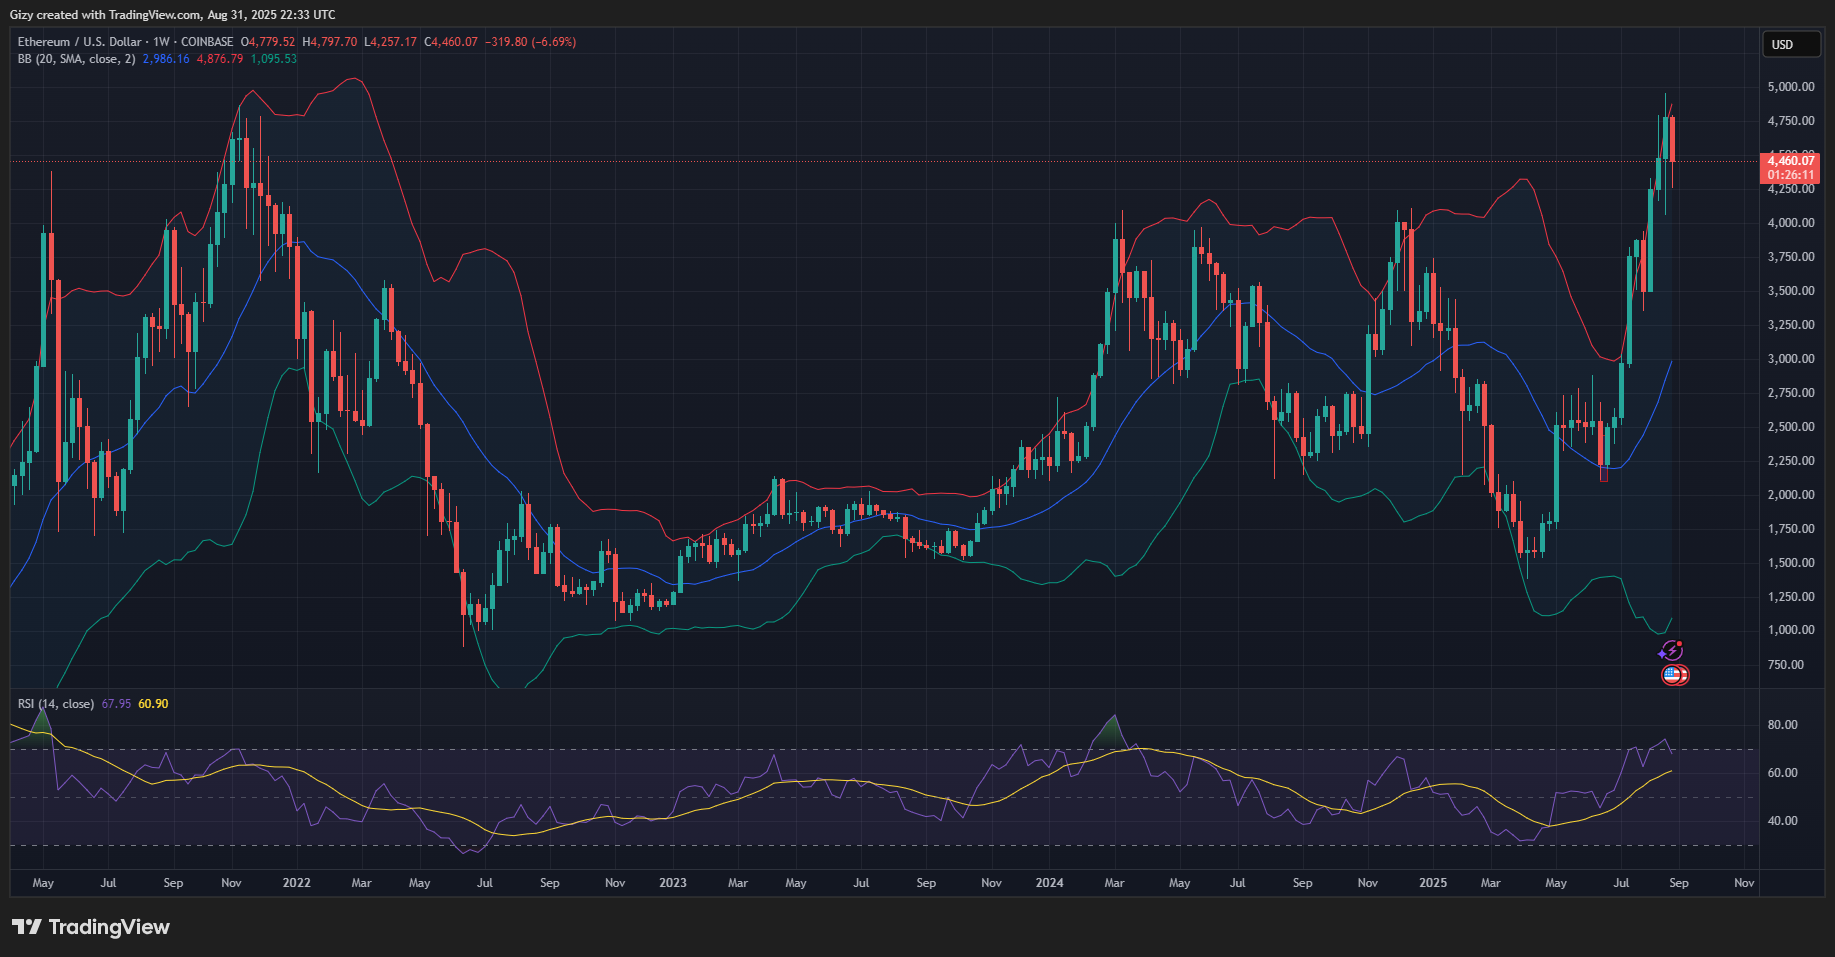
However, the chart also indicates that a bearish event happened during the week. The Bollinger bands show that the asset tested the upper band but retraced afterwards. It is worth noting that the coin has traded close to the band for eight weeks. Based on the rule governing the metric, the value was due for correction.
Aside from the Bollinger bands, the relative strength index was at 74 last week but retraced as selling pressure increased. It is currently at 67, indicating a neutral stance. Nonetheless, the metric is expected to decline further, with 50 as the target. Prices will follow, suggesting that the coin will see massive retracements in the coming days.
Based on recent price movements, ETH retraces an average of 40% after testing the BBs upper band. For context, the asset retraced after breaking above the mark, dropping 42% before rebounding. Another occurrence that happened following the breakout in the week starting December 16, the altcoin retraced by over 60% before rebounding.
A 40% at the current price will cause the asset to drop below $2,900. This trend is expected to continue into September, with Ethereum likely to drop by 10%.


