
Cardano opened on Friday at $0.76 but is currently trading at $0.79, following its recent surge in buying pressure. It is up by over 3% over the last 21 hours.
However, the coin is grappling with slight selling pressure after it peaked a bit higher. Nonetheless, it erased more than half of the losses it incurred during the previous intraday session.
ADA had one of its biggest retracements on Thursday, dropping from $0.81 to a low of $0.75. It lost over 6% during the session and recorded one of its lowest prices in almost 2 months.
Nonetheless, the latest pullback is barely scratching the surface, considering that the asset has been on the decline for most of the last seven days. It is trading at more than 16% below its high during this period.
4-Hour Chart Hints at Further Upside
The 4-hour chart suggests that the recent uptrend may continue, and ADA will likely reclaim its lost levels. Supporting this claim is the moving average convergence divergence (MACD), which indicates that the 12 EMA has recently crossed above the 26 EMA, completing the bullish crossover.
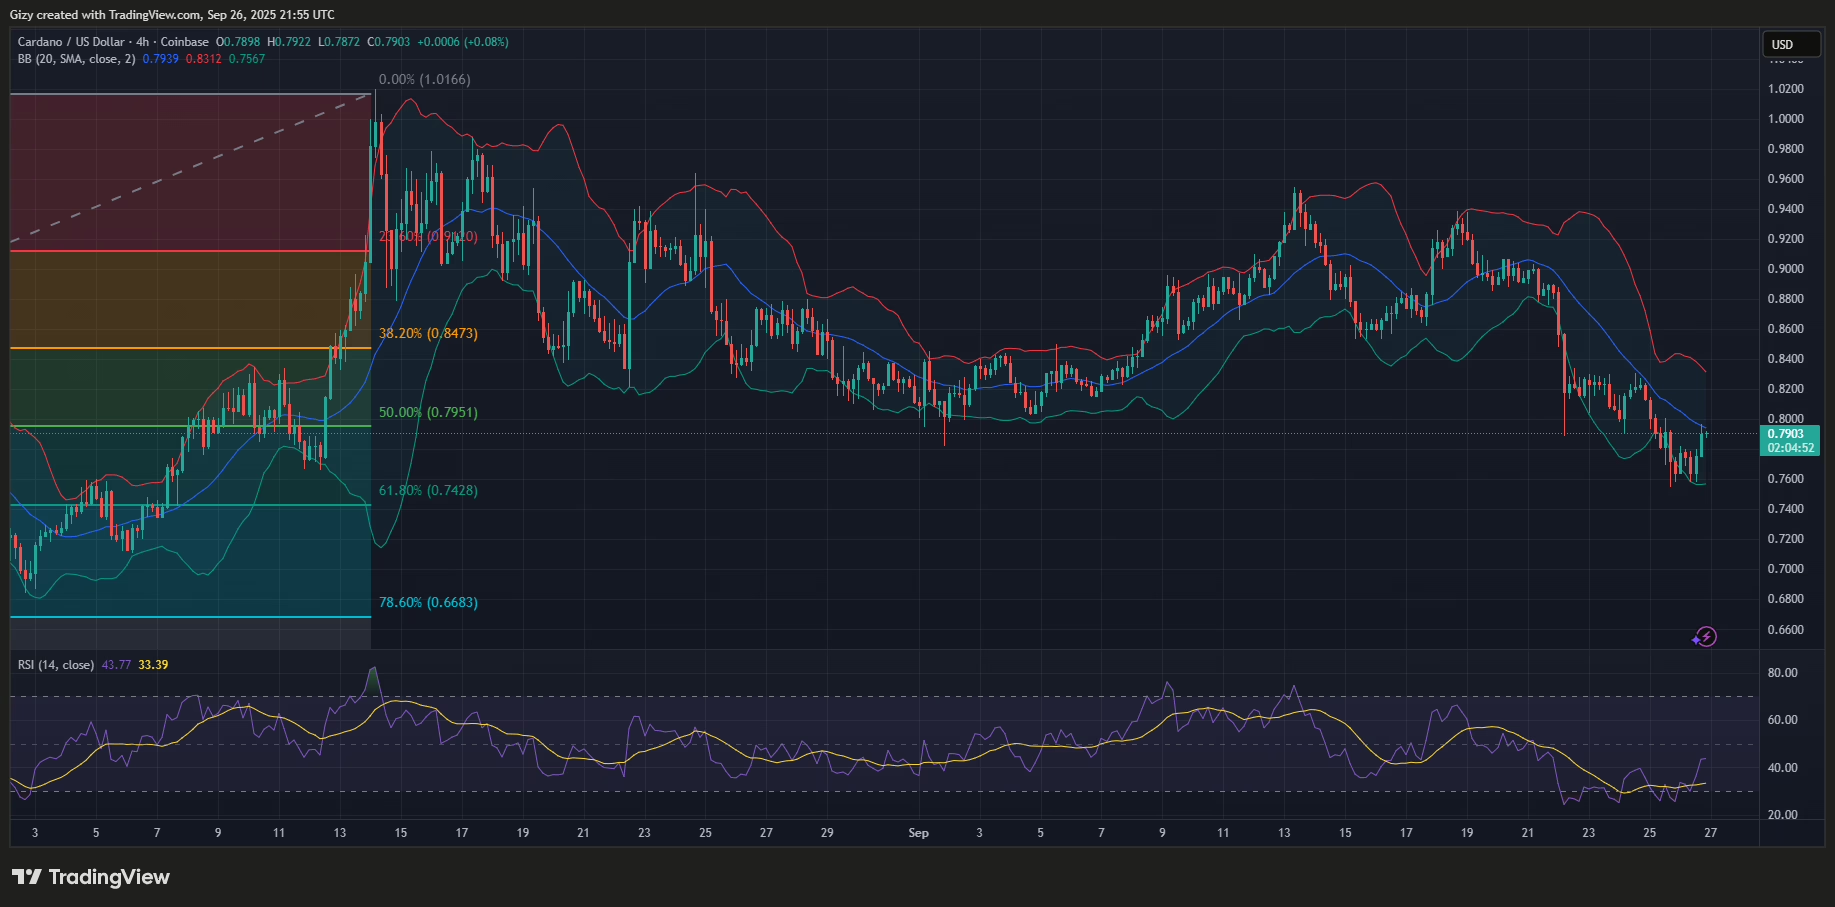
Nonetheless, the coin slipped below the bollinger bands on Thursday but is trading within them. The coin also tested the middle band a few hours ago and experienced notable rejections, explaining the reason for the latest decline. The bulls will look to resume accumulation and break above the barrier.
The relative strength index indicates a notable increase in buying pressure over the past 24 hours. It dropped below 30 on Thursday but recovered and now trends at 43.
Finally, Cardano was rangebound between $0.77 and $0.75 for over 20 hours before its recent breakout. While previous price movements indicate no significant rebound at this level over the last two months, the chart reveals a similar trend occurred earlier in August.
The coin surged higher after the rebound last. A review of these three indicators suggests a high likelihood that the uptrend will continue.
Cardano Eyes $0.85
The 1-day chart shows Cardano grappling with small selling pressure at $0.79 after failing to break above $0.80. Nonetheless, there has been no significant pullback following this rejection as the bulls are defending prices.
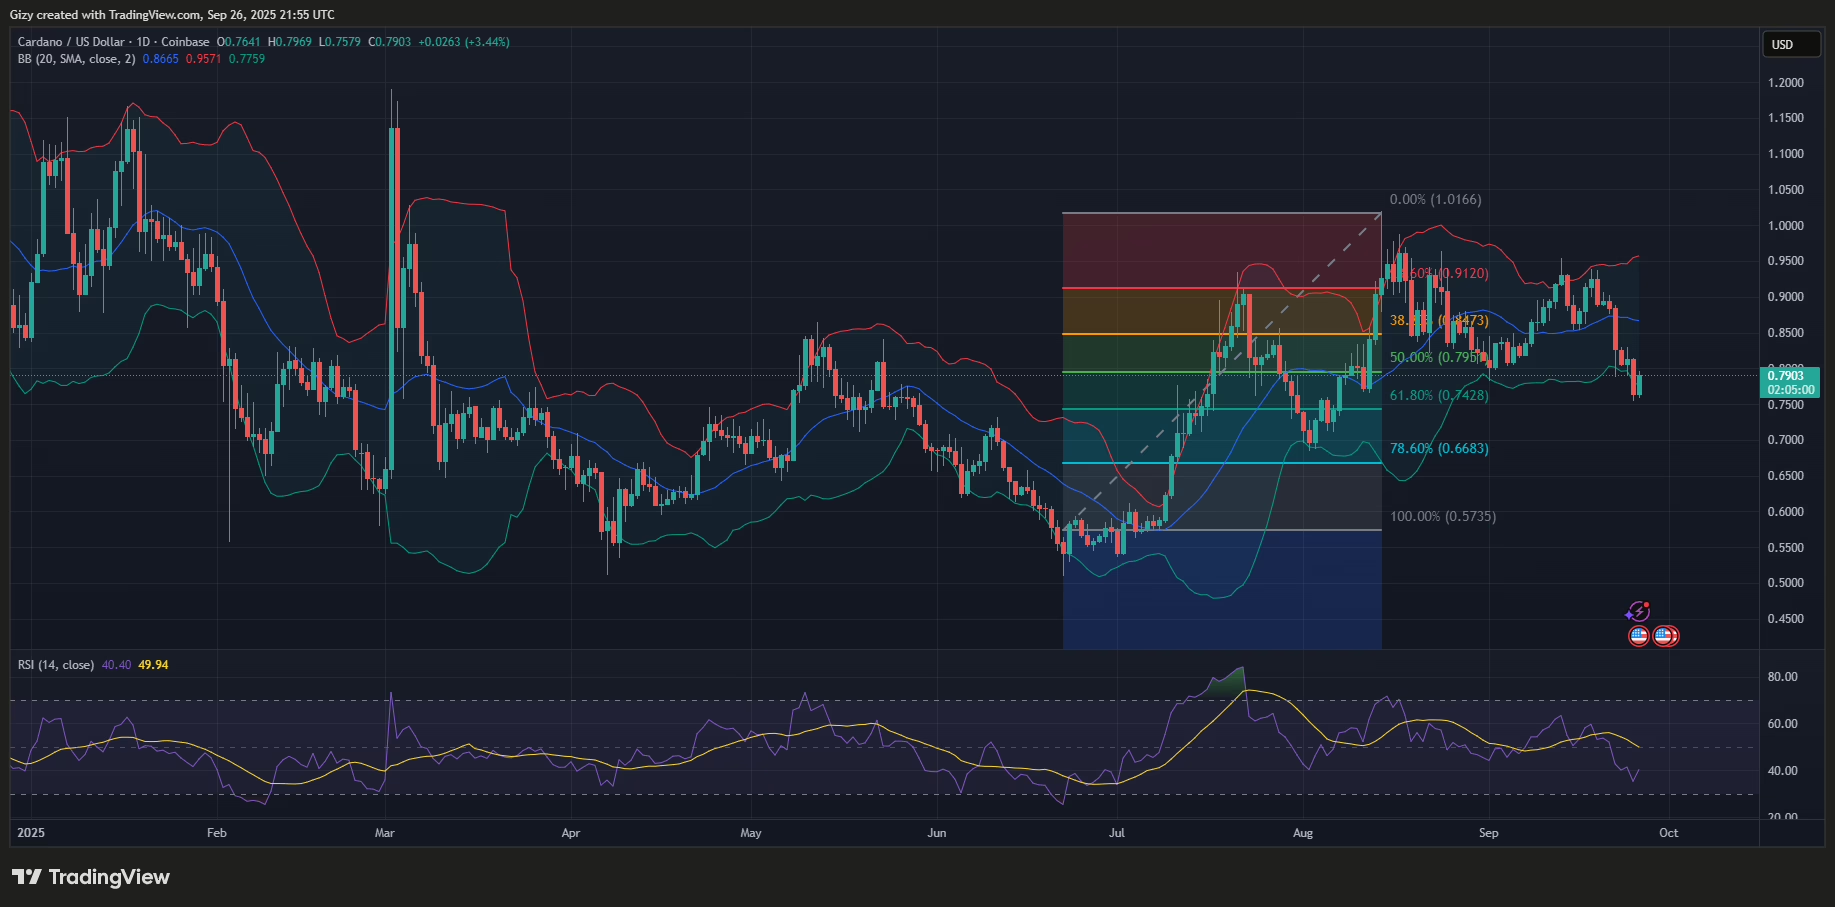
RSI is improving after days of notable declines. It dropped from 53 to 35 over the last seven days, but is trending slightly higher at the time of writing as buying pressure increases. Additionally, the coin slipped below the bollinger bands on Thursday but is trading within them. In most cases, a slip to the lower band indicates an impending reversal, and the ensuing increase follows this rule.
With both indicators hinting at further upside, Cardano will surge higher. The fibonacci retracement levels indicate that the asset is trading close to the 50% mark. Flipping this critical boundary may result in an impending retest of the 38% fib level, hinting at a possible return to $0.85.
However, the bulls must continue to defend prices at their current value or risk a significant decline. In the event of this happening, the coin may retest its previous low. There is a high chance it will absorb the impending selling pressure as previously. The chart reveals that the support has held out for almost two months.


