DOGE is on the verge of registering its second day of consecutive slight increases. Data from CoinMarketCap indicates that the bulls are becoming exhausted after several weeks of consistent accumulation.
The altcoin experienced a decline of more than 28% in trading volume. Calls of an altseason are slowly drowning out as DOGE and other altcoins in the top 10 are experiencing notable declines at the time of writing.
The global cryptocurrency market is seeing the same trend as BTC plunges deeper. The crypto market cap, excluding Bitcoin, is dropping as altcoins join the selloffs.
Fundamentals are not positive, as news of an old wallet dump affects more cryptocurrencies. Instability in Southeast Asia is slowly gaining traction as most predict an impending war between Cambodia and Thailand.
Reports of war have had a significant impact on the crypto market. The latest news, coupled with exhaustion from the bulls, is responsible for the downtrends across the market.
Nonetheless, some altcoins are registering notable increases amid the bearish sentiment across the market.
ENA started Thursday at $0.42 and surged after a brief decline. It peaked at $0.58 but ended the day lower. The asset is up by over 15%, making it the top gainer in the last 24 hours.
The latest market trend raises questions about key levels to watch. Let’s see them.
BTC/USD
Bitcoin dropped to its lowest in the last fourteen days on Friday. It opened trading at $118,400 and fell, hitting a low of $114,518 before rebounding.
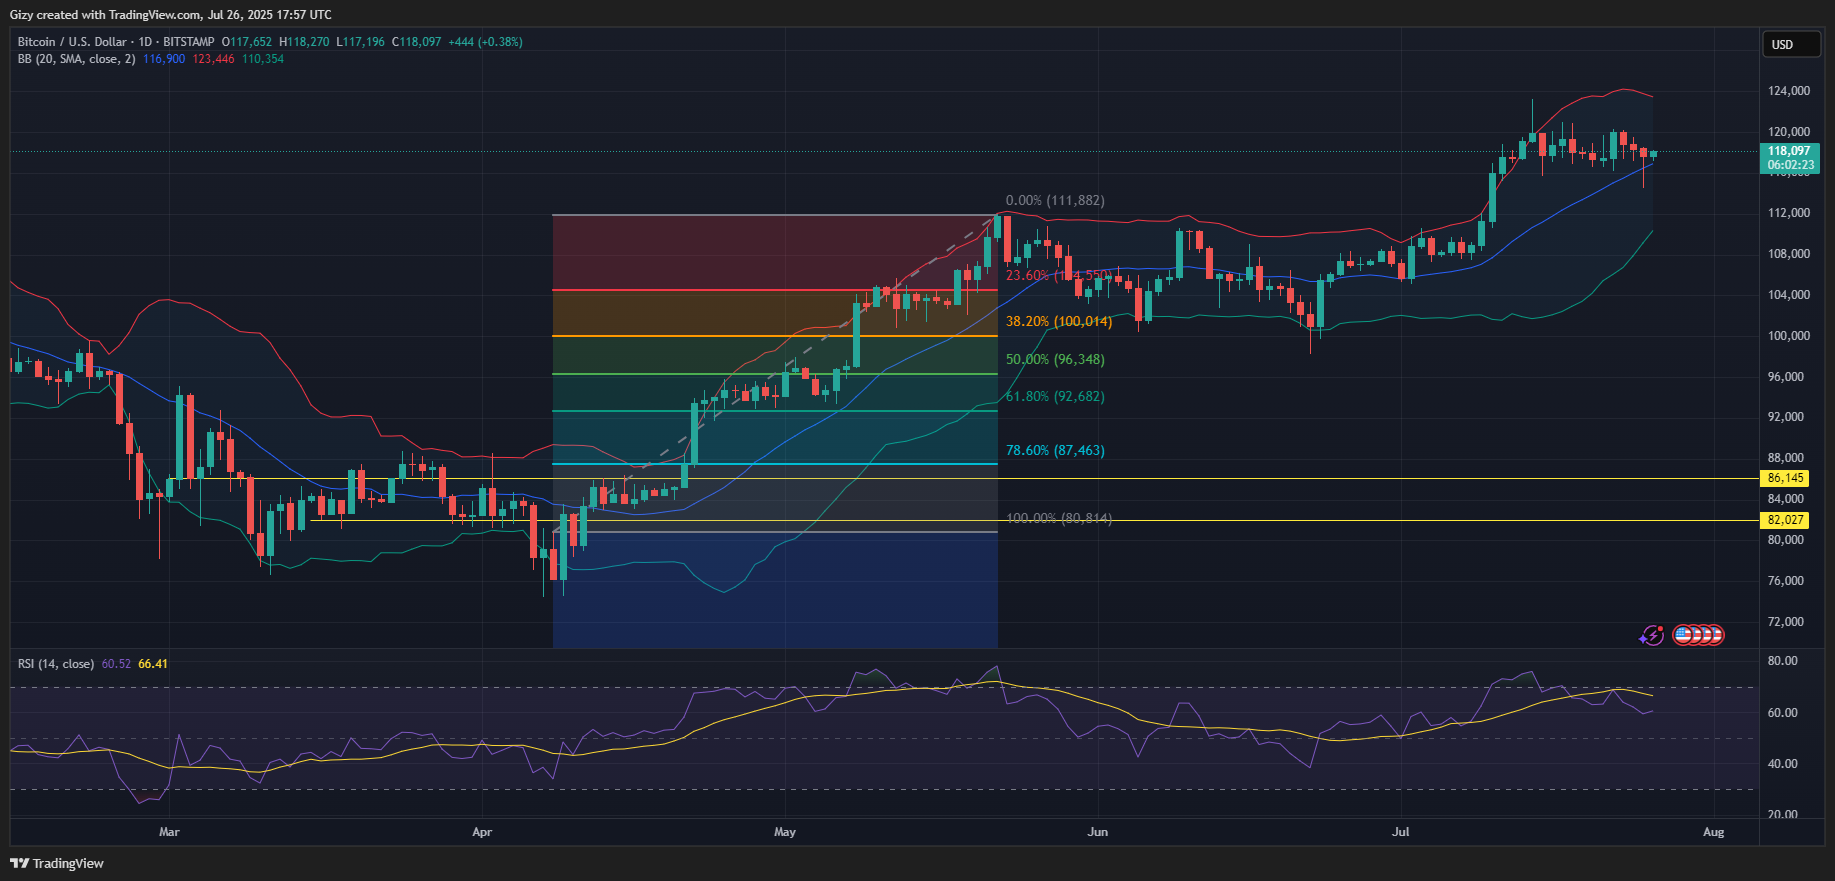
The asset recovered and closed slightly lower than its opening price. Current price points to the apex coin, grappling with little volatility. It prints a doji and barely moved from its opening price. Nonetheless, it’s worth noting that BTC broke below bollinger’s SMA.
The coin trades above the metric at the time of writing. Previous price movement showed that the largest coin resumed its uptrend after such a phenomenon. A repeat of this will likely see the cryptocurrency surge, breaking above $120k.
RSI is currently at 60. BTC is no longer overbought and has room for more price increases. Both metrics indicate an increased likelihood of a significant breakout.
ETH/USD
A closer look at the 1-day chart shows that Ethereum is trending sideways. Nonetheless, it maintained trading close to $2,700.
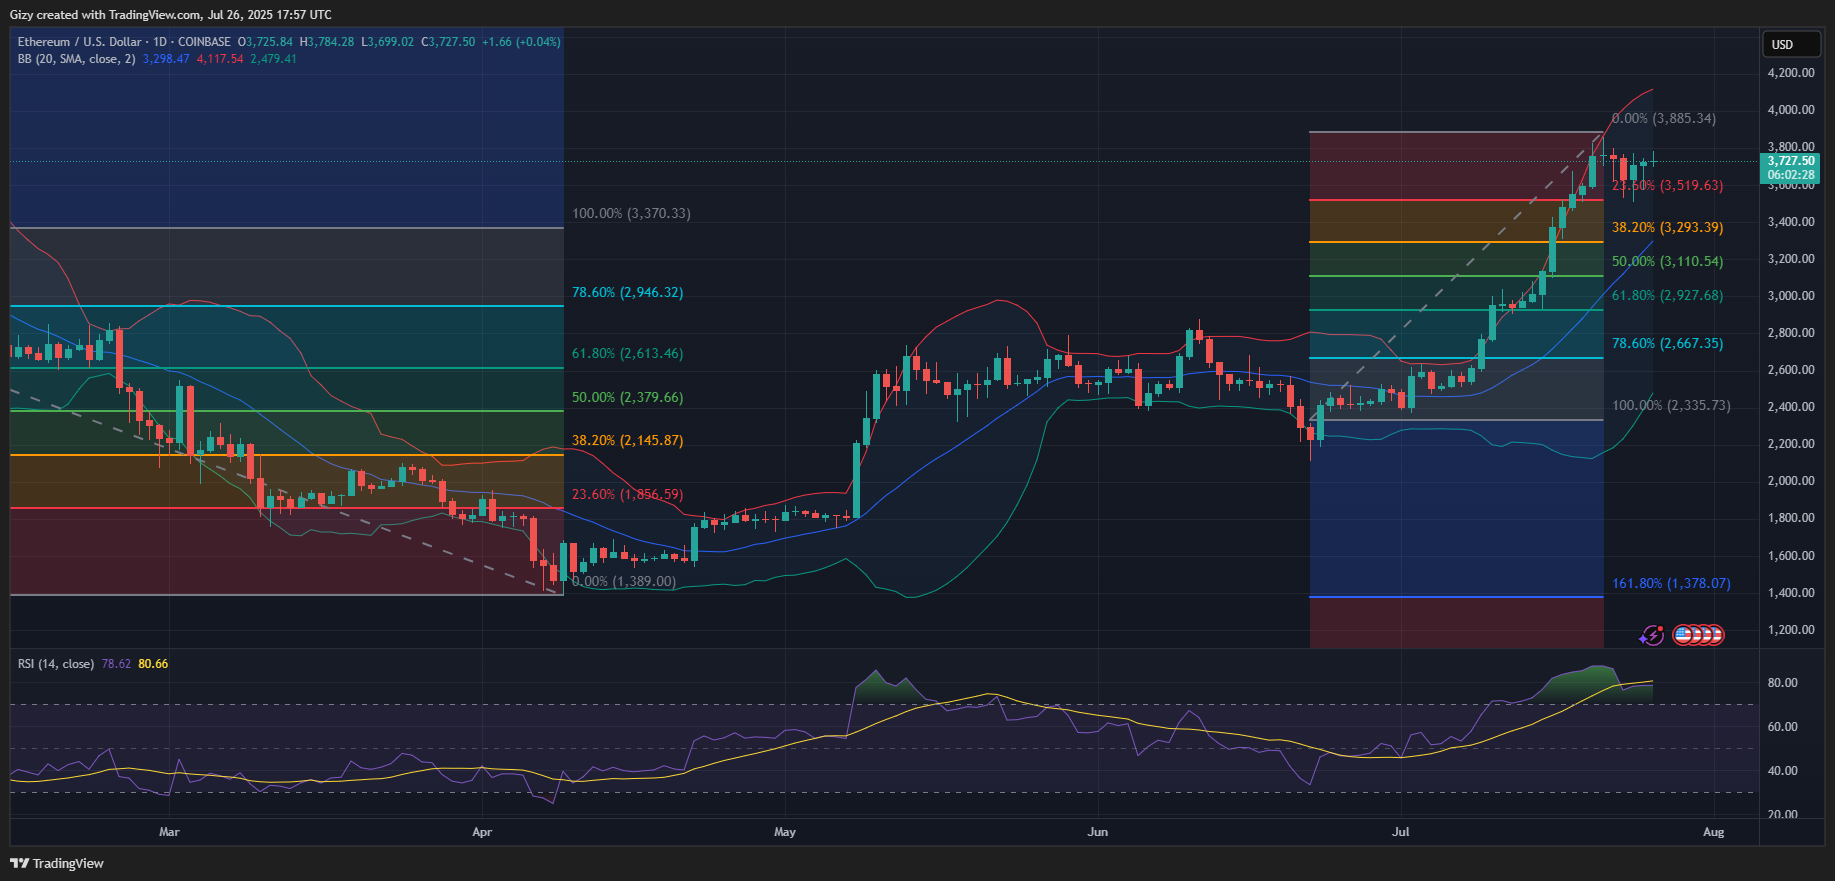
ETH has remained relatively stable since the start of the day. It bounced off the $2,600 on Friday and maintained trading above it on Saturday.
However, the apex altcoin is not yet out of the danger zone. It remains overbought as RSI is at 78. The 1-day chart shows that it is yet to experience a massive pullback. It means that such a decline is impending.
Nonetheless, ETH is trading farther from bollinger’s upper bands. The indicator points to two likely scenarios. One is the likelihood of a surge above $3,800. The other is a massive drop to the 38% fib level at $3,293.
Readings from the relative strength index favor further declines. Previous price movement supports this prediction as ETH almost always drops to bollinger’s middle band after retracing from a breakout.
XRP/USD
XRP is recovering from a previous massive decline. The altcoin rebounded from a drop to $3 on Friday and ended the session at its opening price.
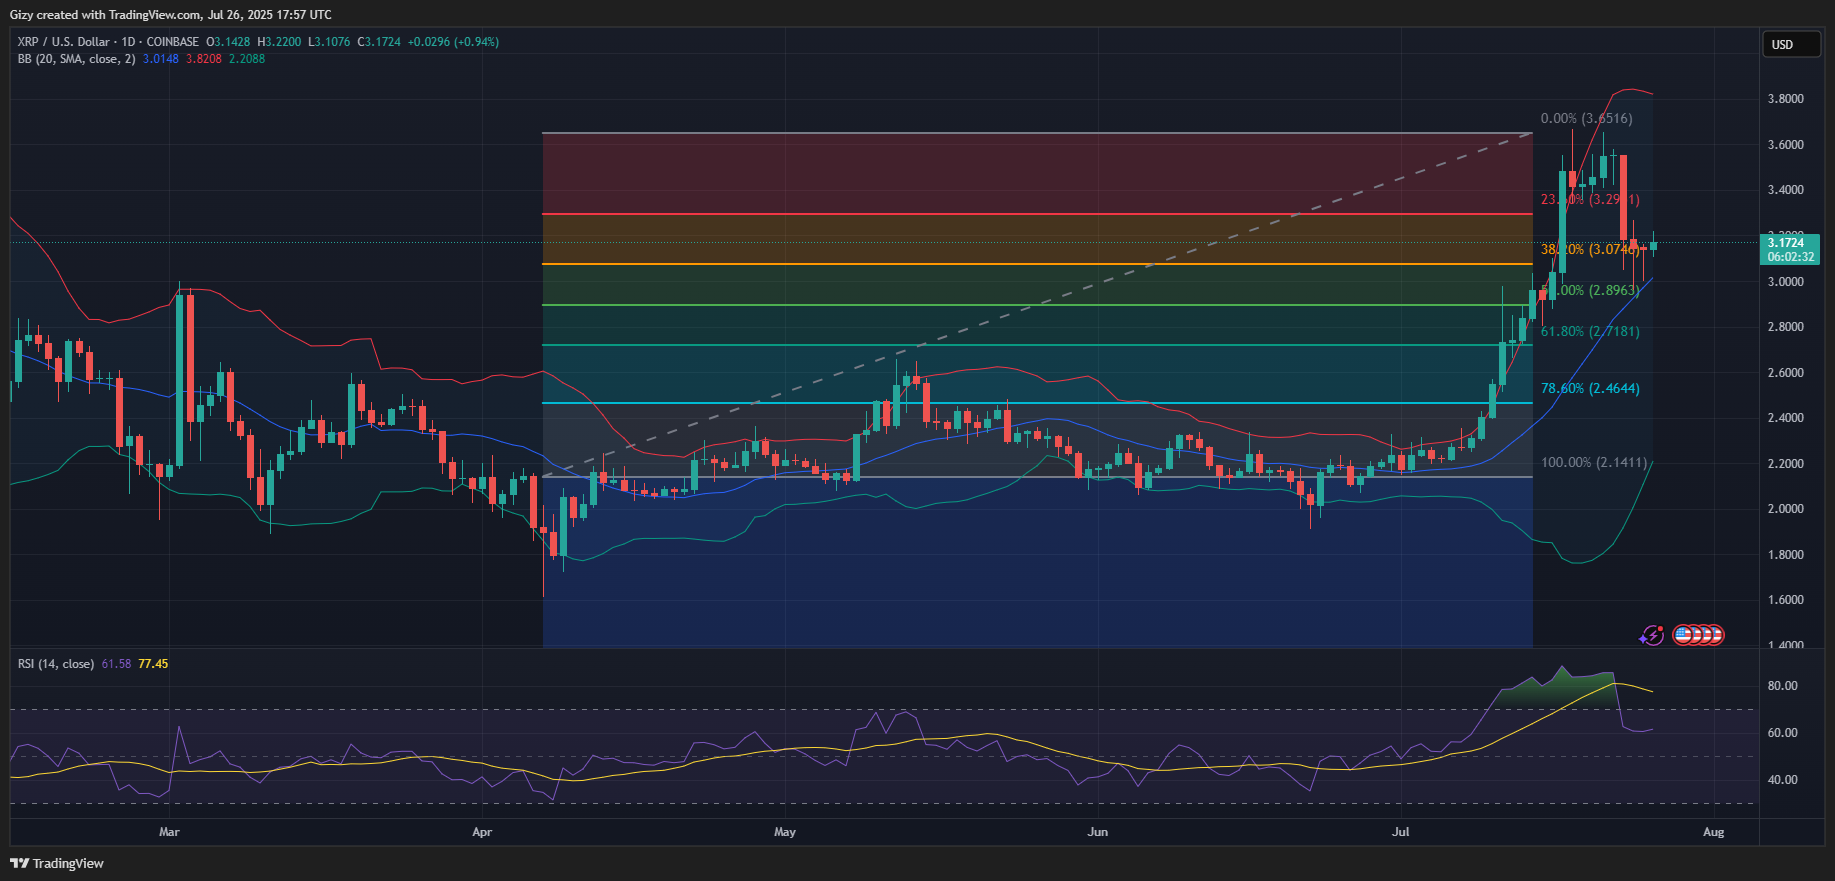
The bulls are looking to resume the uptrend. XRP trades at $3.21 at the time of writing and has gained over 2% since the day started. RSI is rising as buying pressure increases. The metric is at 62, indicating the bulls may sustain the uptick.
It is worth noting that the altcoin rebounded at bollinger’s middle band. The rebound may result in further increases in the coming days.
Nonetheless, currently trading slightly above the 38% fib mark, the asset will look to reclaim $3.30. It remains at risk of further downtrend as MACD flips bearish.
BNB/USD
Binance coin prints a red candle as prices slightly retraced. Current price movements suggest that the bulls were unable to sustain the previous day’s uptick.
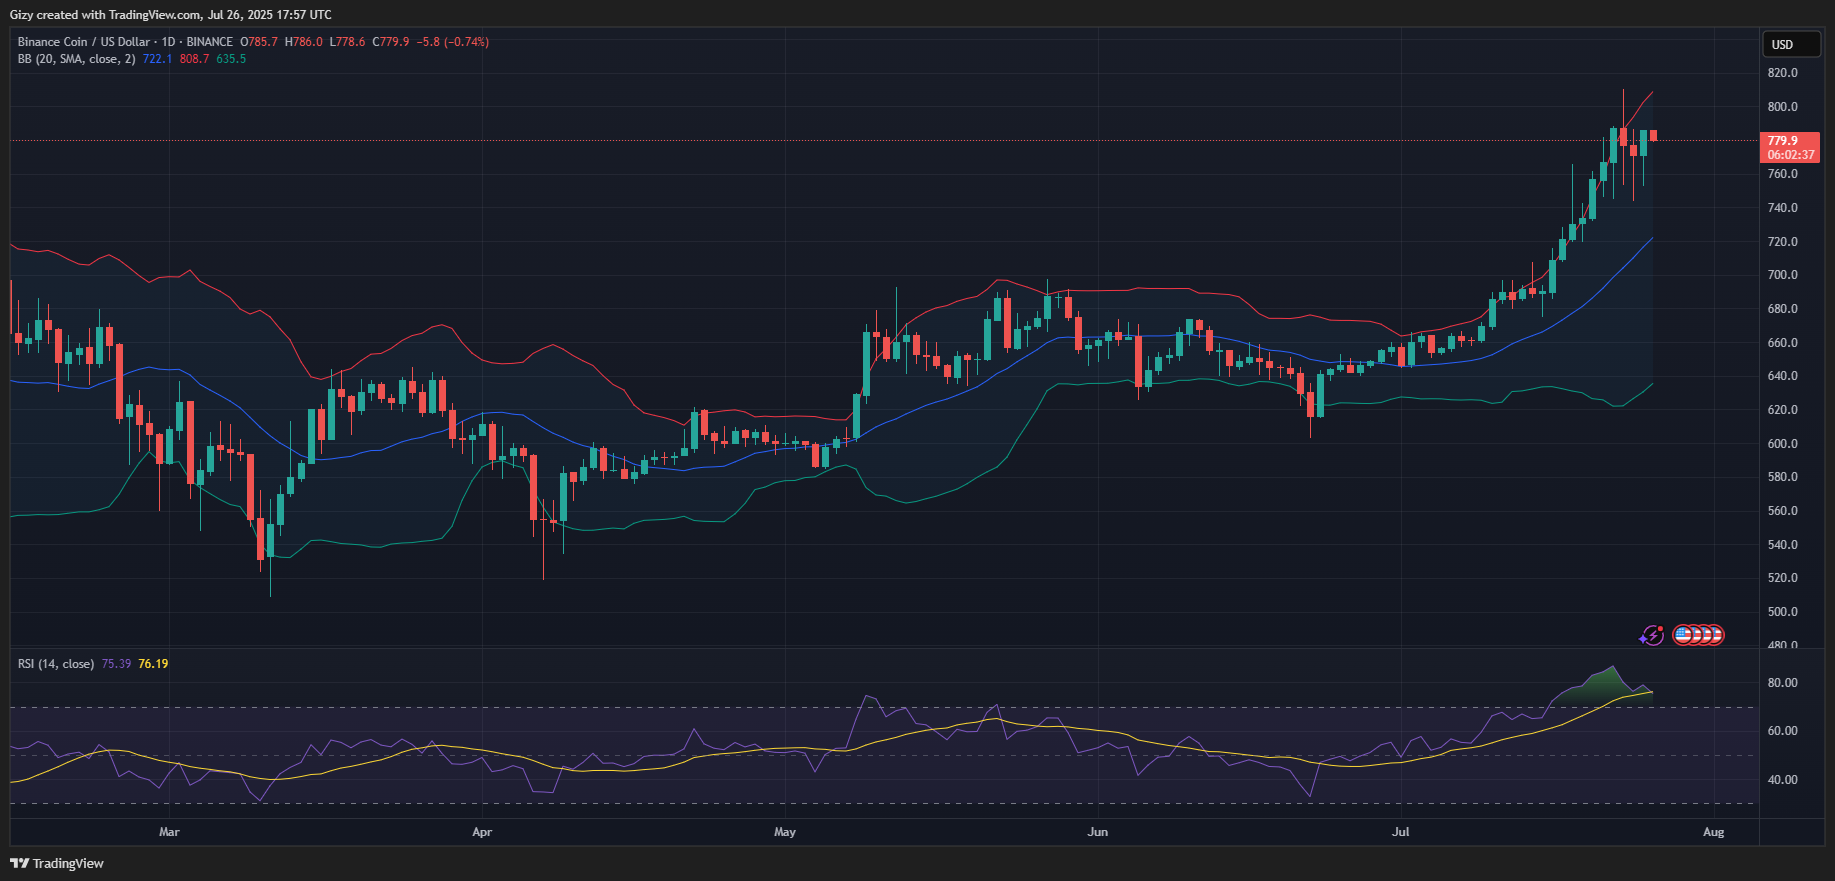
It is worth noting that the asset has not registered any significant surges since retracing after breaking out of the bollinger bands. The ongoing downtrend may worsen as other indicators are bearish.
The relative strength index (RSI) is at 75, indicating that BNB remains overbought. The recent readings, coupled with the trend of the coin dropping to bollinger’s middle band, suggest that the altcoin may drop $720. However, there is notable demand concentration around $740.
SOL/USD
A closer look at SOL shows a similar price movement to DOGE. The coin, which had massive declines a few days ago, is struggling to recover. It prints a doji at the time of writing after retracing from a slight uptick.
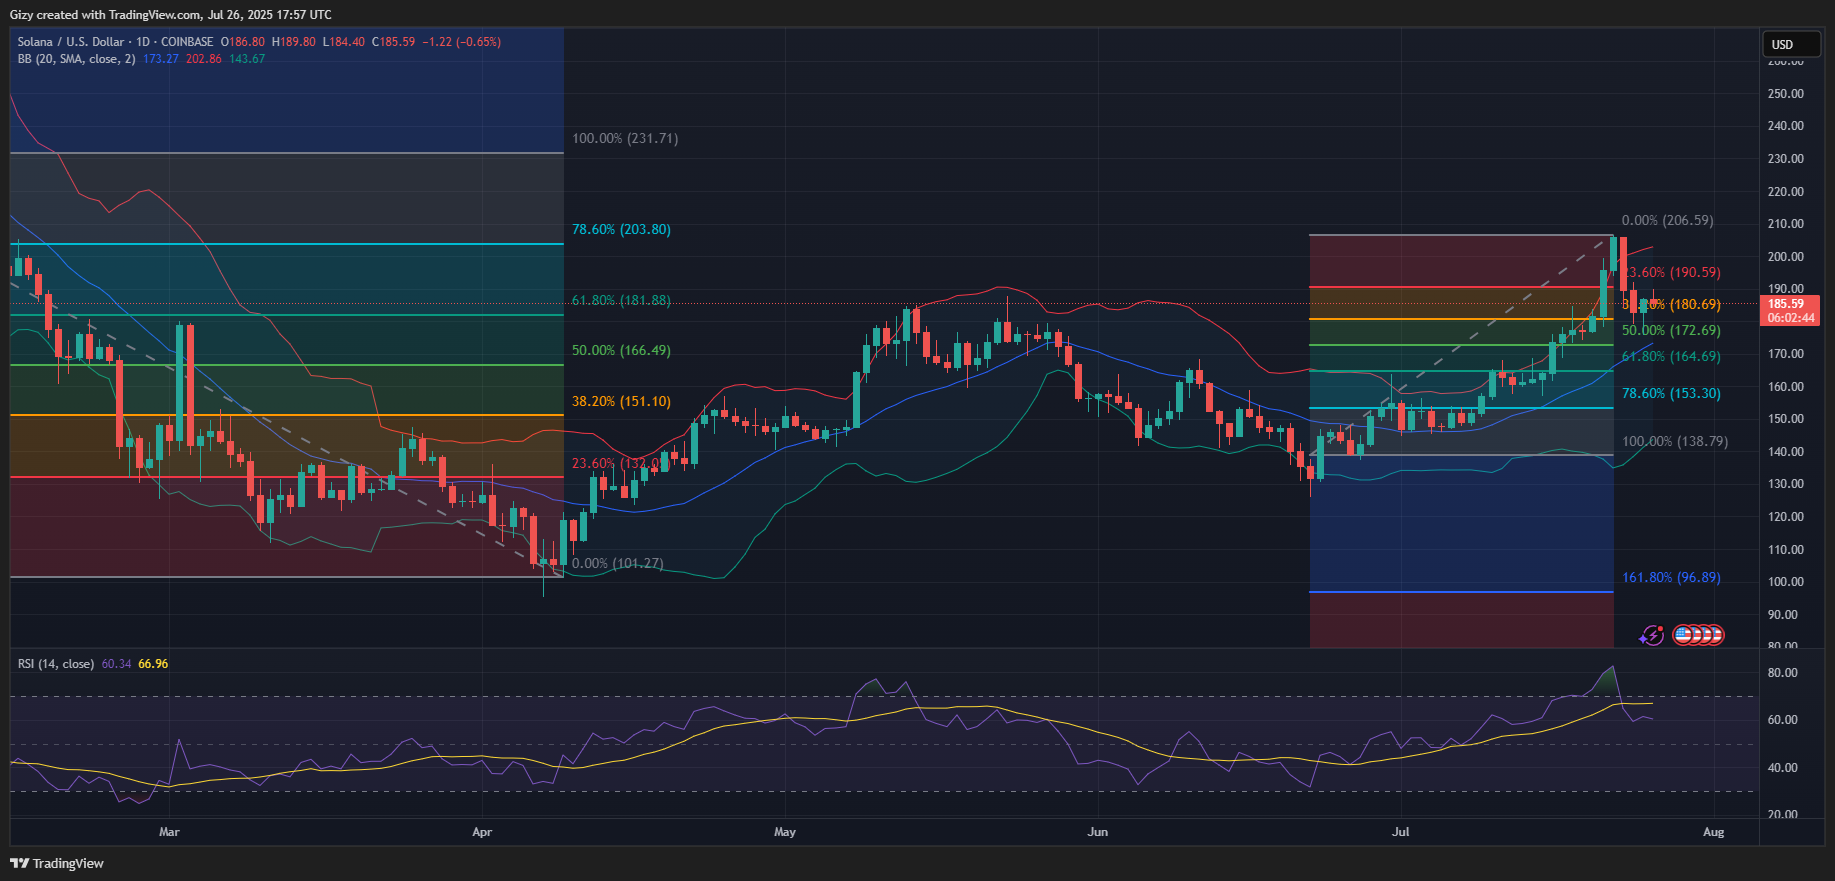
Solana trades between the 23% and 38% fib level. Previous price movements suggest that the asset may drop below the 38% mark. It may continue downward after flipping the mark. Nonetheless, it may rebound around the 50% fib level at $172.
The bollinger Band supports this claim as it hints at a retest of the middle band.
DOGE/USD
DOGE dropped to a low of $0.22 on Friday but rebounded and closed slightly above its opening price. The asset is currently stuck at its opening price, having shown no significant movement.
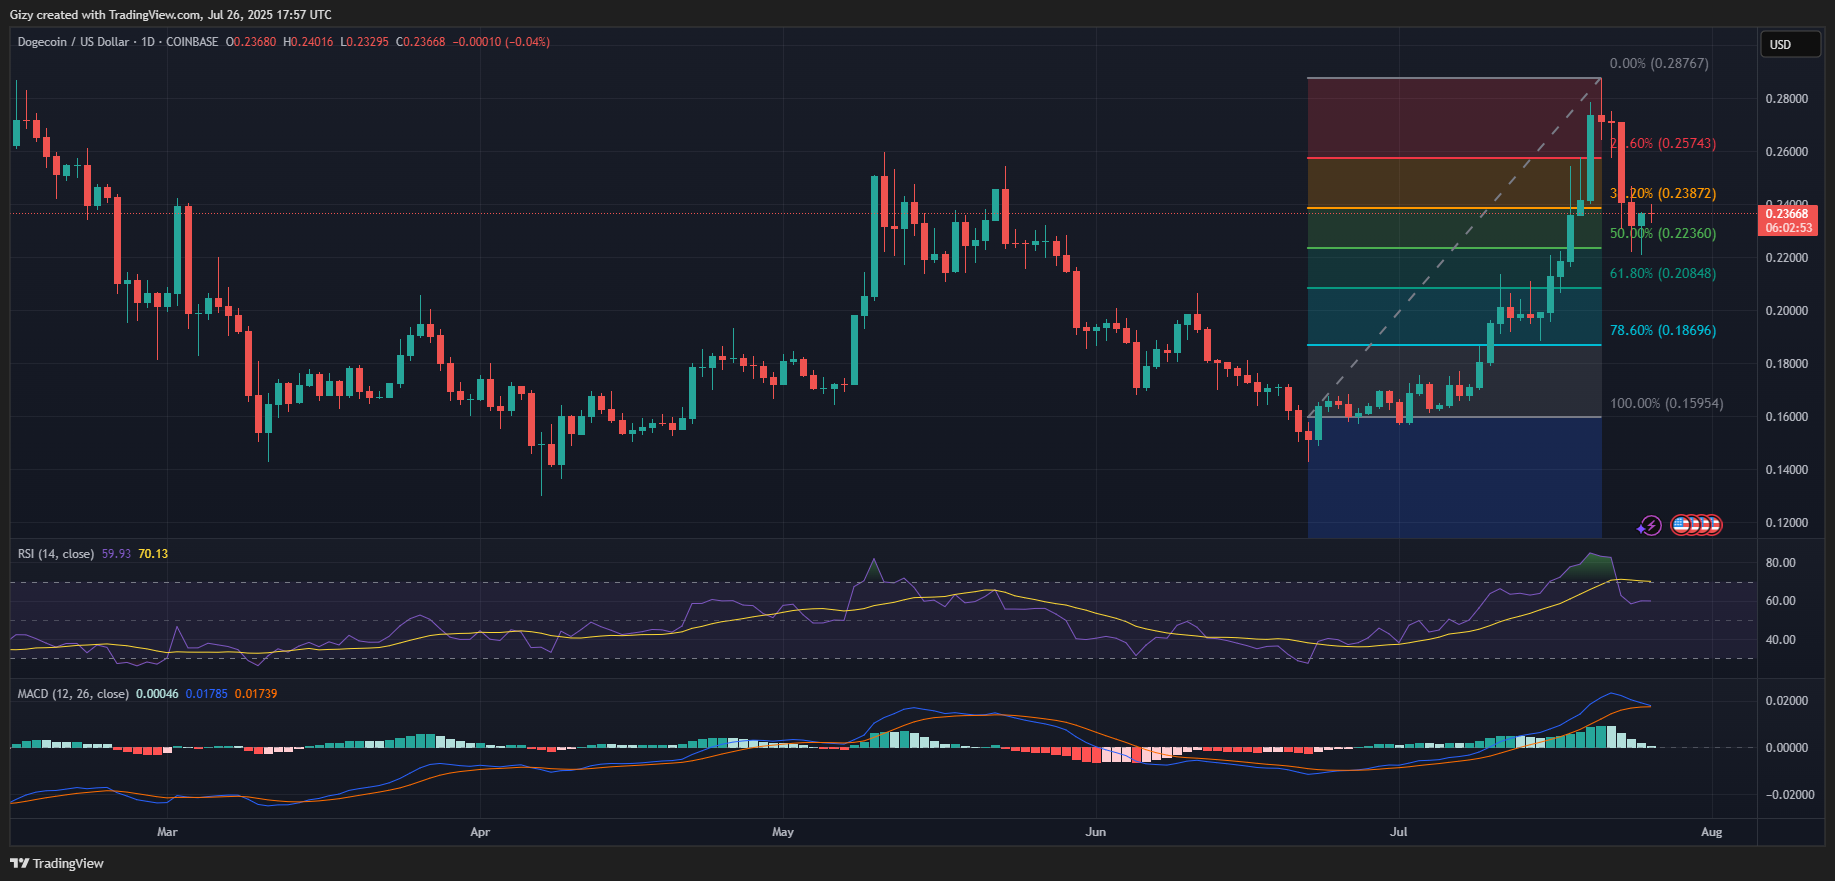
Dogecoin trades close to the 38% fib level but shows no signs of reclaiming it before the day ends. The moving average convergence divergence is the verge of a bearish interception. It raises concerns of further downtrends.
DOGE may drop further, potentially breaking below the 50% Fibonacci level again. Nonetheless, the relative strength index remains stable around 60 over the last three days. It may indicate a likelihood of further uptrends.
ADA/USD
Cardano’s recovery enters day 2. However, the price surge is not significant. The asset faced slight rejection at $0.83 but remains green.
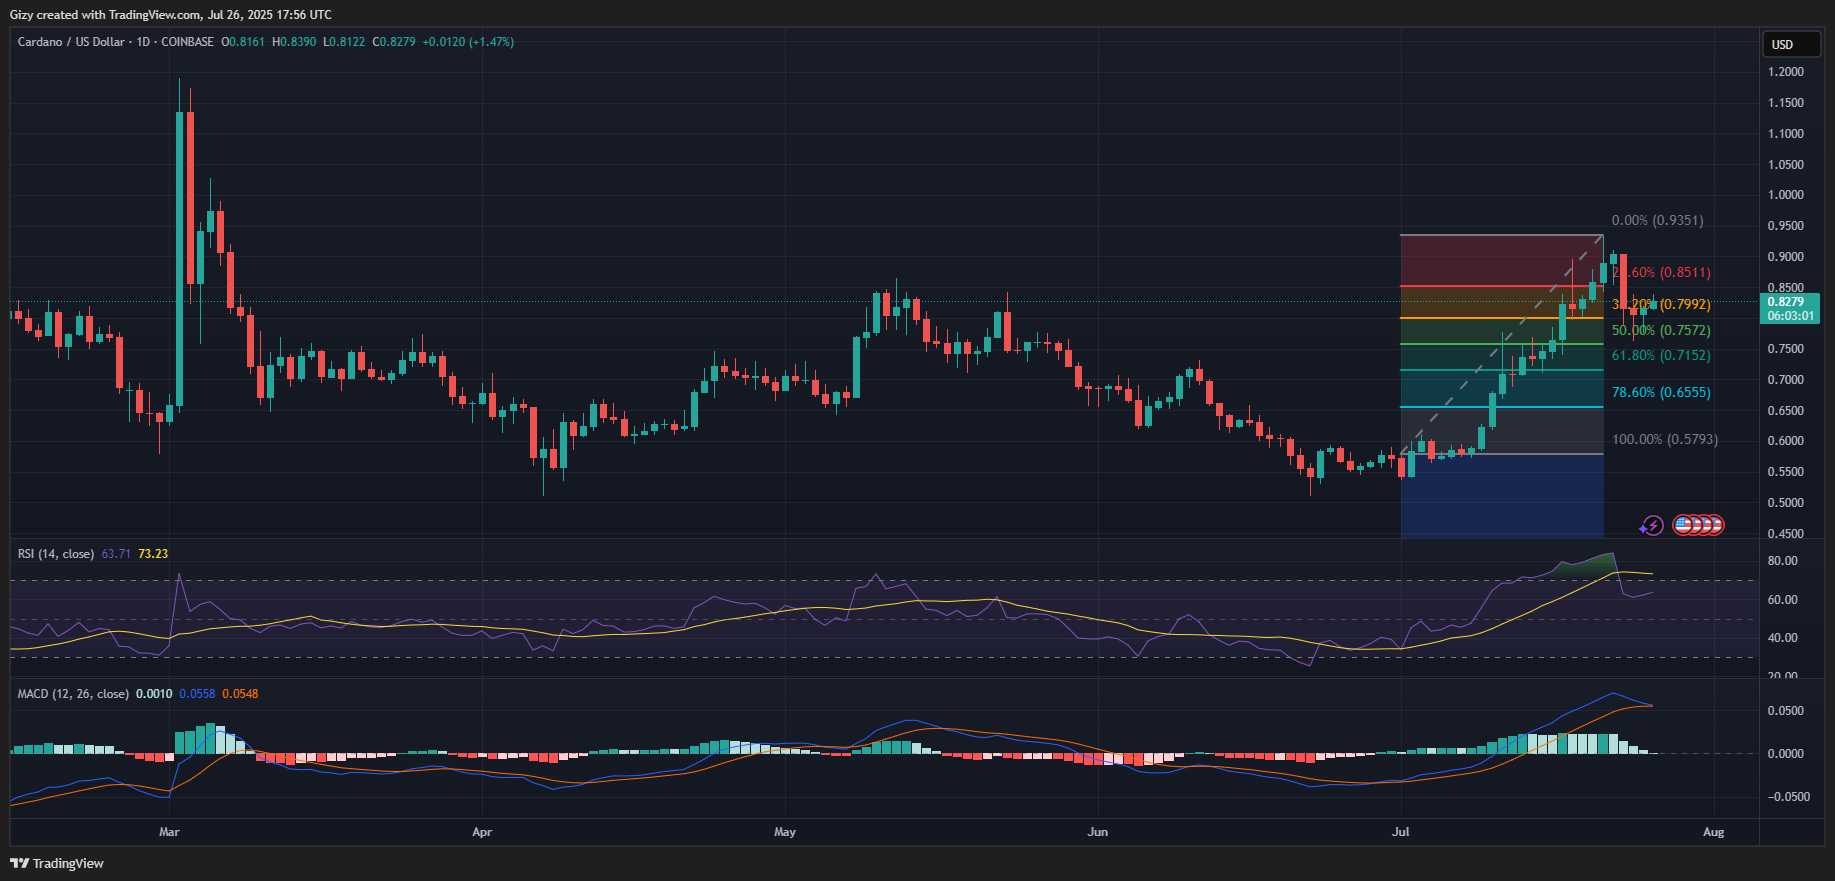
Like DOGE, ADA trades near the 38% Fib level. The moving average convergence divergence is the verge of a bearish interception. It raises concerns of further declines.
ADA may lose momentum and head downwards, retesting the 50% fib level around $0.75. Nonetheless, the relative strength index remains stable at around 63 over the last three days. This may indicate a likelihood of further upward trends.