BNB reached a new milestone a few days ago, following several consecutive days of increases. However, it is struggling to continue as the crypto market is experiencing notable selling pressure at the time of writing.
Nonetheless, a bearish close at the current price will mark the coin’s second day of consecutive losses. Recent data indicate that BNB experienced a 13% decline in trading volume over the last 24 hours, shedding further light on the reason behind the latest decline.
However, a sweep through the top 100 shows that almost every asset is experiencing the latest selloffs. One of the worst-hit is DOGE. It is down by over 4% over the last 19 hours.
A look at the global cryptocurrency market cap shows slight declines due to the current selling pressure. Aside from the effect on price, indicators on the 1-day chart are flipping bearish. For example, the moving average convergence divergence reveals that the 12 EMA is declining as the sector moves to record its second day of retracement.
Nonetheless, the most anticipated event of the year is about to happen. The Federal Reserve is expected to announce a possible rate cut on Wednesday, and investors are anticipating the impact this declaration will have on prices.
It is also worth noting that the 1-day chart of several cryptocurrencies is currently negative. However, the latest trend is a precursor to the impending fundamentals. Let’s see how prices will react in the coming days.
BTC/USD
Bitcoin surged to a high of $116,786, marking a positive start to Monday. However, the asset succumbed to a wave of selling pressure, causing prices to retrace slightly.
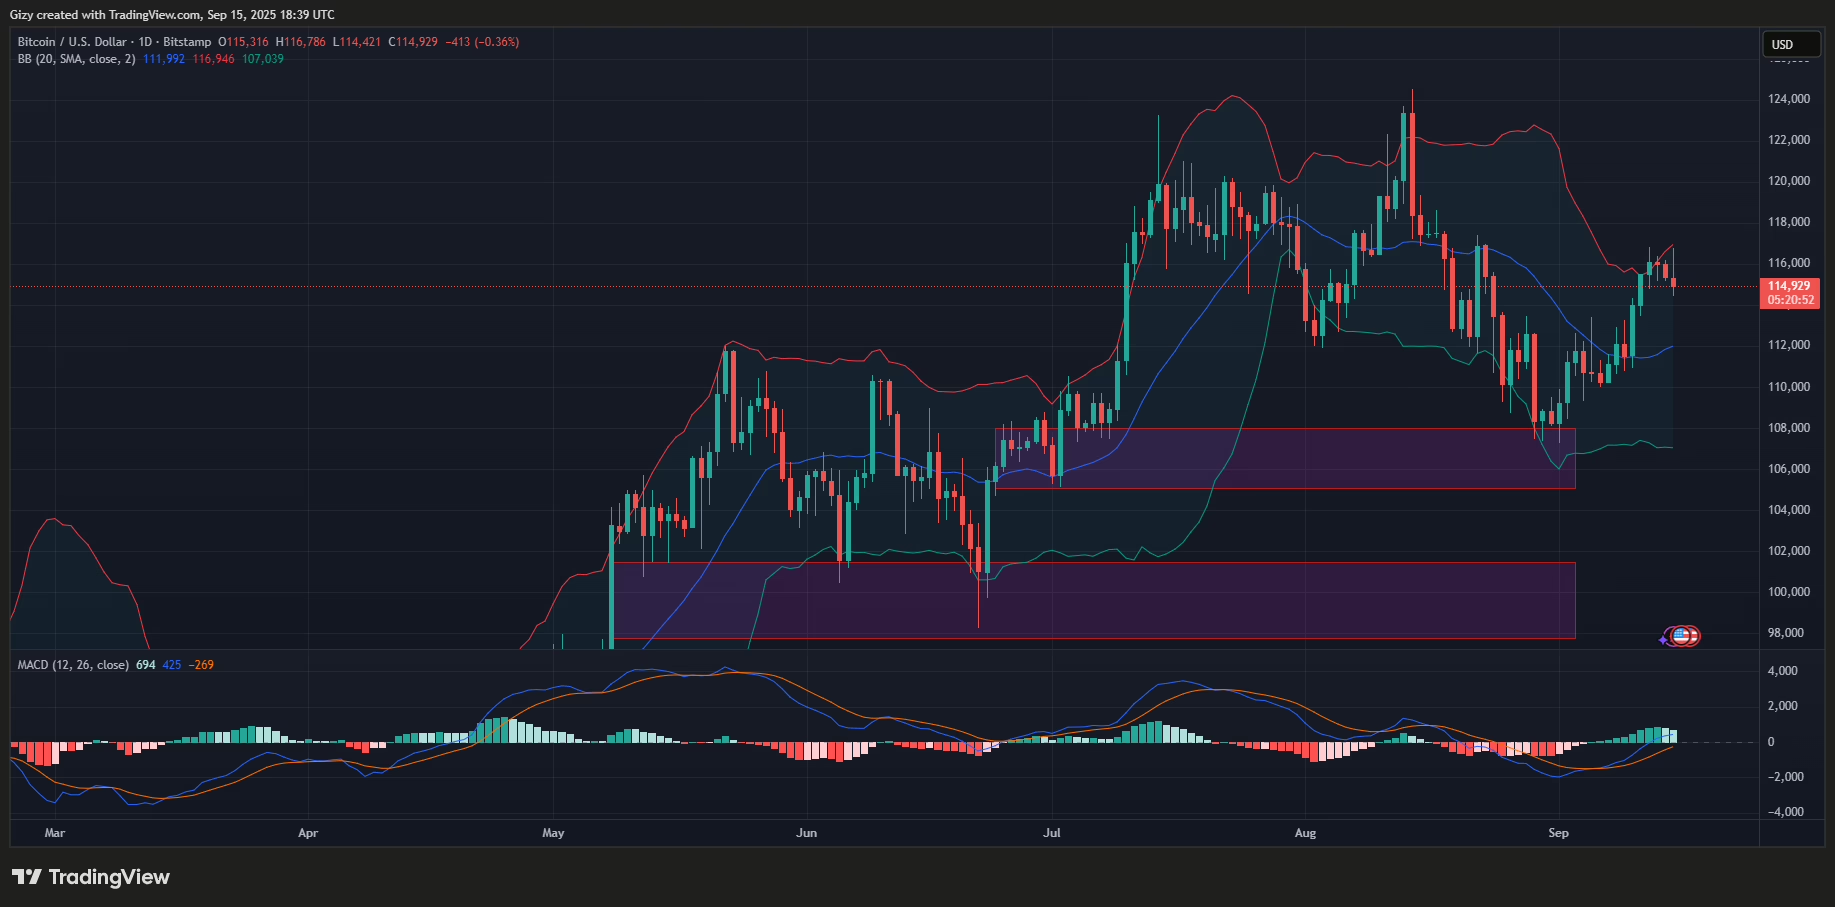
A closer look at the 1-day chart reveals that the coin is heading for its third day of slight decline, and indicators are reacting to the latest trend. One such is the moving average convergence divergence. The 12 EMA is losing its upward momentum as the histogram prints smaller bars.
The latest changes in the indicator may suggest further declines in the coming days. If this holds, the apex coin may retrace as low as $112k.
However, the 4-hour shows that the downtrend is nearing its end as BTC rebounded after breaking below bollinger’s lower band. This may result in the asset resuming its uptrend, breaking $17k
ETH/USD
Ethereum is seeing one of its biggest declines in the last seven days. It retraced from $4,672 to $4,464 but trades slightly higher at the time of writing.
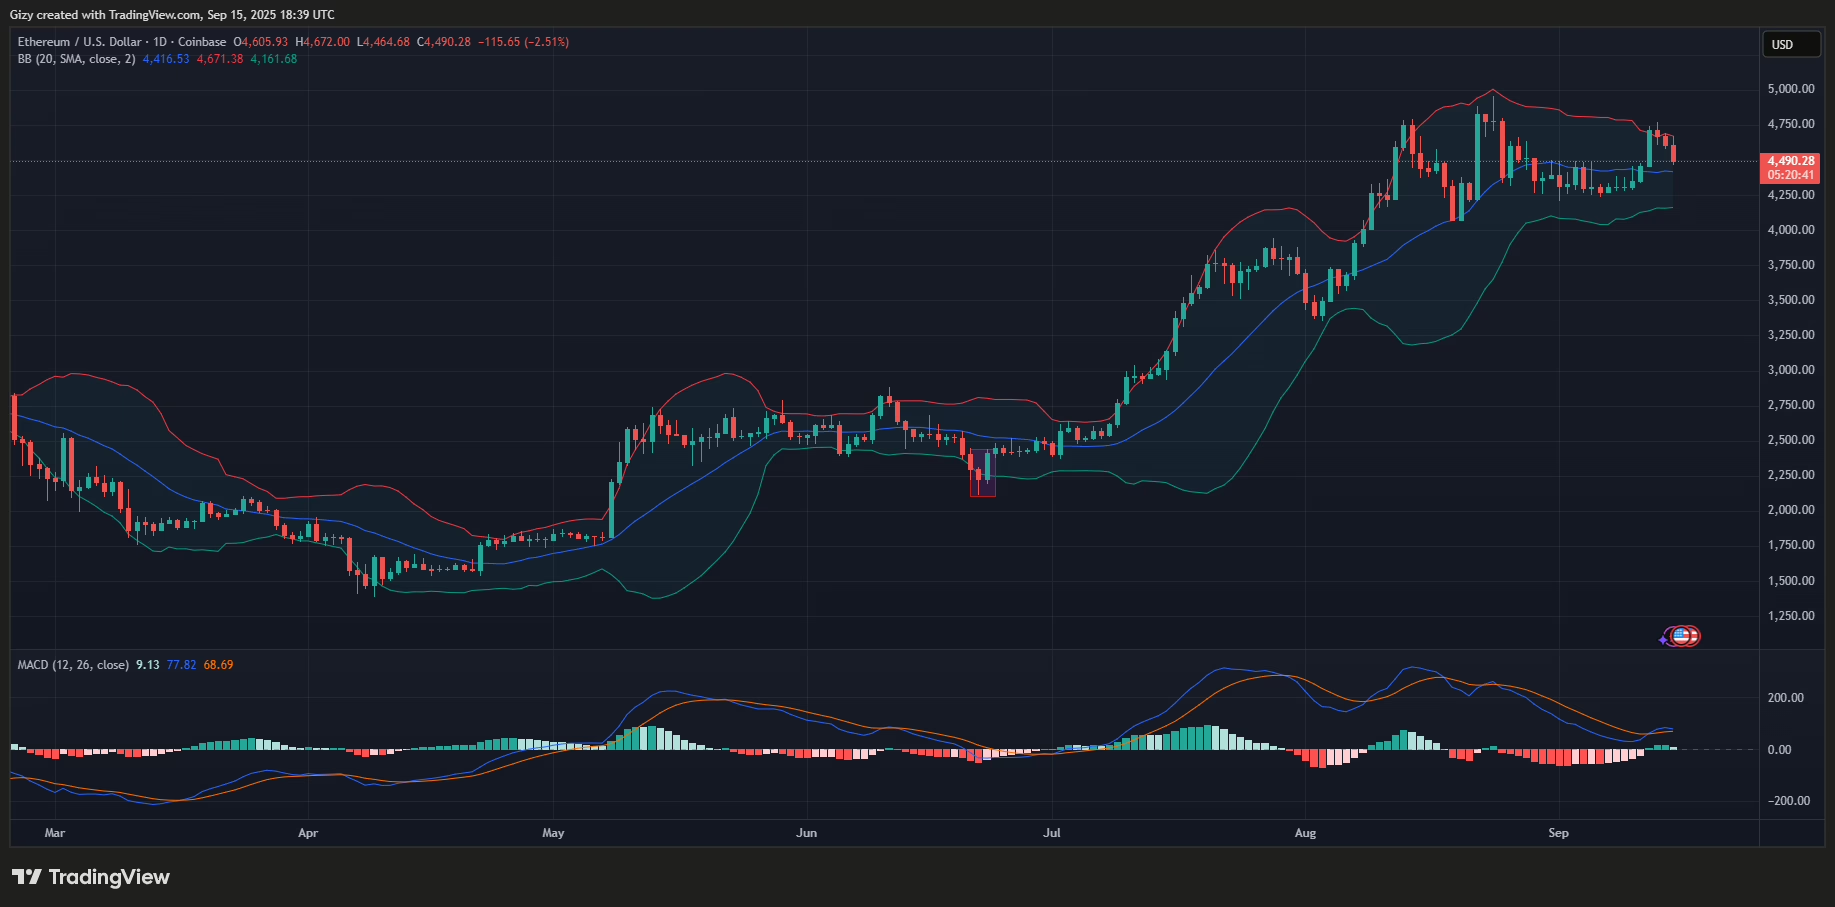
MACD on the 1-day chart paints a negative picture about how the price may play out in the coming days. The metric is having bearish convergence, and a divergence may signal more descent. The current timeframe suggests that ETH may retrace to $4,300.
However, the 4-hour chart indicates a reduced likelihood of a drop to $4.3k. A closer look at the bollinger bands reveals that the asset broke out of the indicator a few hours ago. It is also seeing a slight pullback as it experiences a minute spike in buying pressure.
The shorter timeframe indicates that ETH will surge higher from its current price. Its next price target will be a return to $4,700.
XRP/USD
A previous outlook noted that XRP will break above $3.10, citing the bollinger bands as a reason for the conclusion. True to this prediction, the asset attempted $3.20 a few days ago but retraced after failing to break it.
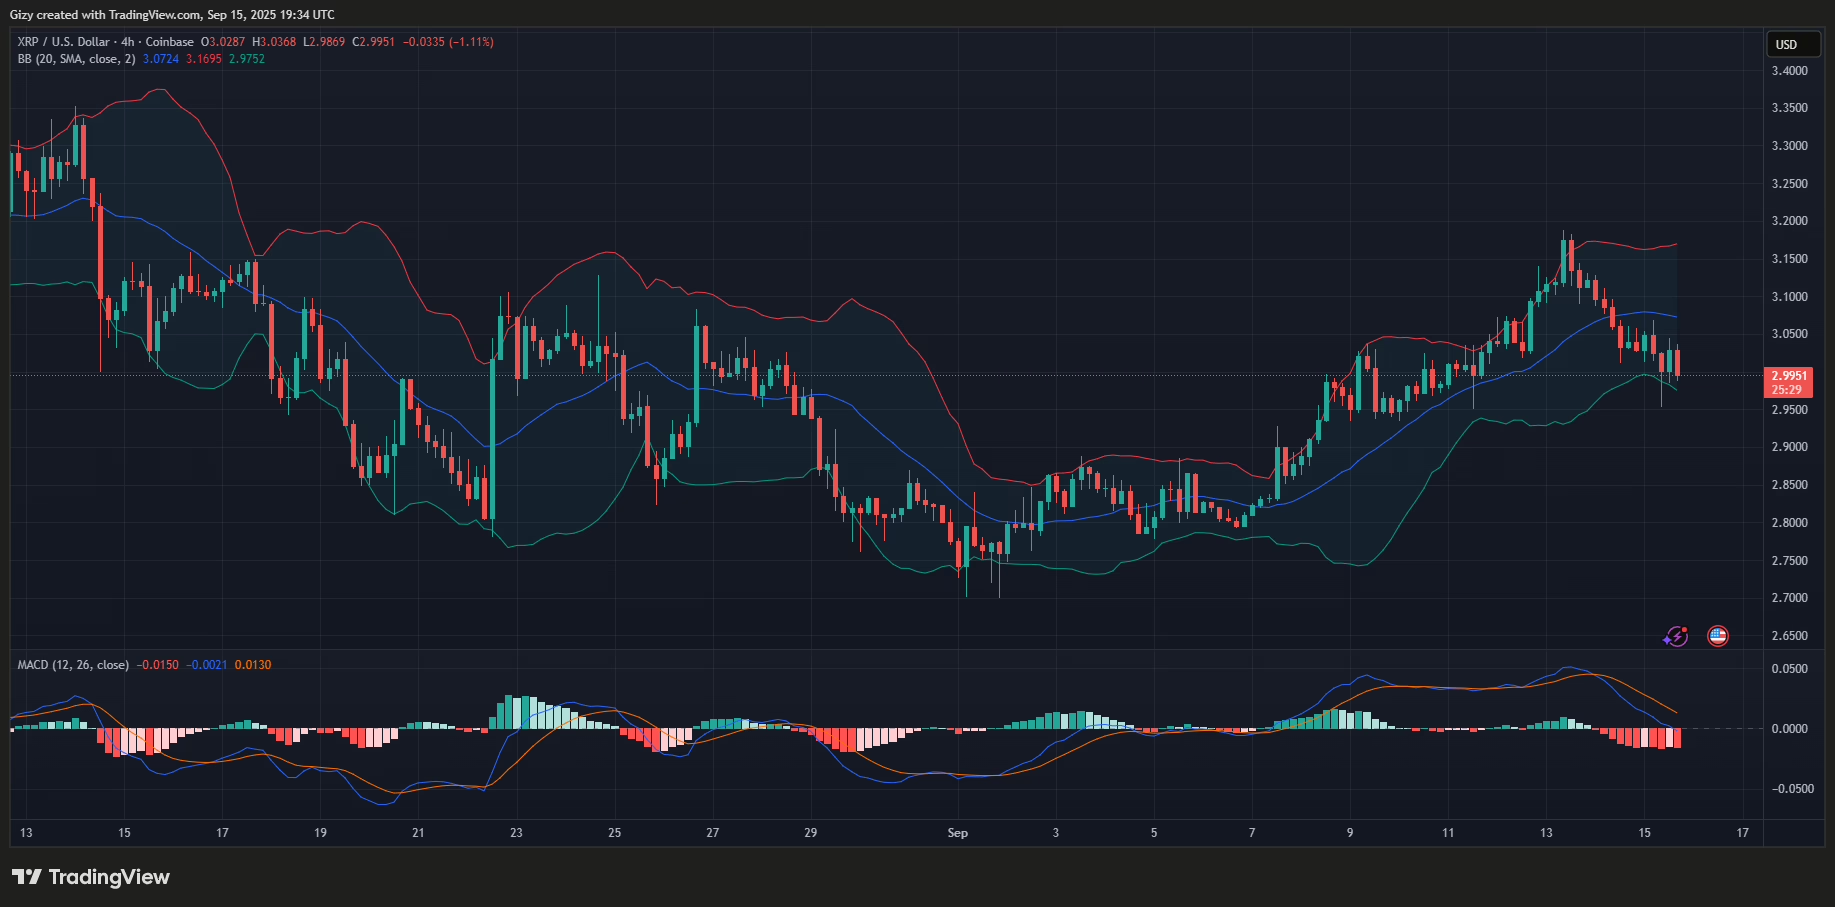
The retracement is ongoing, but the 4-hour chart suggests that the downtrend may be nearing an end soon. XRP broke below the BB but rebounded, and grapples with slight price fluctuations close to the lower band. Nonetheless, breaking below the metric most signals the end of the decline.
The indicator points to an impending attempt at $3.20 in the coming days.
SOL/USD
Solana is facing notable selling pressure, similar to BNB. Nonetheless, it reclaimed the fifth spot in the top 10 amid the decline.
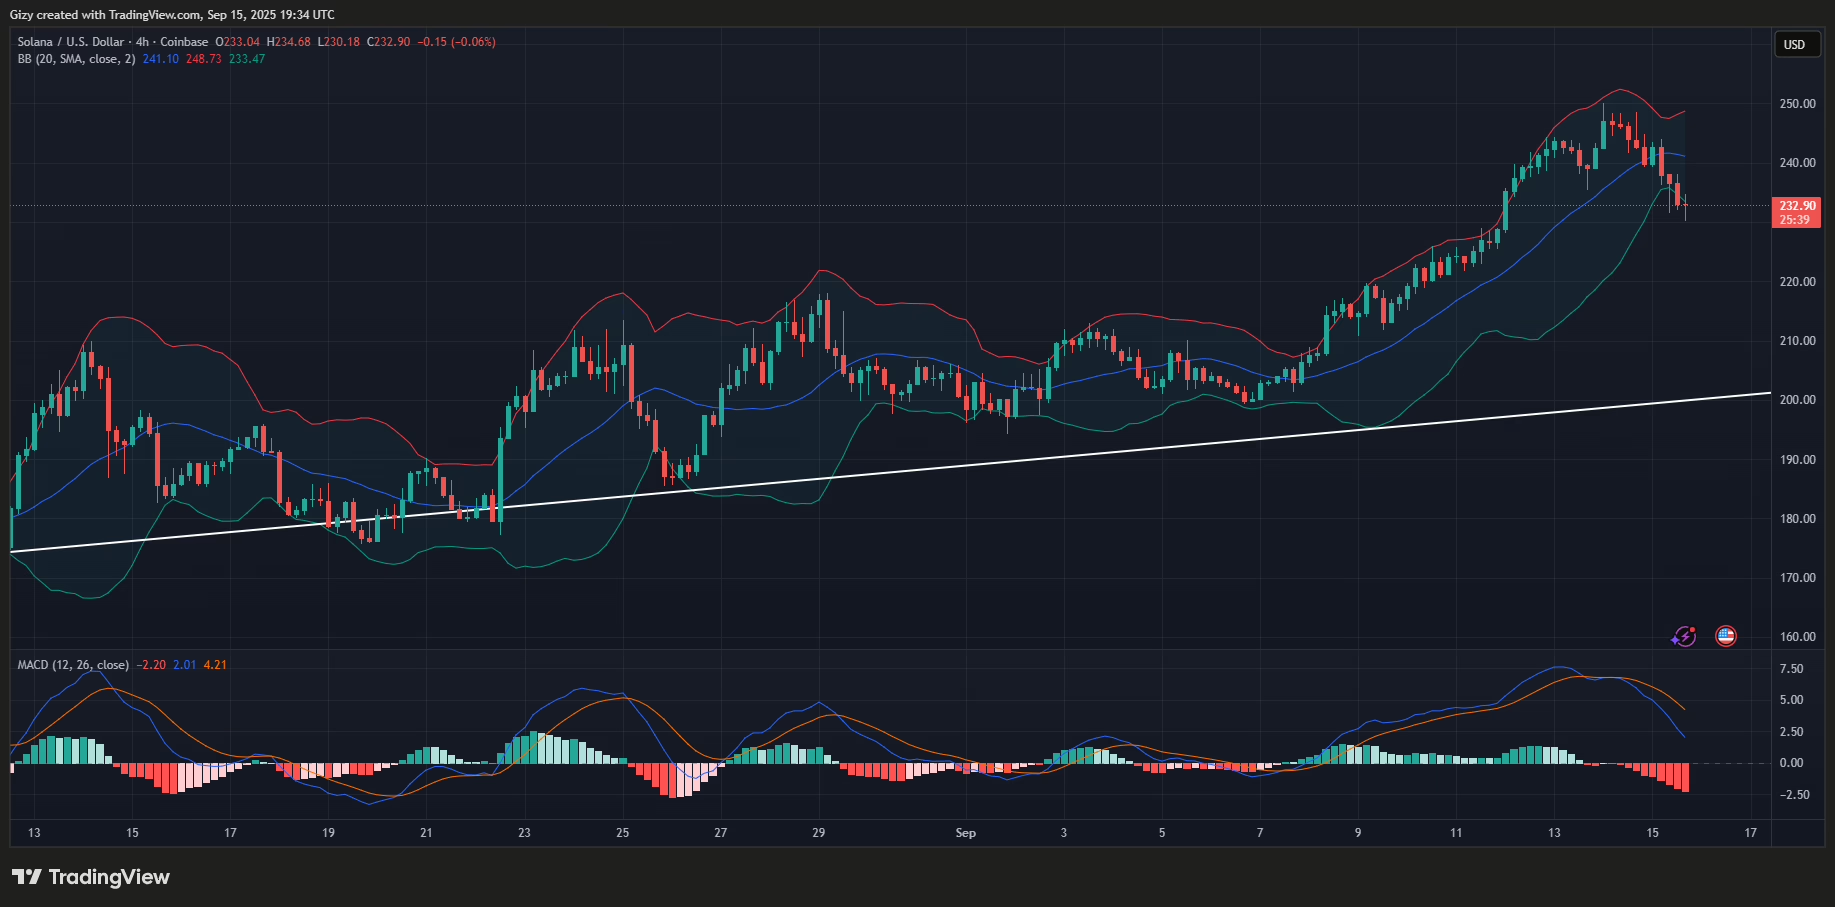
Nonetheless, the 4-hour chart shows that the altcoin is seeing a slight buyback at the time of writing. Its latest candle started below the bollinger bands. However, the asset retraced to $230 but has since returned to its opening price of $233.
The latest rebound may signal further price increases, and SOL may look to surge higher. It will look to reclaim $240 in the coming days. Aside from the BB, the slight change in the relative strength index indicates a shift from selling to accumulation, which supports the earlier prediction.
BNB/USD
BNB is recovering from a notable decline it experienced earlier. It dropped to a low of $913 but rebounded and is now trading at $922. Its latest candle on the 4-hour chart shows it rebounded at a support it held for more than 8 hours.
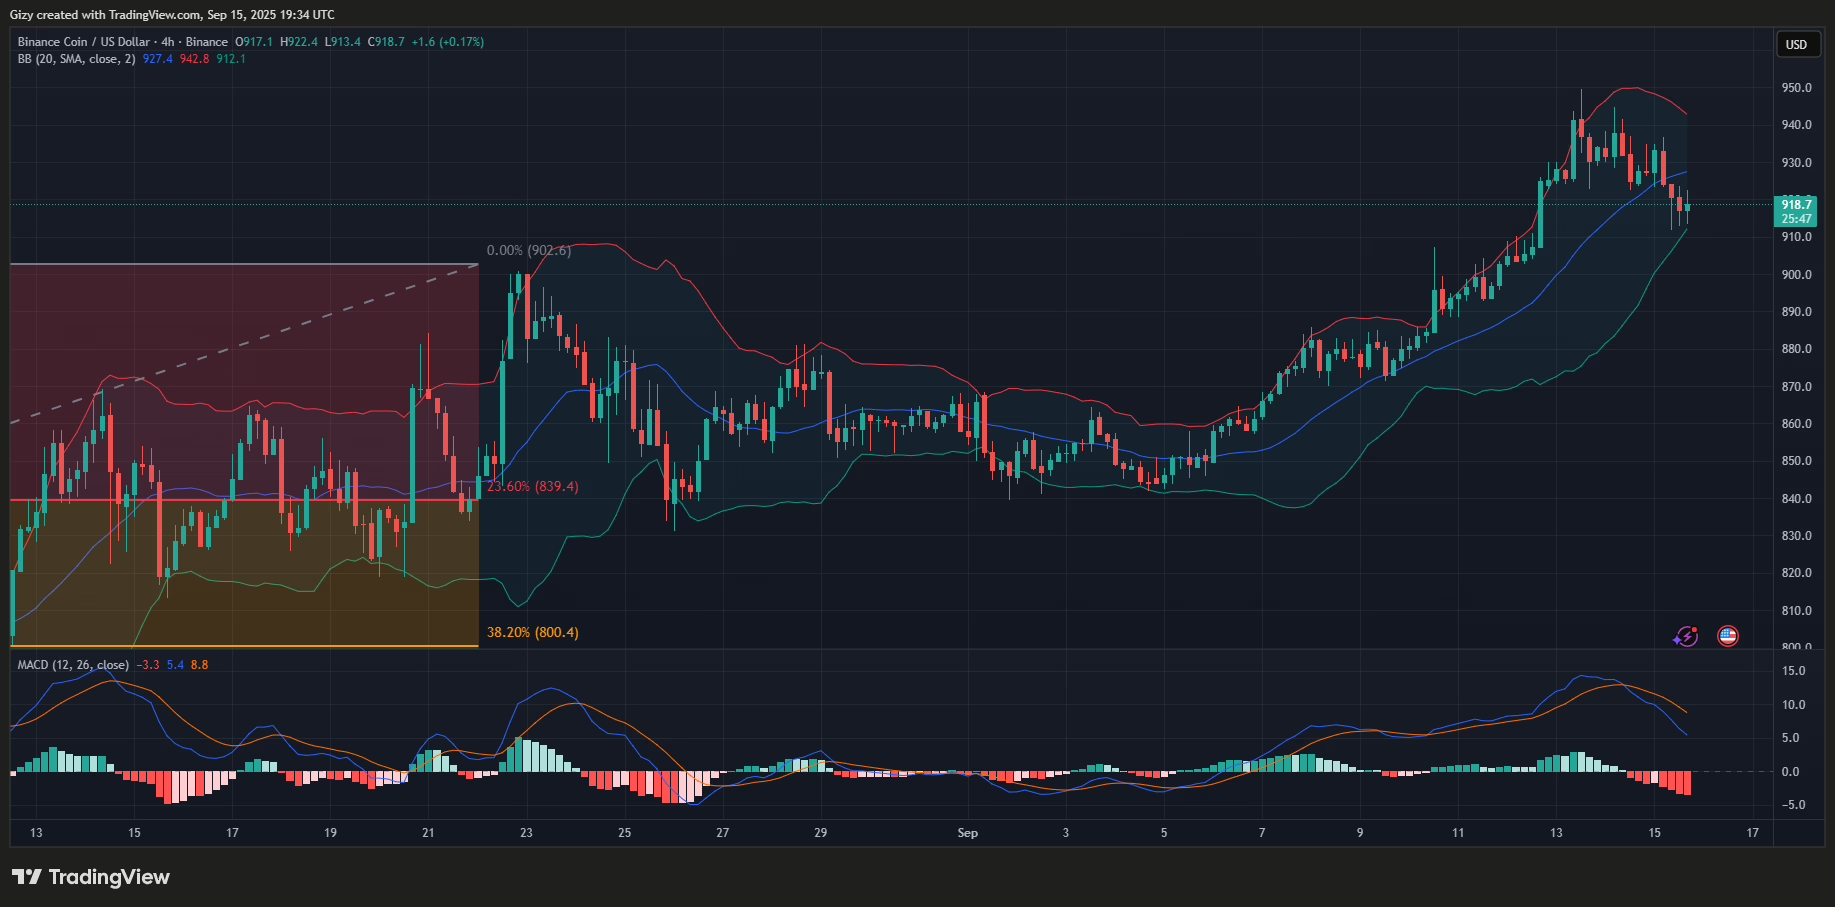
It is also worth noting that this is its first green after three reds. These shifts may indicate further increases in the days to come. BNB may surge, edging closer to testing its two-day resistance at $940. Flipping this level will see it retest its ATH.
Nonetheless, the bollinger bands indicate a higher likelihood of the uptrend continuing.
DOGE/USD
A closer look at the 4-hour chart reveals that DOGE previously experienced notable declines, similar to those of BNB. Noteworthy is an incident that occurred during the session starting at 4:00 UTC, when it lost over 4%.
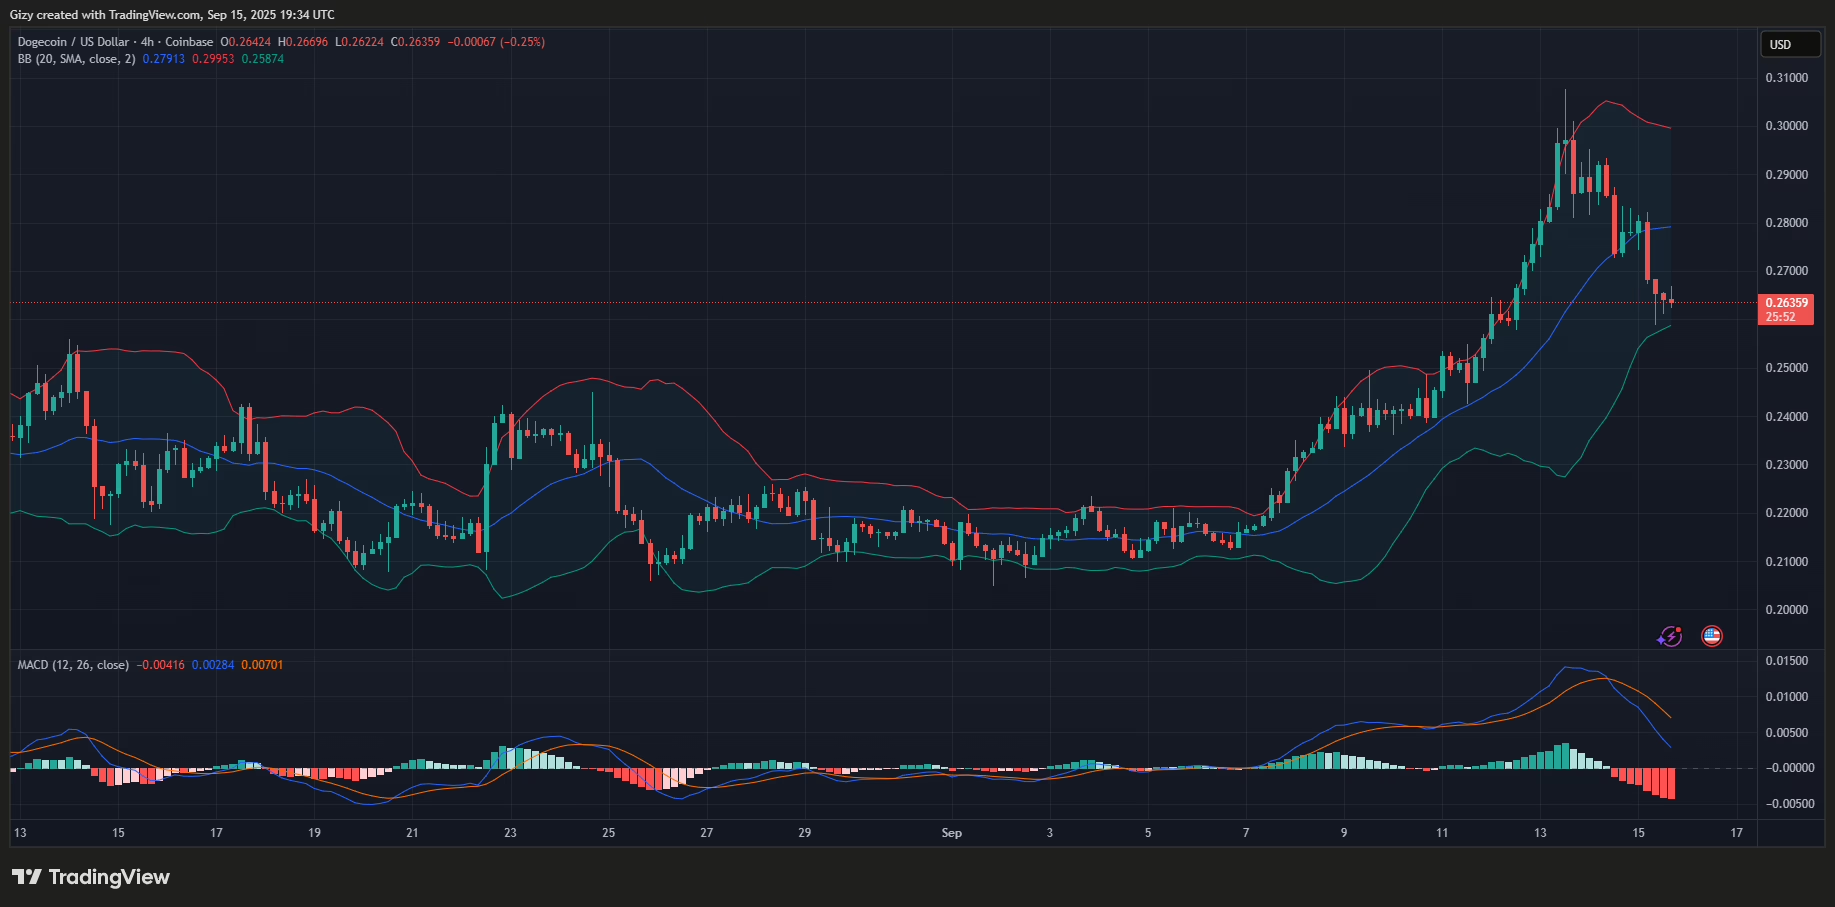
Nonetheless, the candlesticks show signs of improvement over the last 12 hours. A closer look at the chart reveals higher lows, and the asset is currently printing a green doji, indicating a gradual increase in buying pressure at the time of writing.
If the improvement continues, DOGE will look to reclaim lost levels. The first mark to watch is $0.280 and subsequently $0.30.
ADA/USD
Similar to BNB, ADA is seeing a slight improvement after its previous decline. Its last two candles on the 4-hour chart are smaller. While this indicates a drop in volatility, it also reveals that the descent has slowed.
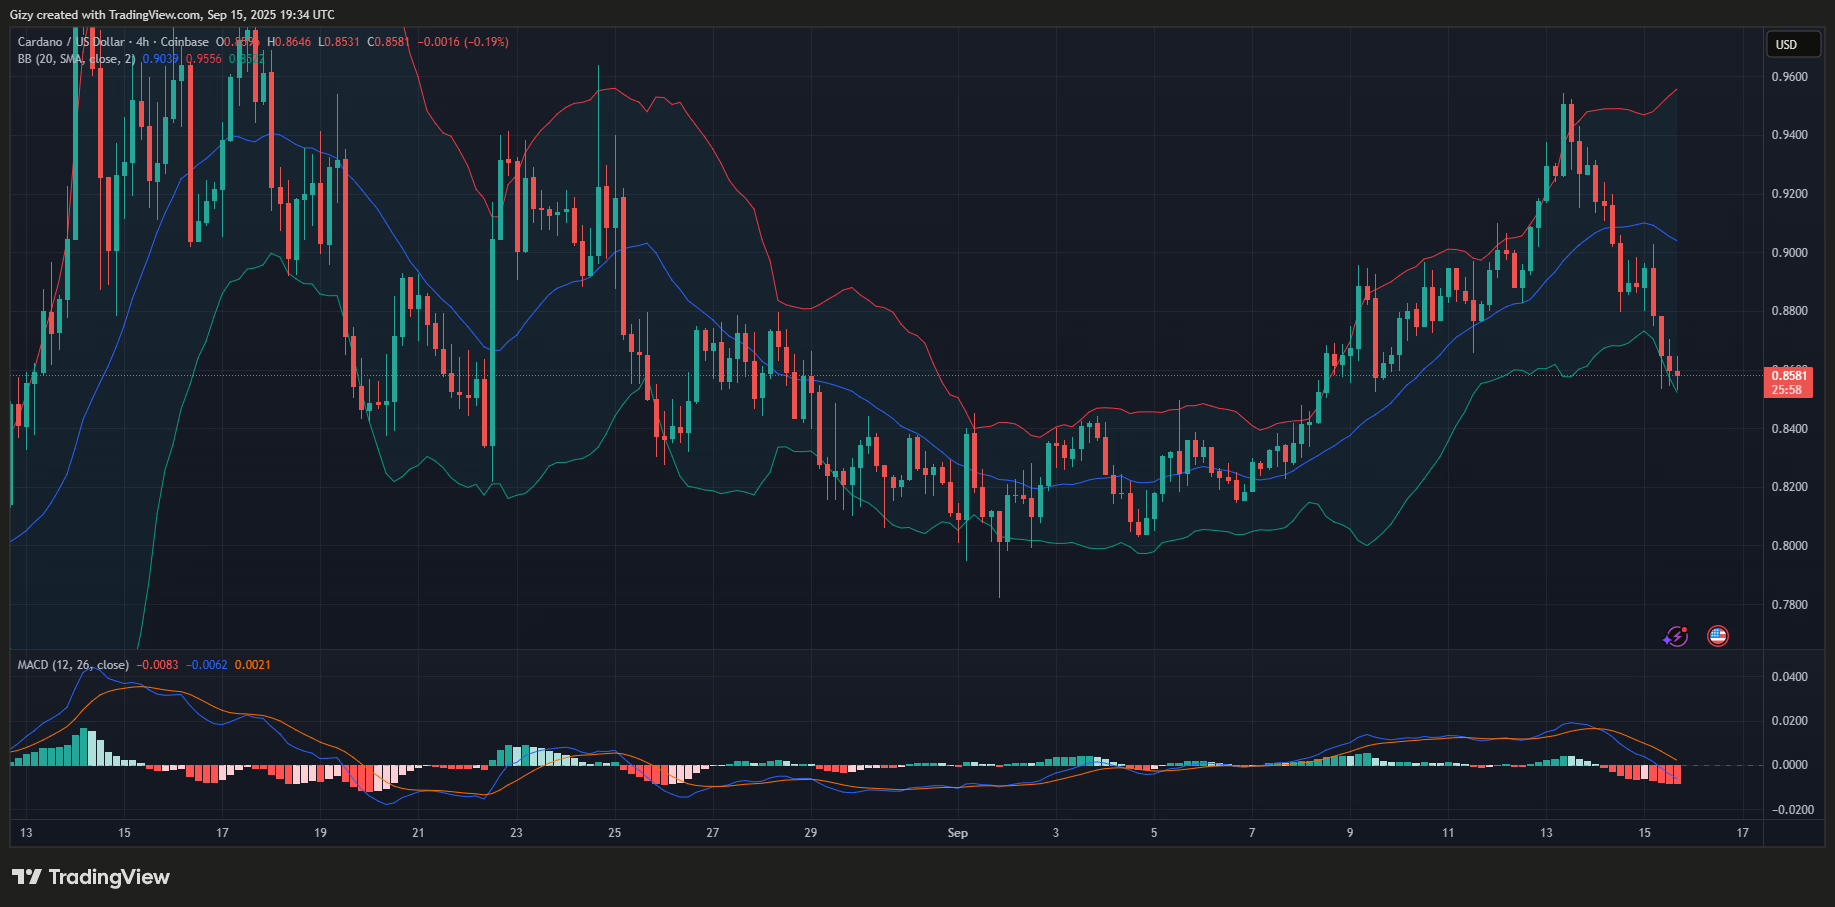
It’s currently printing a doji as it saw a small buyback but lost momentum. Nonetheless, the altcoin is trading at bollinger’s lower band, hinting at a possible rebound and surge to reclaim lost levels. The indicators point to a return to $0.90 if the uptrend resumes.
However, other metrics, such as the moving average convergence divergence and the relative strength index, are yet to flip bullish.