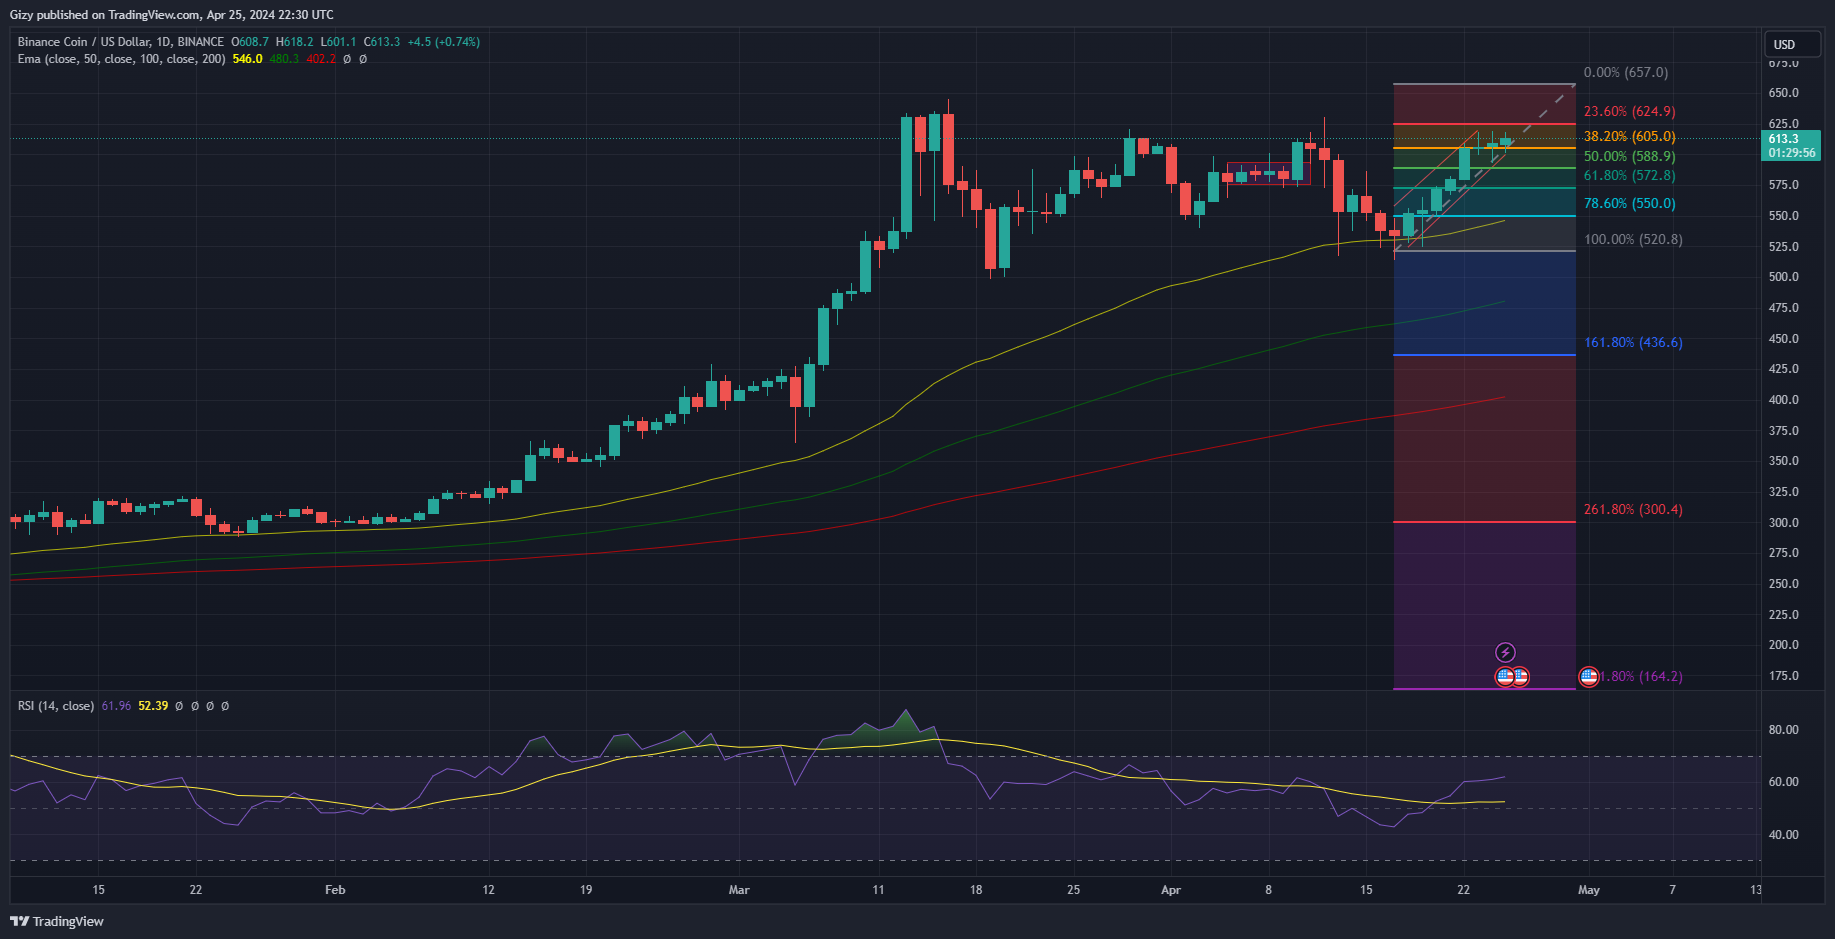
BNB is up by barely 2% today. The small increases are an improvement over the previous intraday session, which saw the asset fail to register any significant gains. Nonetheless, it peaked higher than it did today.
Price action over the last three days shows that the bulls are slowly getting exhausted. Since surging above $600, the asset has gradually lost momentum. A clear indication of this is the slight decrease in candle body size as the coin struggles to continue its surges.
BNB also saw a notable decrease in trading volume as traders’ interest dropped. Over the last 24 hours, the trading volume fell by over 3%.
The Relative Strength Index suggests that the coin is gradually decreasing buying pressure. The metric has also lost momentum and is trending almost parallel, barely maintaining its uptrend.
In response, BNB is printing a fresh pattern. Over the last three days, the coin peaked at $618, $619, and $618, respectively. The peaks demonstrate the asset’s inability to break the $620 resistance following several attempts.
Is BNB Due for Correction?
Following the grinding struggle for dominance between the bears and the bulls, calls for corrections are resounding. The calls comes after the ongoing trend of retracing after testing $620.

The moving average convergence divergence suggests this may not happen as the bullish divergence is still underway. The 12-day EMA is also on the uptrend with no signs of halting or changing its trajectory. Also, prices are still trending above the 100-day EMA, which means the coin maintains its bullish posture.
However, a bear flag has formed due to the most recent uptrend. Traditionally, following a bear flag is a notable price decline. Another failed attempt at $620 may trigger the effect of this chart pattern.
If this happens, BNB will experience a notable dip. Fibonacci retracement suggests a possible hike to $622 before correction.
The bulls will look to defend the 50% Fib at $579. Based on previous price performance, this level is a challenging support. However, a slip will send BNB trading as low as 61% Fib at $563.
