
Humanity Protocol was hit by a devastating exploit on June 8. Traders remain cautious as it continues to grapple with the incident’s effects.
The attack, which took place on Monday, saw hackers mint around 300 million $H, worth $216 million at the time. Before minting began, they drained 141 million units from the ETH contract. The effect: prices plummeted 86% following the event. Before the massive decline, the asset tested its all-time high but met strong resistance.
Nonetheless, Humanity Protocol released its incident report. It stated that the hack was not due to a lapse in its infrastructure, but was due to human error. The attackers gained entry into key areas using legitimate keys and minted 300 million tokens afterward.
Diving deeper, the exploiters compromised the BSC contract to mint the massive figures they did. However, the project currently has 2.83 billion H in circulation. The additional minted makes up around 15% of the circulating supply, resulting in the massive decline.
In response to the incident, the project has not announced a comprehensive recovery plan. In its initial report, it claimed that it has contained the attack to the BSC chain, but that’s all it can do for now, as the hackers still maintain admin control over the contract.
What it means is that Humanity Protocol is yet to fully control the situation, and the threat actors can resume minting more tokens at any time.
What it Means for Humanity Protocol?
H is not out of the woods, as the hackers can mint more units. The project did not specify their actions regarding halting the transfer of the minted tokens, indicating that they could still be sold.
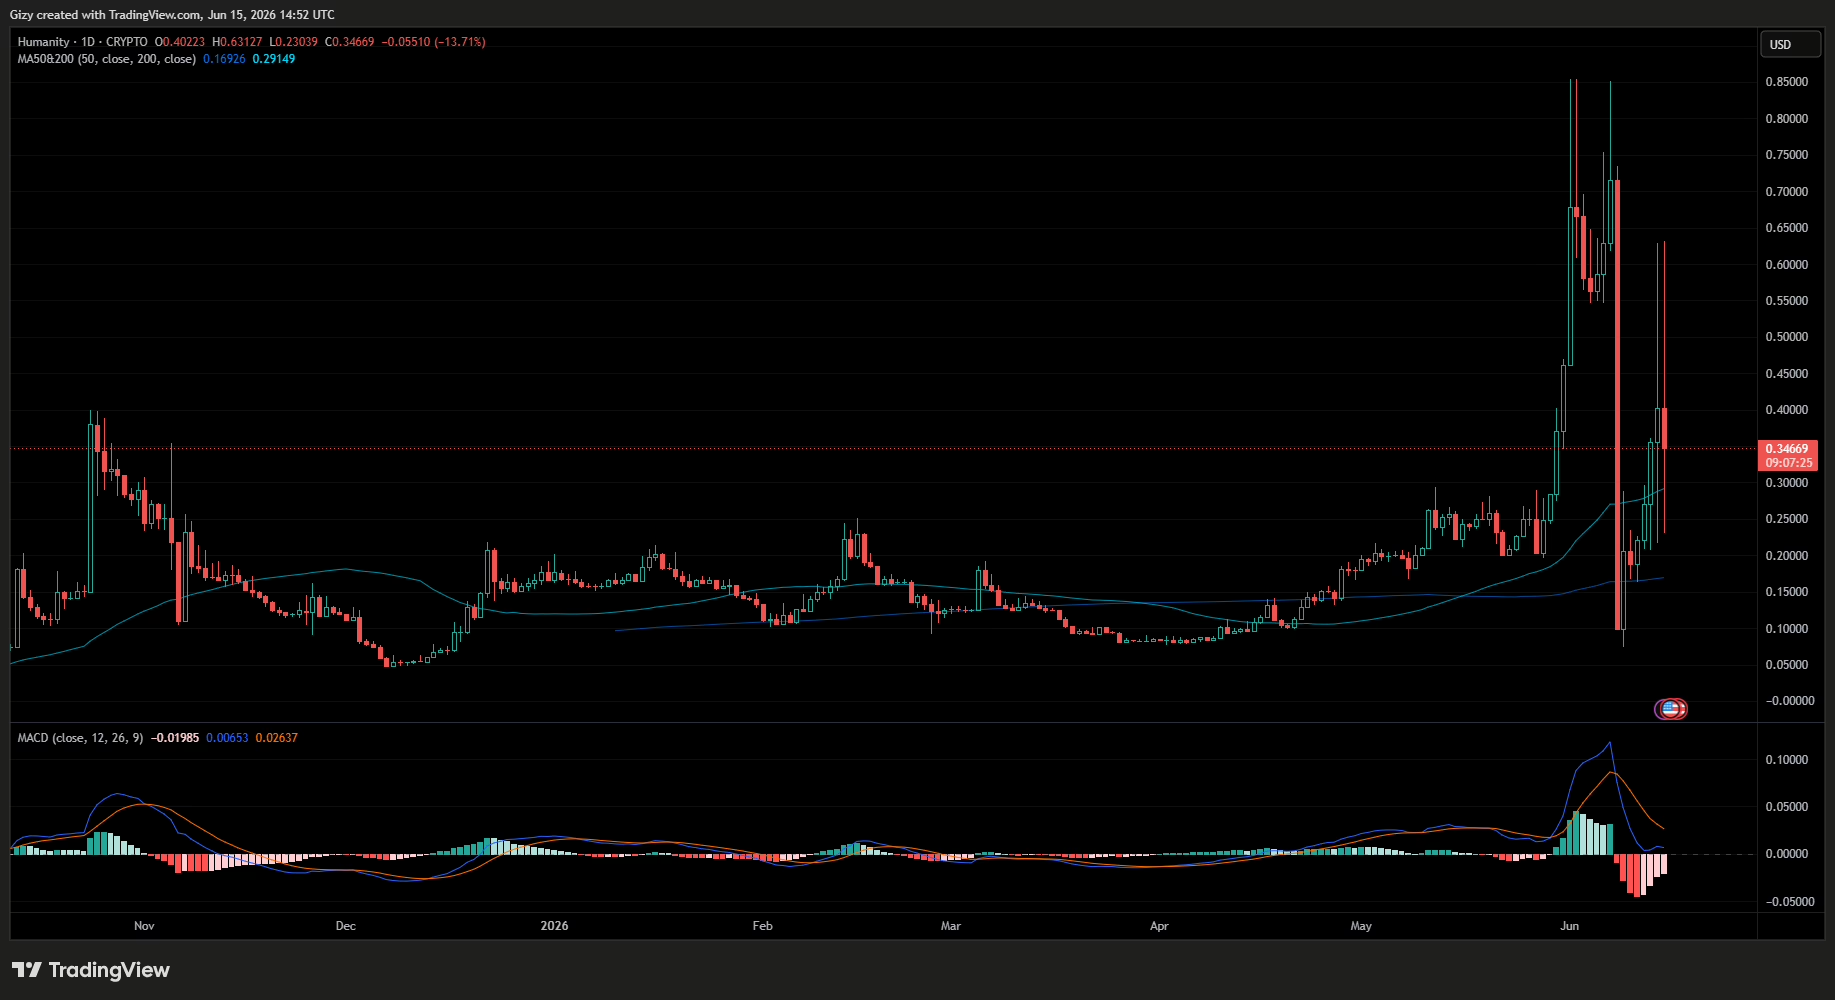
The altcoin dropped to a low of $0.099 on Tuesday. However, it trades at $0.25, over 250% higher than its low. With recovery underway, investors are slowly returning. Nonetheless, the uptrend has met several hurdles and is currently grappling with one at the time of writing.
H surged to a high of $0.29 on Friday, but retraced on Saturday, dropping to a low of $0.20. It has since rebounded and has shed most of the losses. On closer inspection, the rejection during the previous intraday session was not a random event.
For most of May, the asset struggled to break above $0.30. It finally broke out on the 30th, resulting in the surge to the new all-time high. Traders expected the selling pressure around the mark to dissolve following the ATH.
That may be the case as the top asset broke above it after several days of trending below it. On Sunday, it surged to a high of $0.63, but retraced. It tested the mark again on Monday, resulting in another rejection.
While investors are becoming optimistic, the growing suspense regarding the hackers’ next move may be a factor to consider. Being able to print more tokens at any time means they have a massive chokehold on prices and the entire project.
As of Monday, Humanity Protocol is still yet to release a comprehensive plan toward breaking the attackers’ grip. Nonetheless, its last report on the incident noted that North Korean threat actors were responsible for the exploit.
Will Humanity Protocol Beat the Odds?
Given the recent price spike, a return to its all-time high may happen this week. However, a sustained uptrend over an extended period is not likely.
If the situation around the exploit remains at a standstill (like it currently is), the token risks a massive decline after a massive uptick. It means the pump and dump like that seen in the last 48 hours may be a regular occurrence.
In a nutshell, H may see further increases in the coming days, but it may be short-lived. Additionally, the likelihood of returning to its ATH this week is high.
Away from fundamentals, the price chart prints positive signals at the time of writing. For example, the moving average convergence divergence shows the gap between the 12 and 26 EMA narrowing. A bullish crossover is likely in the coming days, heralding further increases.
Additionally, the asset has progressively posted higher lows over the last two days. If it maintains its current low, it would have sustained the trend for the third day. The trend indicates that amid the sharp price movements, H still maintains an upward structure.
Amid the price movement, it also had its first close above its 200 MA on Sunday. It is currently trading above the metric. Interestingly, the asset had a sustained uptrend the last time it broke above it. If the trend repeats, it may be heading for another bullish period.
1-Week Indicates H Bottomed
The 1-week chart suggests that H has reached its lowest level this year. Looking back at previous price movement indicates that the altcoin has a pattern of testing its low only twice. For example, in 2025, it tested $0.023 and edged closer to it a few weeks ago.
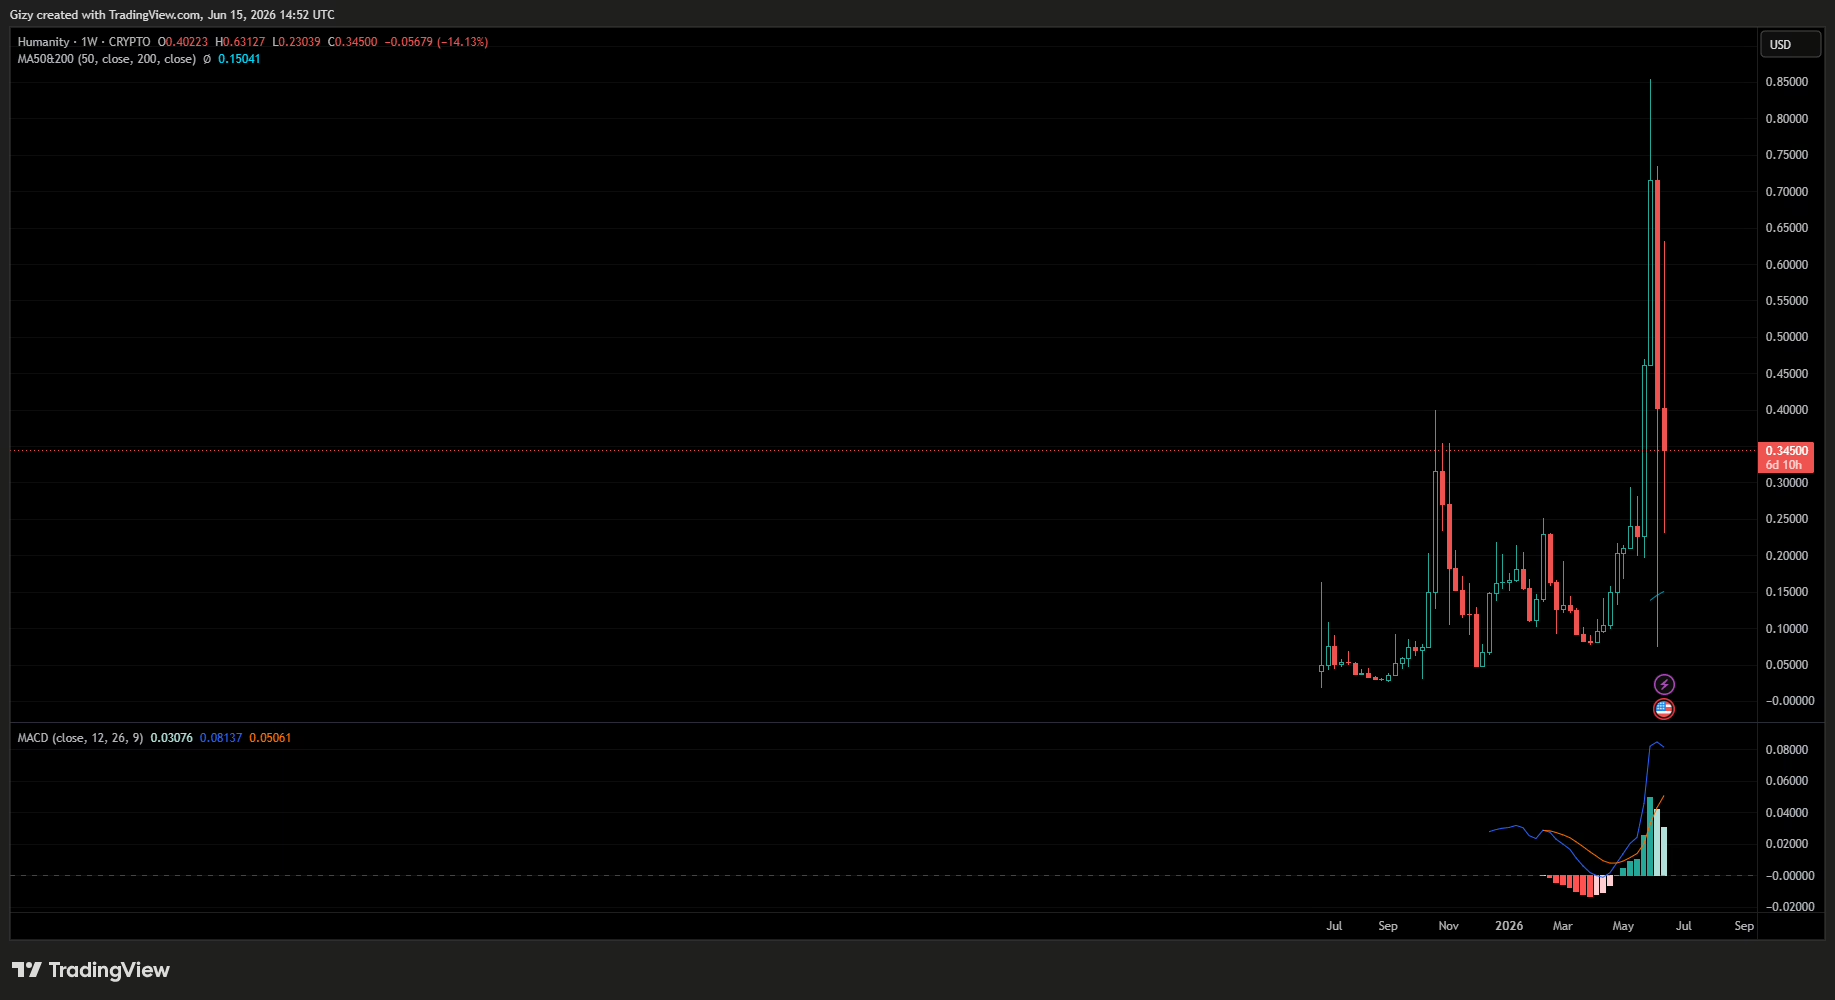
Since the retest, it only tested new lows once. However, the correction last week saw it drop below its latest low at $0.75. Given the previous trend of testing its low twice, the asset may not retrace to this level again.
Nonetheless, the relative strength index suggests room for further decline. The metric rebounded around 44 during the previous downtrend. If the pattern repeats, the altcoin will see further corrections in the coming weeks.
In summary, the 1-day chart shows notable bullish signals that may indicate further increases. The 1-week chart also suggests that the asset has bottomed and will not drop lower than it did a few days ago. However, the risk of further decline remains significant. Fundamentals also indicate that the asset is not out of danger.


