
XRP is grappling with significant selling pressure and is off to a bearish start on Tuesday. It remains to be seen how the rest of the day will play out.
Nonetheless, trading action during the previous intraday session casts a dark foreboding. XRP is edging closer to completely erasing Monday’s gains.
Away from the altcoin, investors are fixated on the next rate decision. However, the reaction trailing it is minimal compared to previous events. The market is acting indifferent or waiting for the exact announcement. The behavior may stem from the cautious approach to trading since the downtrend started in October.
The crypto market continues experiencing significant volume amid reduced volatility. Volume surged by over 50% in the last 24 hours as traders’ confidence slightly improved. The fear-and-greed index rose by 1 point from its previous reading.
One of the assets receiving the most volume is ZEC. It opened Monday at $343 and peaked at $424. The altcoin experienced an 85% increase in trading volume and ended the session with gains exceeding 18%. It attempted the previous high a few hours ago and is gearing up for a flip at the time of writing.
The chance of a flip remains highly speculative, as Tuesday’s price action was mostly bearish. The trend affects the entire market. Nonetheless, fundamentals may begin to take effect in the coming hours. Let’s see how prices may play out in the coming days.
BTC/USD
Bitcoin sank slightly deeper than Monday’s low a few hours ago. It prints a red candle on the 1-day chart as it grapples with minute selling pressure that is threatening to intensify.
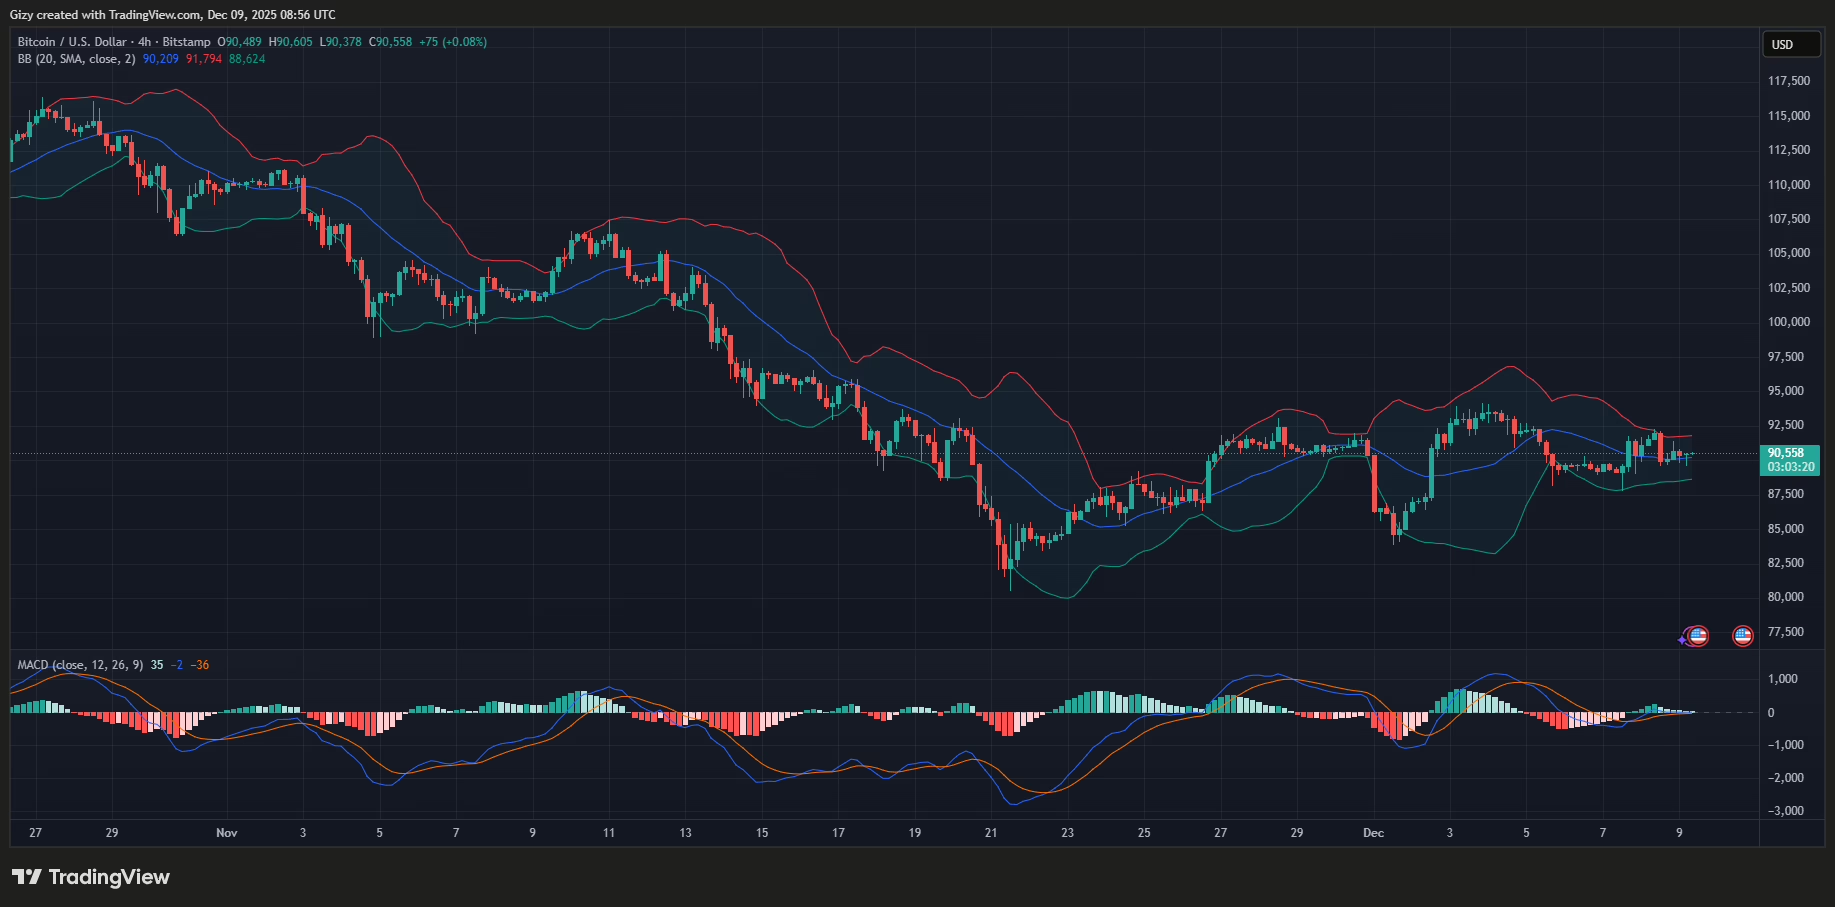
The apex coin failed to register any notable price change during the previous intraday session. It ended the day with a doji as selling and buying pressure were almost equal. The low upward momentum is spilling into Tuesday, as seen in the price.
As a result, several indicators on the 4-hour are flipping bearish. BTC is currently trading at bollinger’s middle band and has since struggled after a slight breakout from the bands.
If the current trend persists, the apex coin will retrace below $88k in the coming hours. Readings from the moving average convergence divergence carry the same dark tidings: a bearish crossover is imminent.
Conversely, the apex may surge, breaking above $94k in the coming days.
ETH/USD
Ethereum is experiencing the same bearish start to the session as the rest of the market. Nonetheless, the asset had a strong start to the week, peaking at $3,180 on Monday and posting gains exceeding 2% in the session.
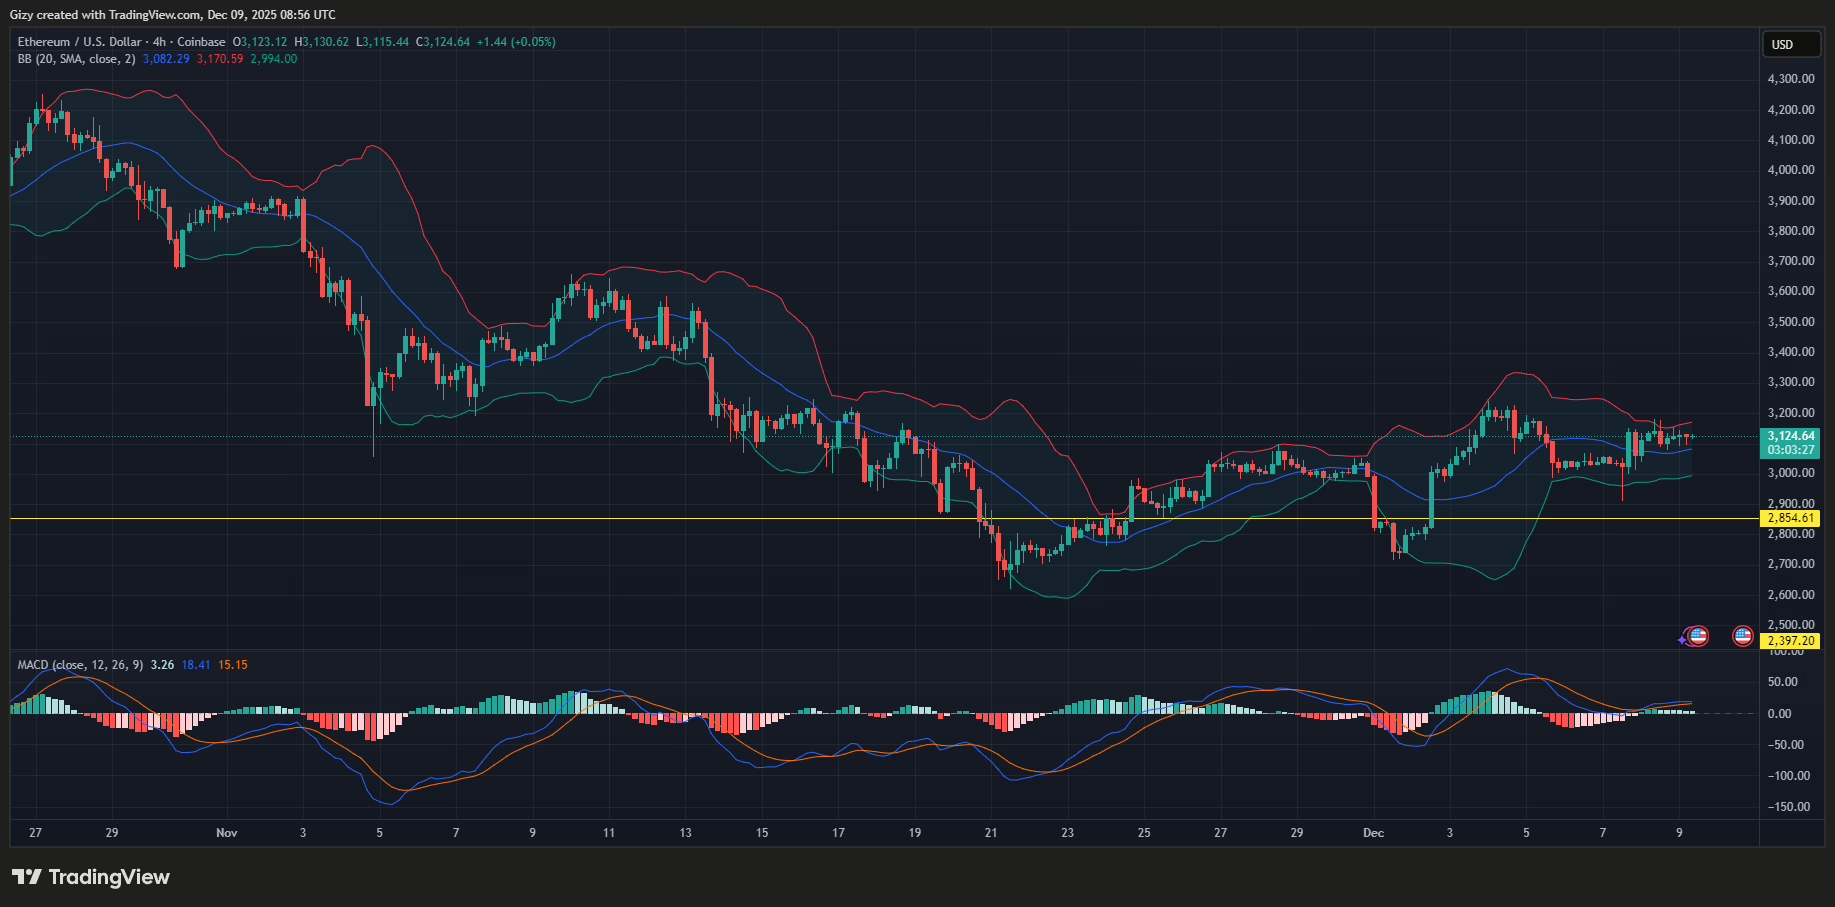
However, the altcoin ended the previous intraday session with the upward momentum waning. As a result, it is struggling to continue its uptrend at the time of writing.
On the 4-hour chart, ETH prints a red candle, depicting a drop to $3,095. The coin currently trades higher as recovery continues. A closer look at the chart shows that the asset has been trending between bollinger’s upper and middle bands.
The movement shows significant bullish dominance, and a breakout is imminent. Current MACD readings suggest a downward trend, as a negative crossover is imminent. Ethereum may retrace below $3k.
Conversely, the altcoin could break out, flipping $3,300 in the coming days.
XRP/USD
XRP is recovering from a slight decline a few hours ago. It has grappled with notable selling pressure in the last few days, since Monday, but may be heading for a breakout in the coming hours.
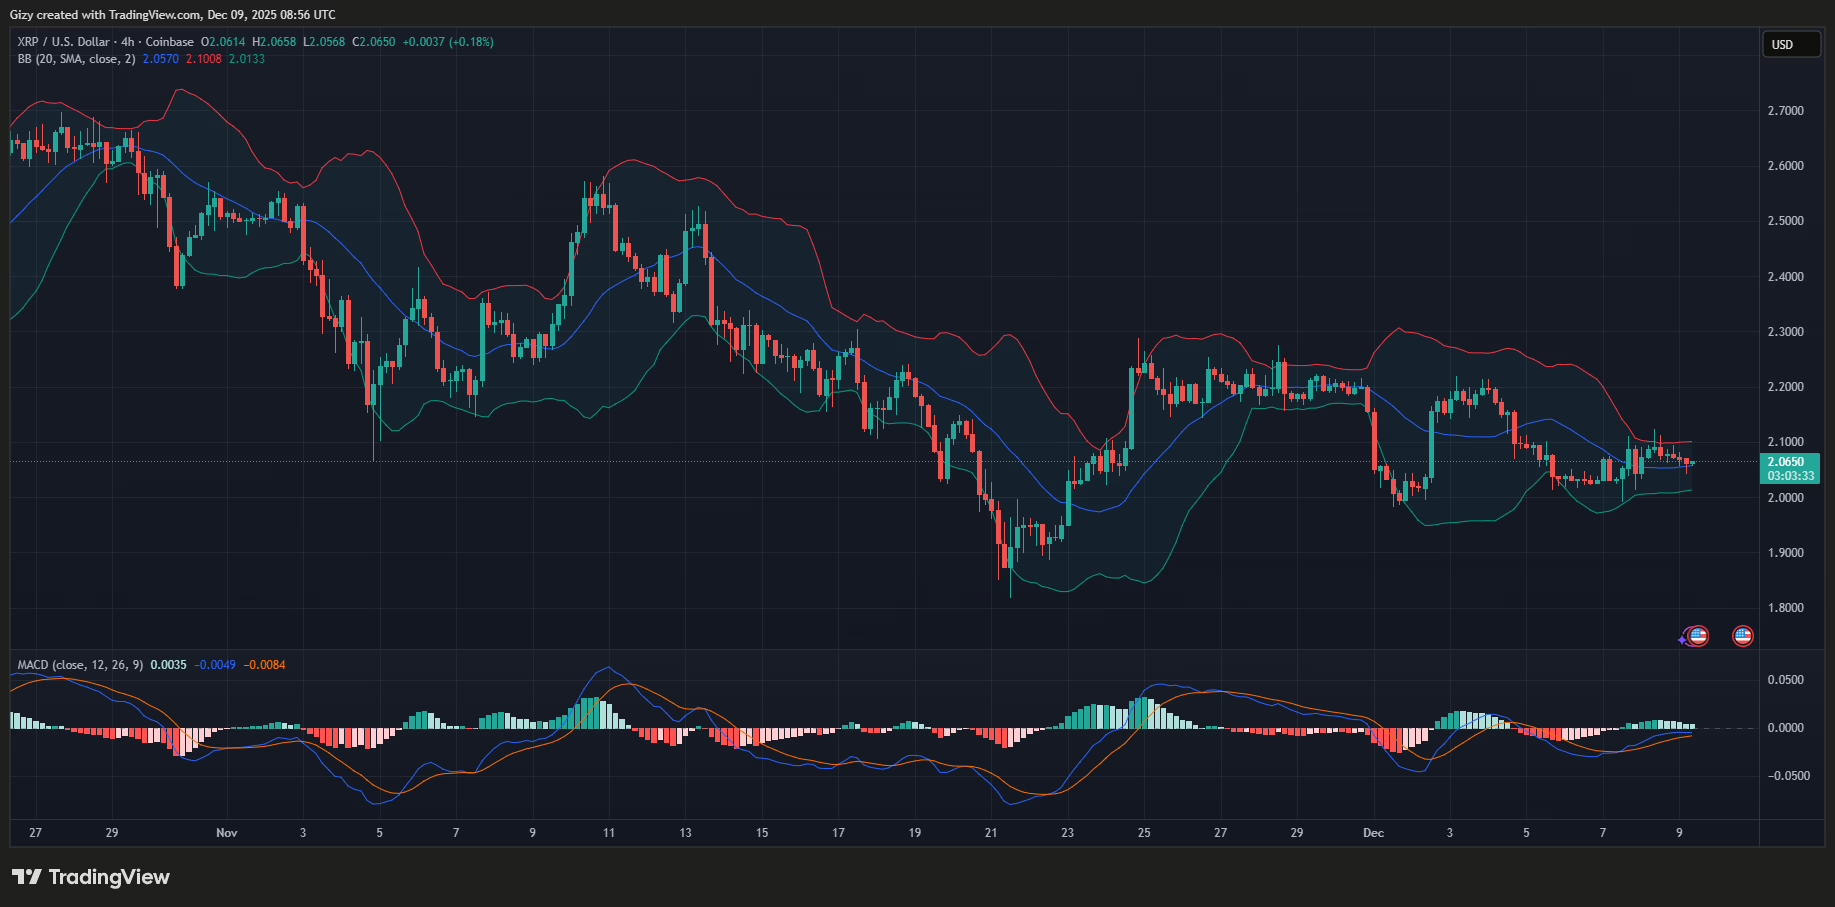
The 4-hour chart shows the asset trading at $2.05. However, indicators remain largely negative amid the rebound. The moving average convergence divergence displays an ongoing bearish convergence that may signal further declines. Additionally, RSI remains in the downtrend.
XRP will slip below $2 if the current trend persists. Nonetheless, fundamentals may take effect, sending prices above $2.20 within the next 48 hours.
BNB/USD
The 1-day chart depicts several small candles over the last three days. BNB has consolidated during this period and failed to break out of the trend on Monday.
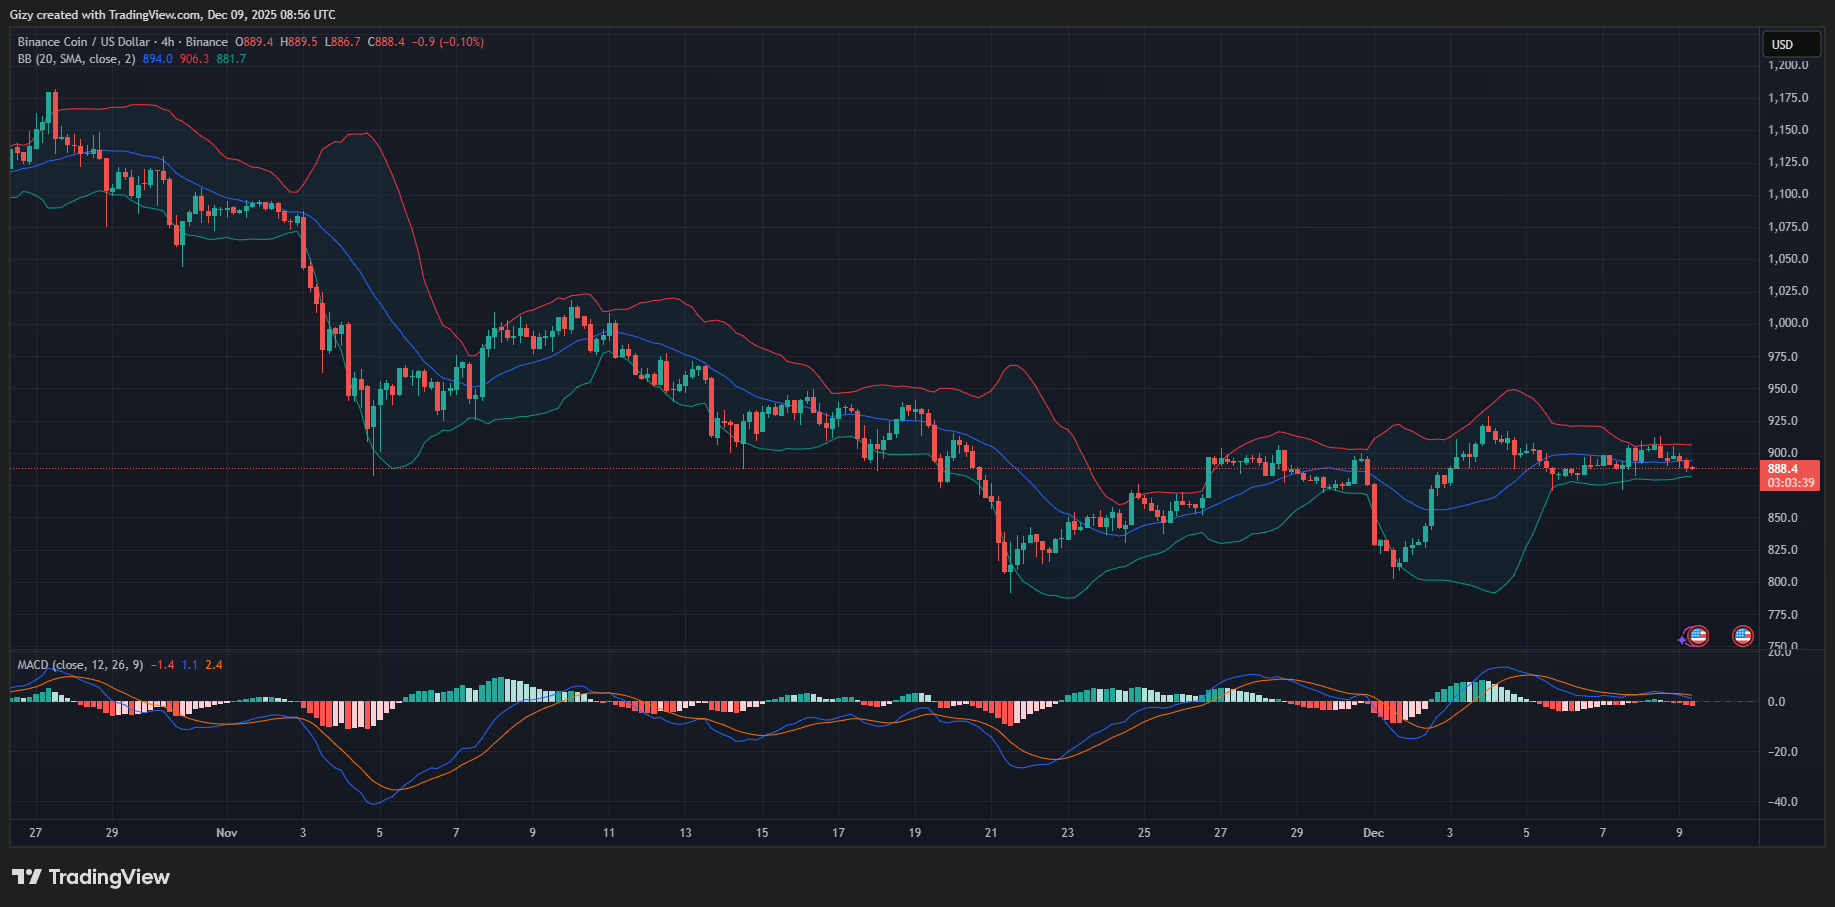
The asset slipped below $884 a few hours ago, below its previous day’s low. The 4-hour chart shows that the asset rebounded, but indicators remain indifferent. For example, MACD had a bearish divergence a few hours ago.
BNB also slipped below the bollinger’s middle band. Its next price target may be the lower line at $880. Further decline may result in a slip below $870. On the other hand, the asset may break above $920 if recovery continues.
SOL/USD
Solana had a rocky start as XRP. It slipped to a low of $131 a few hours ago before rebounding. The asset continued the downward momentum from the previous day, which saw it retrace from a high of $139 and end the day with no notable improvement.
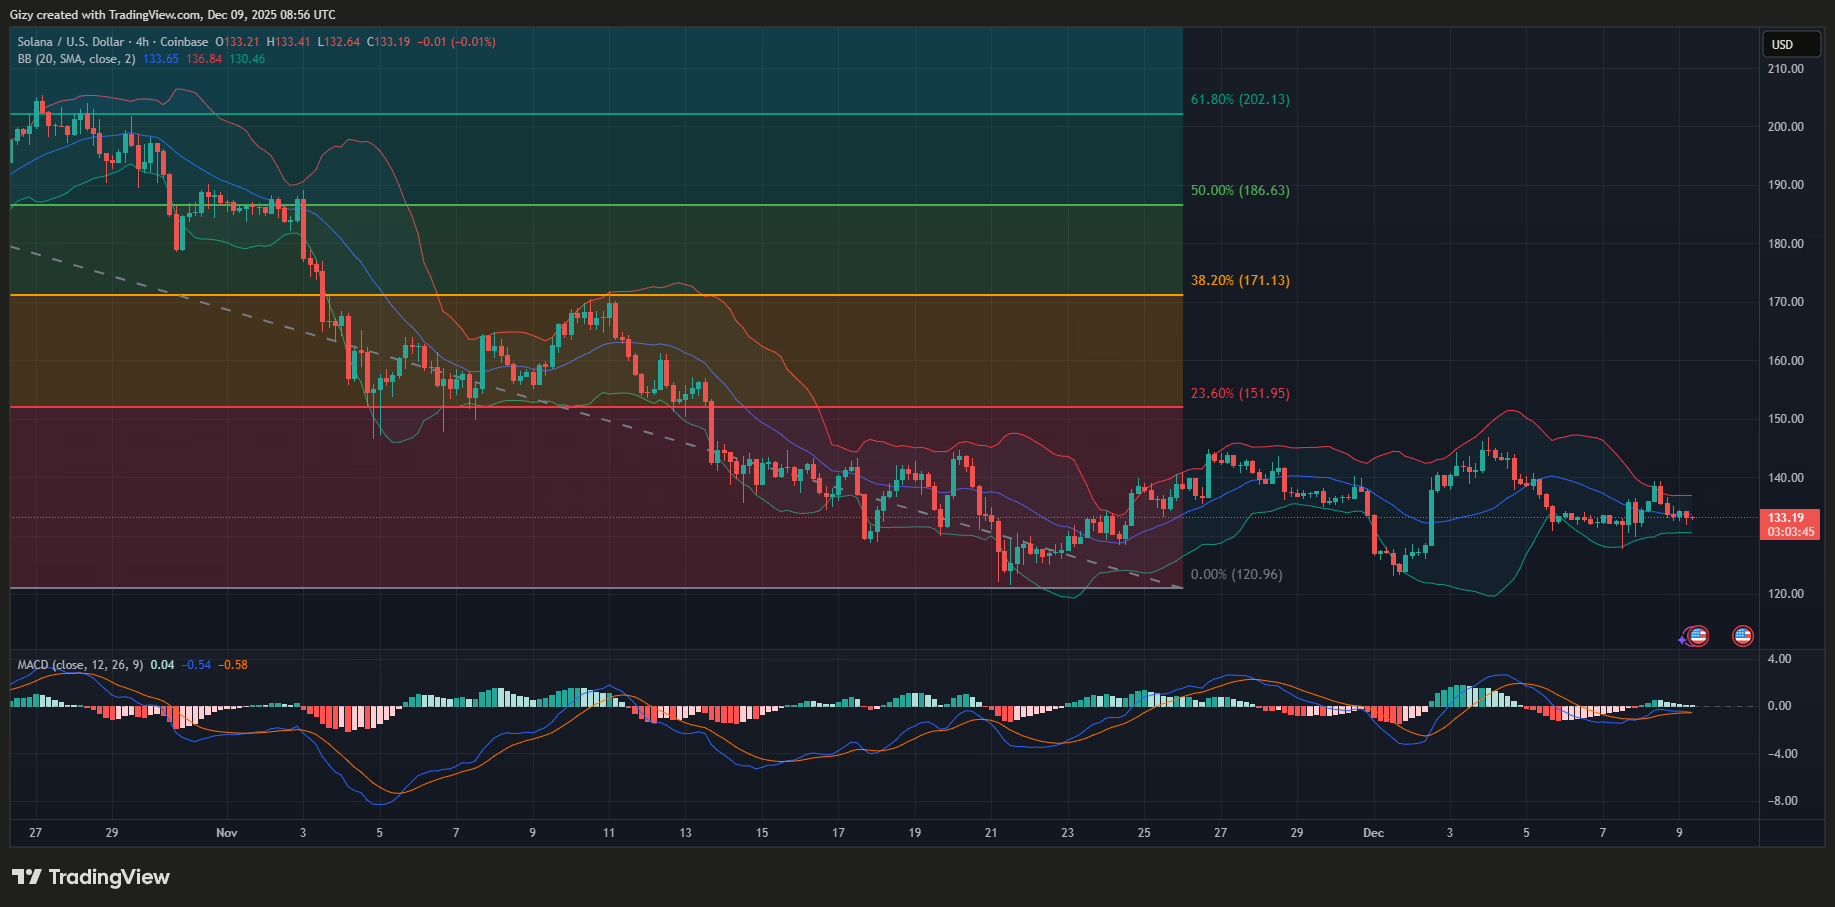
Nonetheless, indicators on the 4-hour chart suggest that the recovery may be short-lived. One such is MACD, which displays a near-complete negative crossover. The asset also slipped below bollinger’s middle band and is currently trading below it.
SOL must maintain $131 support or risk slipping below $125. However, a further uptrend will see the altcoin break above $144.
DOGE/USD
Dogecoin is trading 2% lower than its Tuesday opening price. Current prices indicate a reversal of the previous day’s trend, which resulted in a 3% surge.
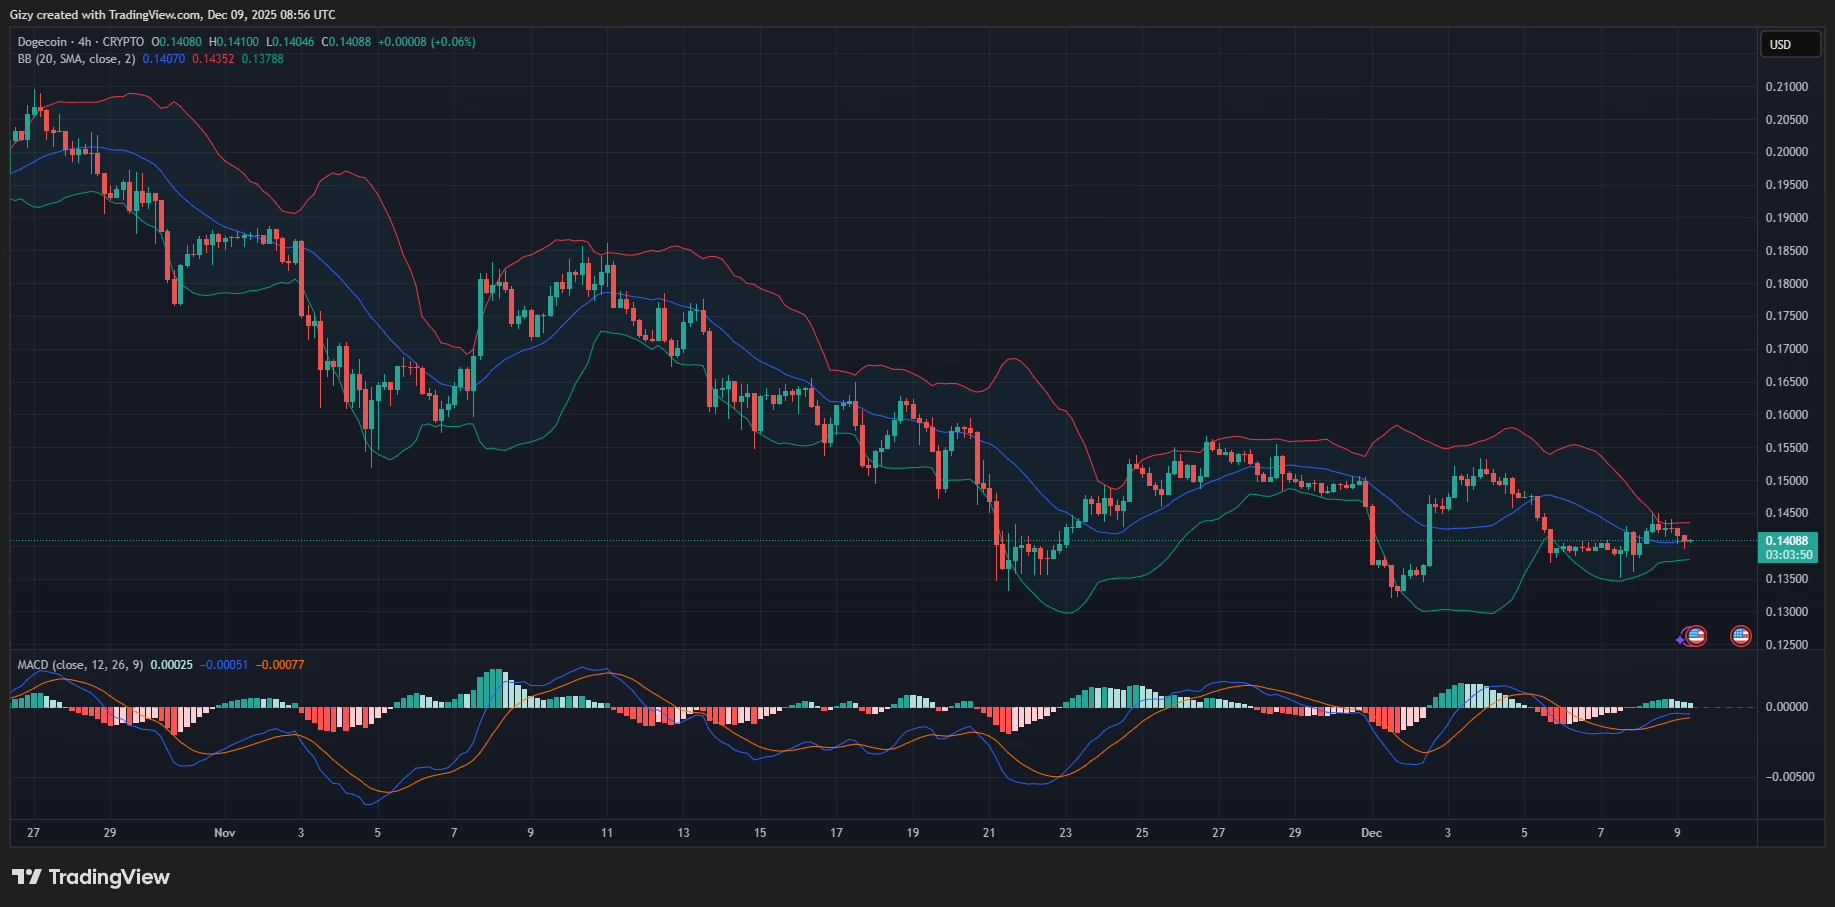
The asset retraced to a low of $0.140 a few hours ago, but has since rebounded. The current candle suggests that selling pressure is gradually easing, and the coin may surge higher. If this holds, DOGE will break above $0.145.
However, as with XRP, indicators are currently negative. Aside from the bearish MACD, the bollinger bands showed that the asset broke out on Monday. The ongoing decline is in response to the event, and the coin may slip lower, dropping as low as $0.135.
ADA/USD
The 4-hour chart reveals that Cardano has been in a downtrend since the session started at 16:00 UTC on Monday. It has since failed to print any green candles as the decline continued.
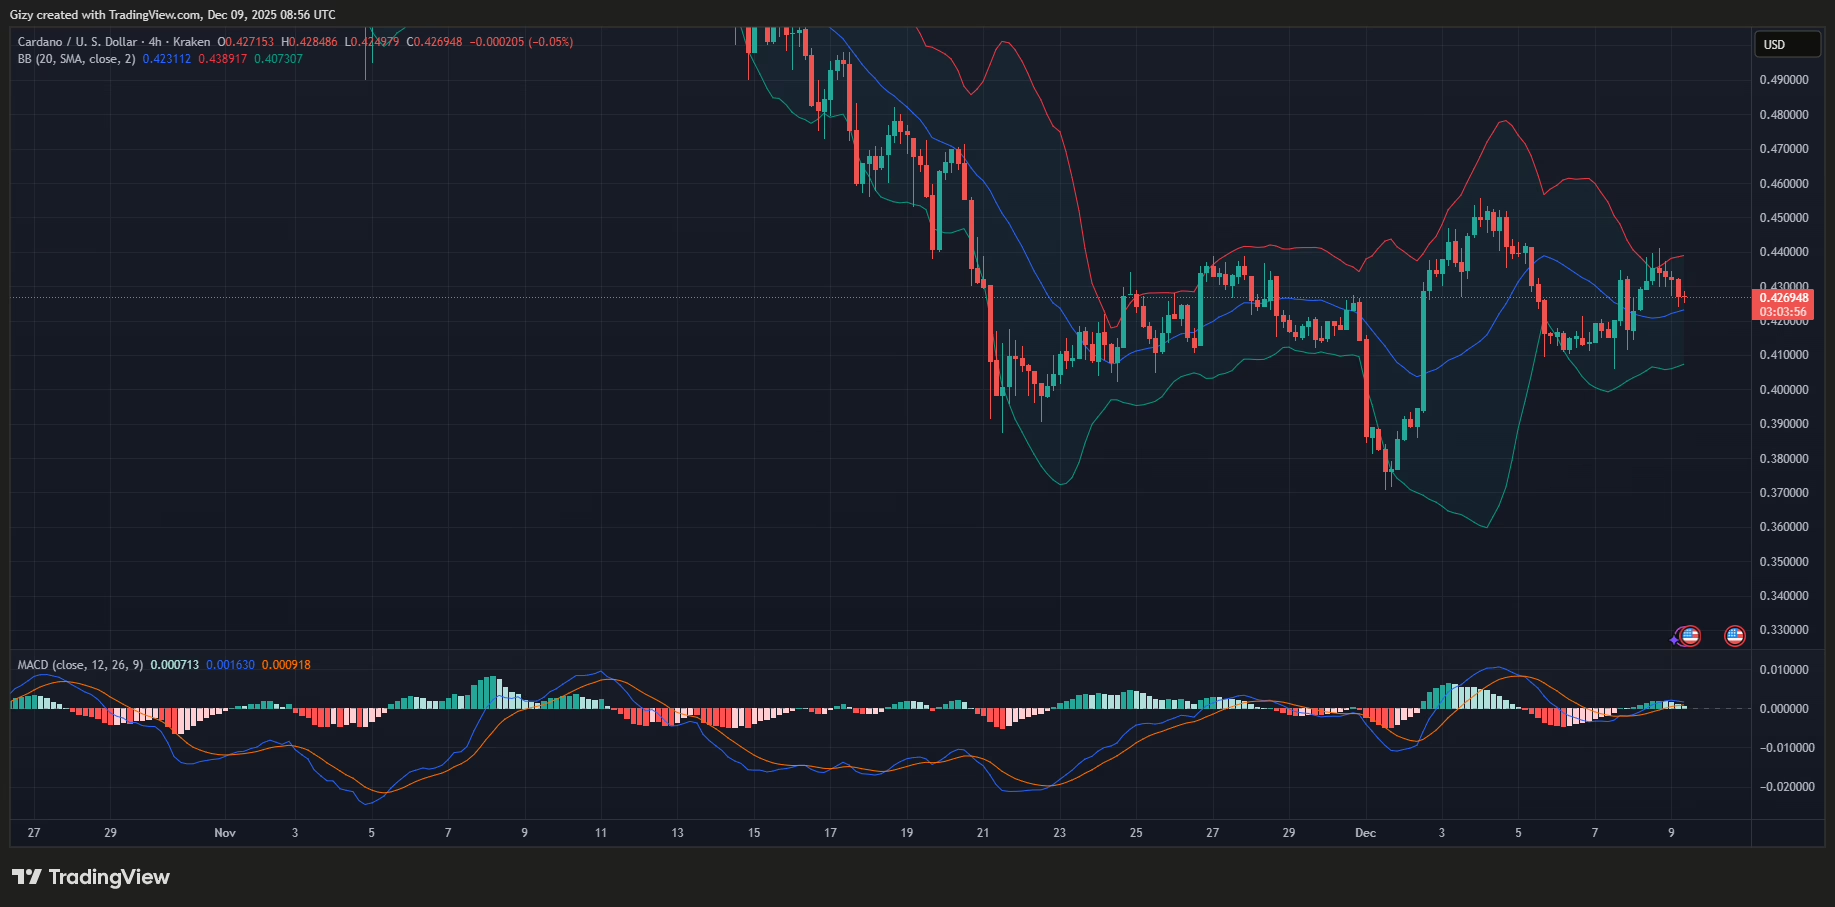
However, the candles suggest the downtrend is gradually waning. A closer look at the chart shows that the asset has registered progressively deeper lows. Currently, the new candle has not continued the trend.
However, like on XRP, indicators are currently negative. Aside from the bearish MACD, the bollinger bands showed that the asset broke out on Monday. The metrics hint at a drop below $0.40.


