
ETH attempted to break a key level a few days ago but has since failed to do so. It experienced slight corrections afterward. However, it hasn’t strayed far from its high, suggesting that the bulls may be gearing up for another push.
The altcoin experienced notable price gains on Tuesday, up over 7%. It saw a significant inflow following the announcement of the reduced CPI.
Nonetheless, ETH was not the only recipient of this liquidity influx. The global cryptocurrency market cap peaked at $3.24 trillion, gaining over 4%. The uptick continued into the next day, pushing valuations above $3.29 trillion.
A sweep through the top 10 shows that several altcoins saw massive increases during this period. For example, DASH surged from $39.2 to a high of $69.9. It retraced following the rejection at $70 but posted gains of more than 40%.
Price action on Tuesday and Wednesday was unsurprising, as an outlook noted that while several assets printed red candles on Monday, the economic data releases could alter their trajectory.
However, a recent event could affect price action on Monday. US President Donald Trump recently announced the possibility of fresh tariffs on EU countries over Greenland. While it’s only a threat, there are speculations that the extra levies may begin next week.
If Trump announces the extra tax, the crypto market will plummet in response. Depending on when the announcement comes, investors are currently cautious about the next price action.
BTC/USD
Bitcoin is poised to end the week with gains of more than 5% if it closes at its current price. The 1-day chart shows the asset had a strong run over the last 6 days, breaking above key resistance.
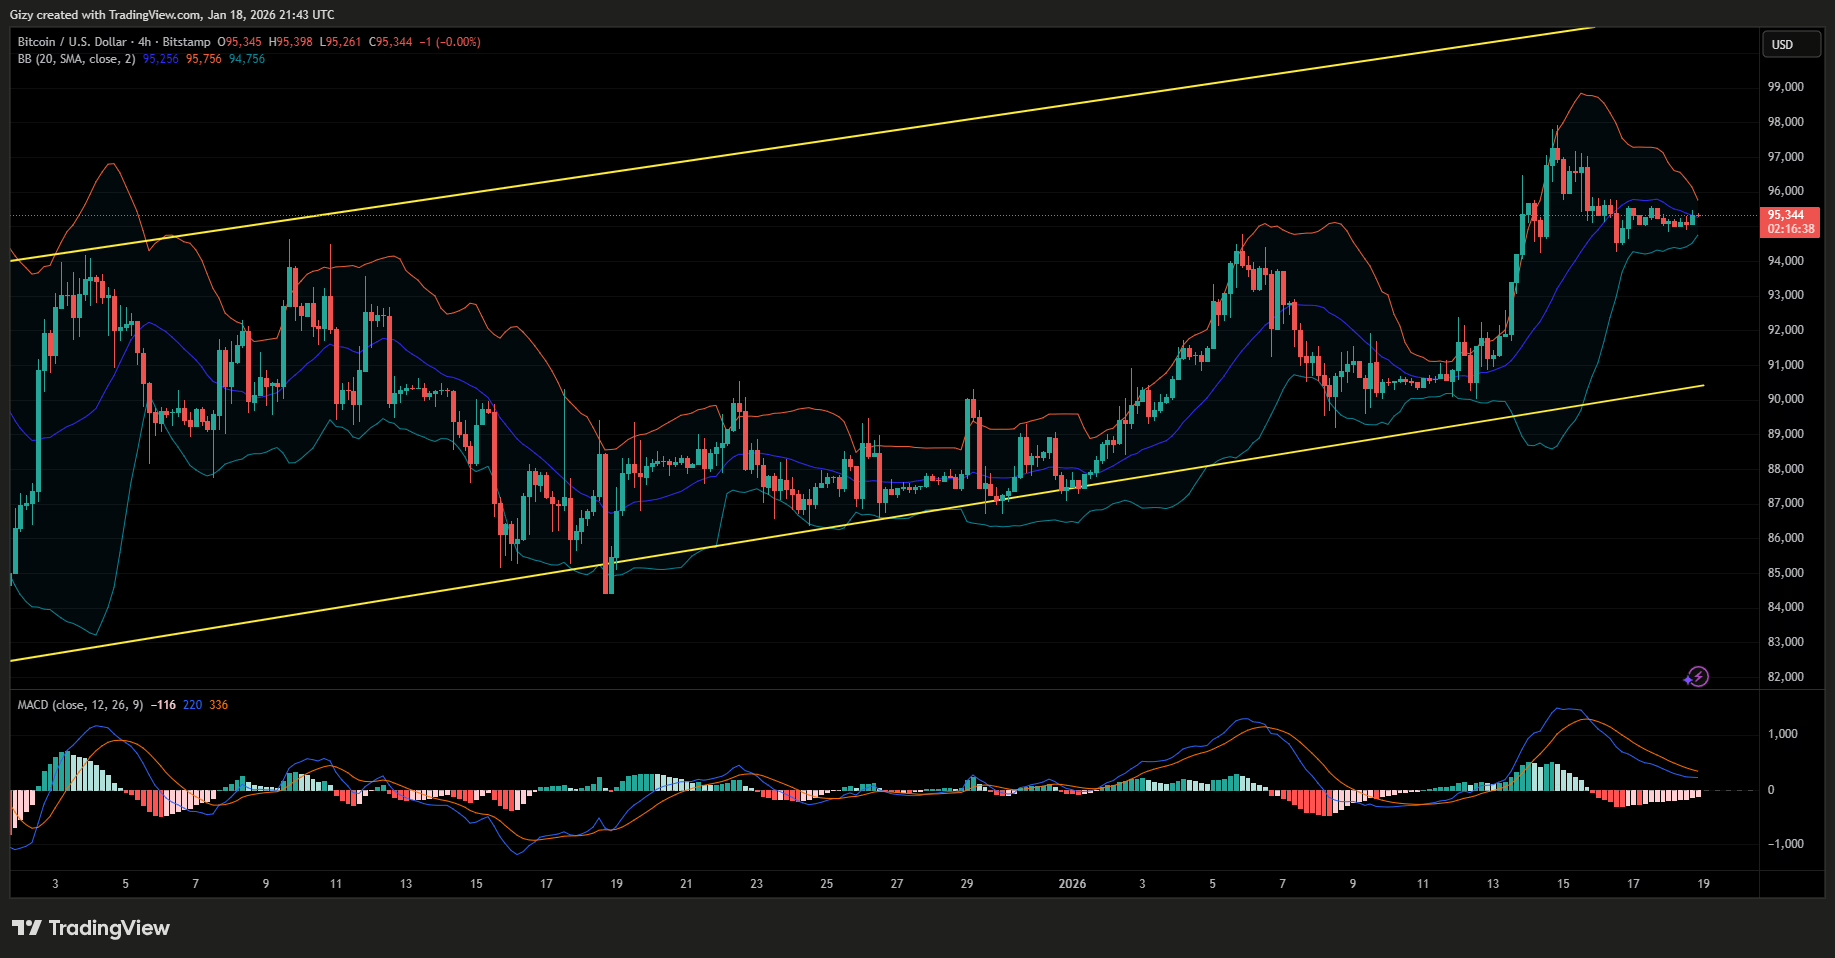
One of the biggest highlights of the seven-day period was Tuesday, when it broke above $95k. It experienced significant rejections below the barrier since Nov 18, but finally flipped it and peaked at $96,474.
Nonetheless, indicators on the 1-day chart depict bulls’ exhaustion, which could trigger notable selling pressure next week. On the 4-hour chart, the indicators tell a different story. For example, the asset is trading below bollinger’s lower band, and MACD had a negative crossover a few days ago.
The shorter-term chart suggests that BTC may surge over the next two days. If that happens, the apex coin will retest $97k. However, the surge may be short-lived as some metrics flipped bearish on the 1-day chart.
In either case, the 4-hour chart shows notable demand concentration at $94k. Losing the mark will confirm the downtrend and could lead to a potential drop to $90k.
ETH/USD
ETH is having its best performance since September. Currently up by over 7% over the last six days, it is edging closer to testing its two-month high.
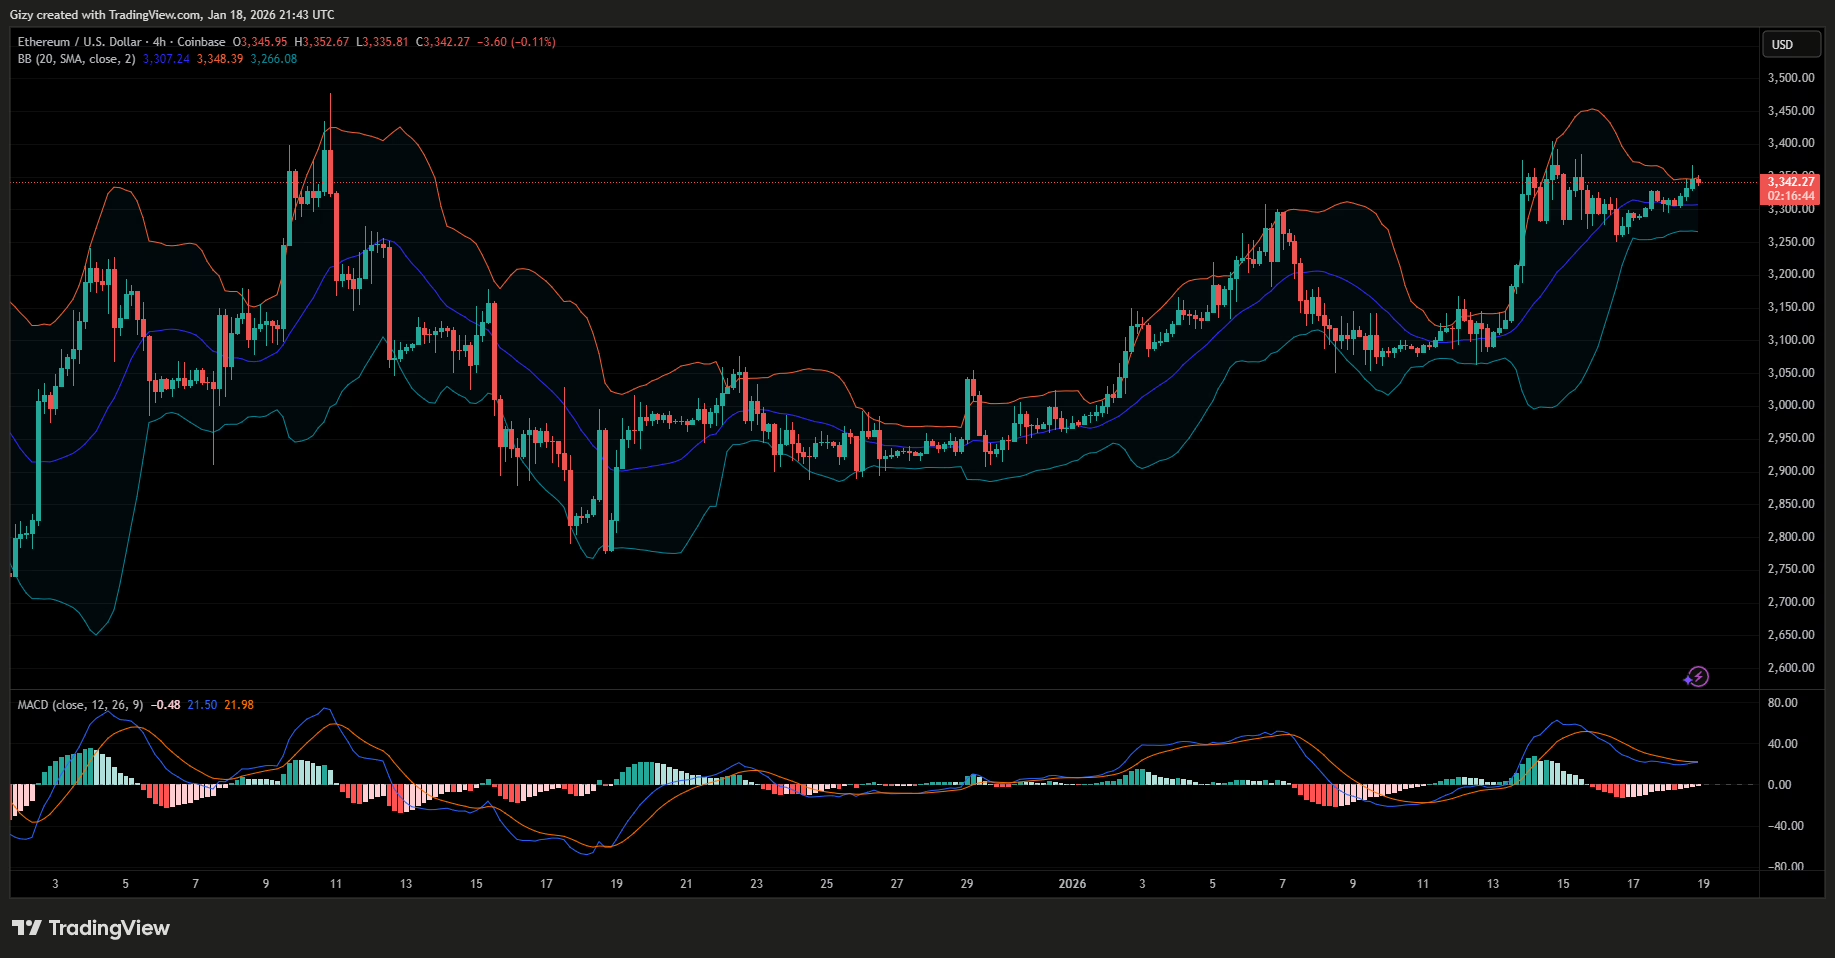
The 4-hour chart suggests it may retest the mark in the coming days, as the moving average convergence divergence shows buy signals. However, the bollinger bands offer a different reading. The asset broke above the metric a few minutes ago and currently trades above it.
According to the MACD, ETH will register significant gains on Monday. It may edge closer to $3,500 after breaking above $3,400.
Nonetheless, the bollinger bands readings raise concern. The 4-hour chart shows notable demand concentration at $3,280. Failure to defend the barrier will seal the downtrend and could lead to a possible drop below $3,100.
XRP/USD
XRP is trading at $2.05 and prints a doji on the 1-week chart, having erased Tuesday’s gains. The 1-day chart shows it was mostly bearish over the last six days, posting only one green day.
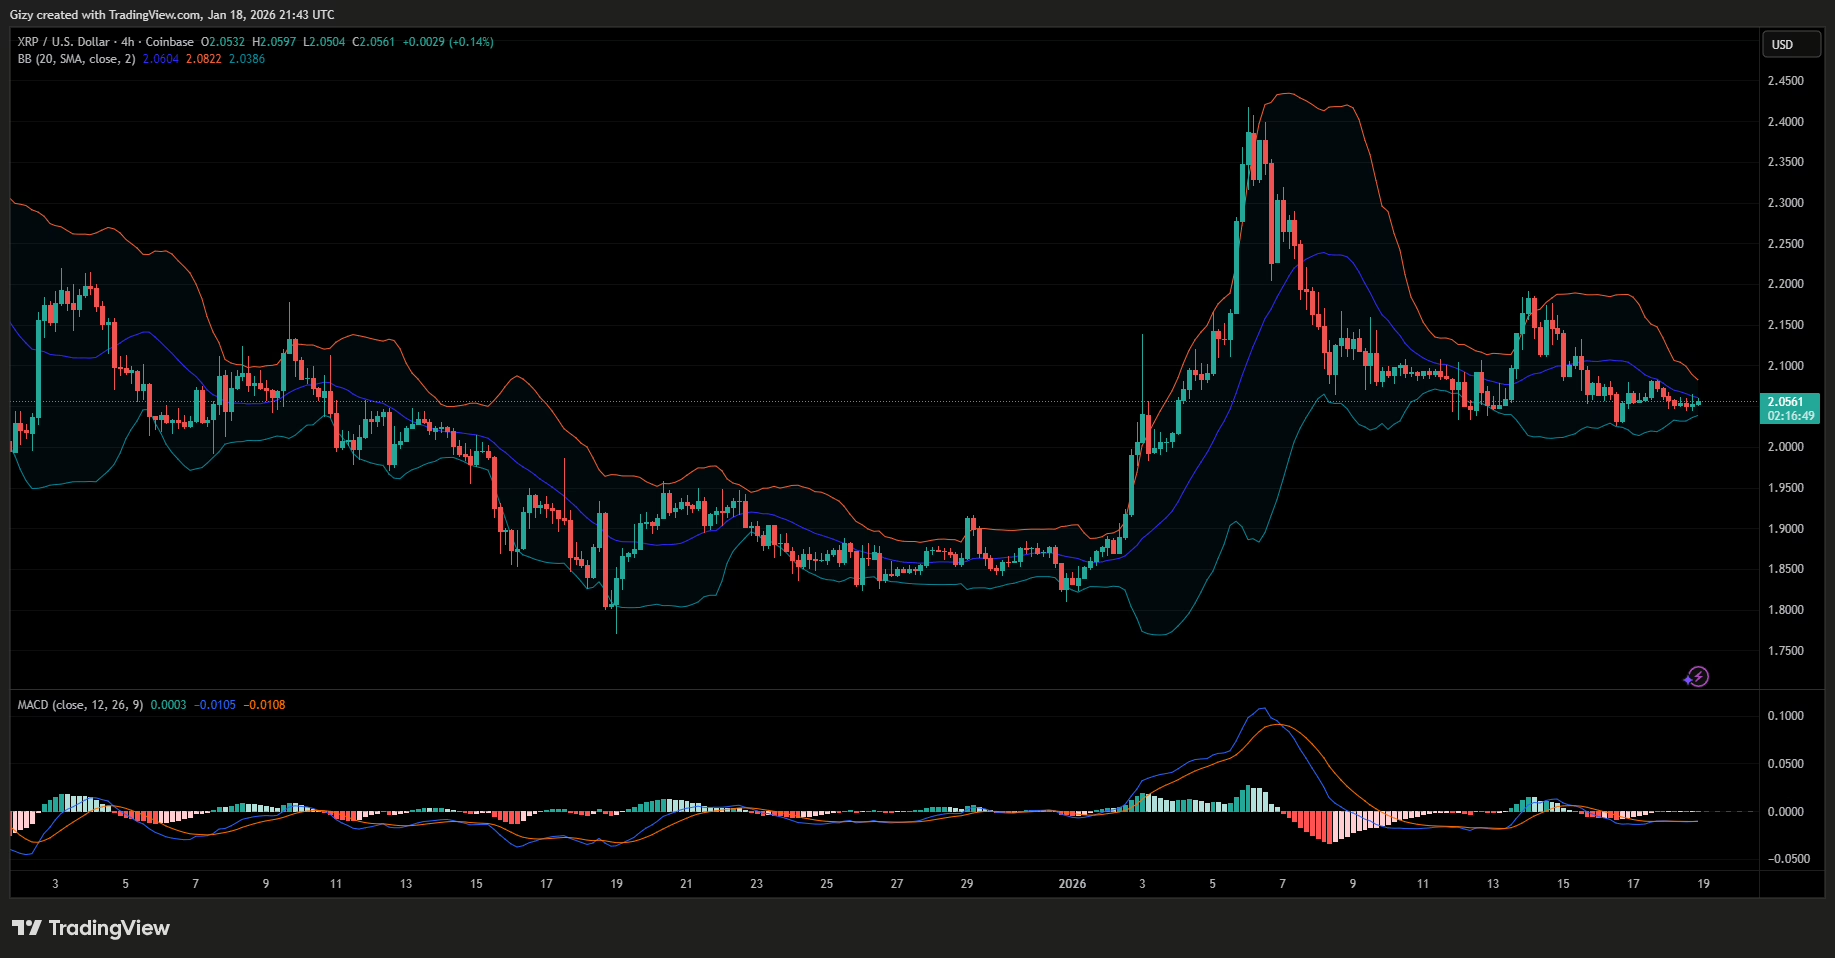
It has since been in decline, with reduced volatility. As a result, the bollinger bands on the 4-hour chart are constricting. The indicators suggest that a breakout is imminent and hint at an upside move. However, the MACD remains silent on the next price action.
Nonetheless, the chart shows notable demand concentration at $2.03. Losing the mark could trigger a drop to $1.90.
BNB/USD
Like ETH, BNB is set to close its best-performing week since October. It surged by over 5% in the last six days and peaked above its 40-day high.
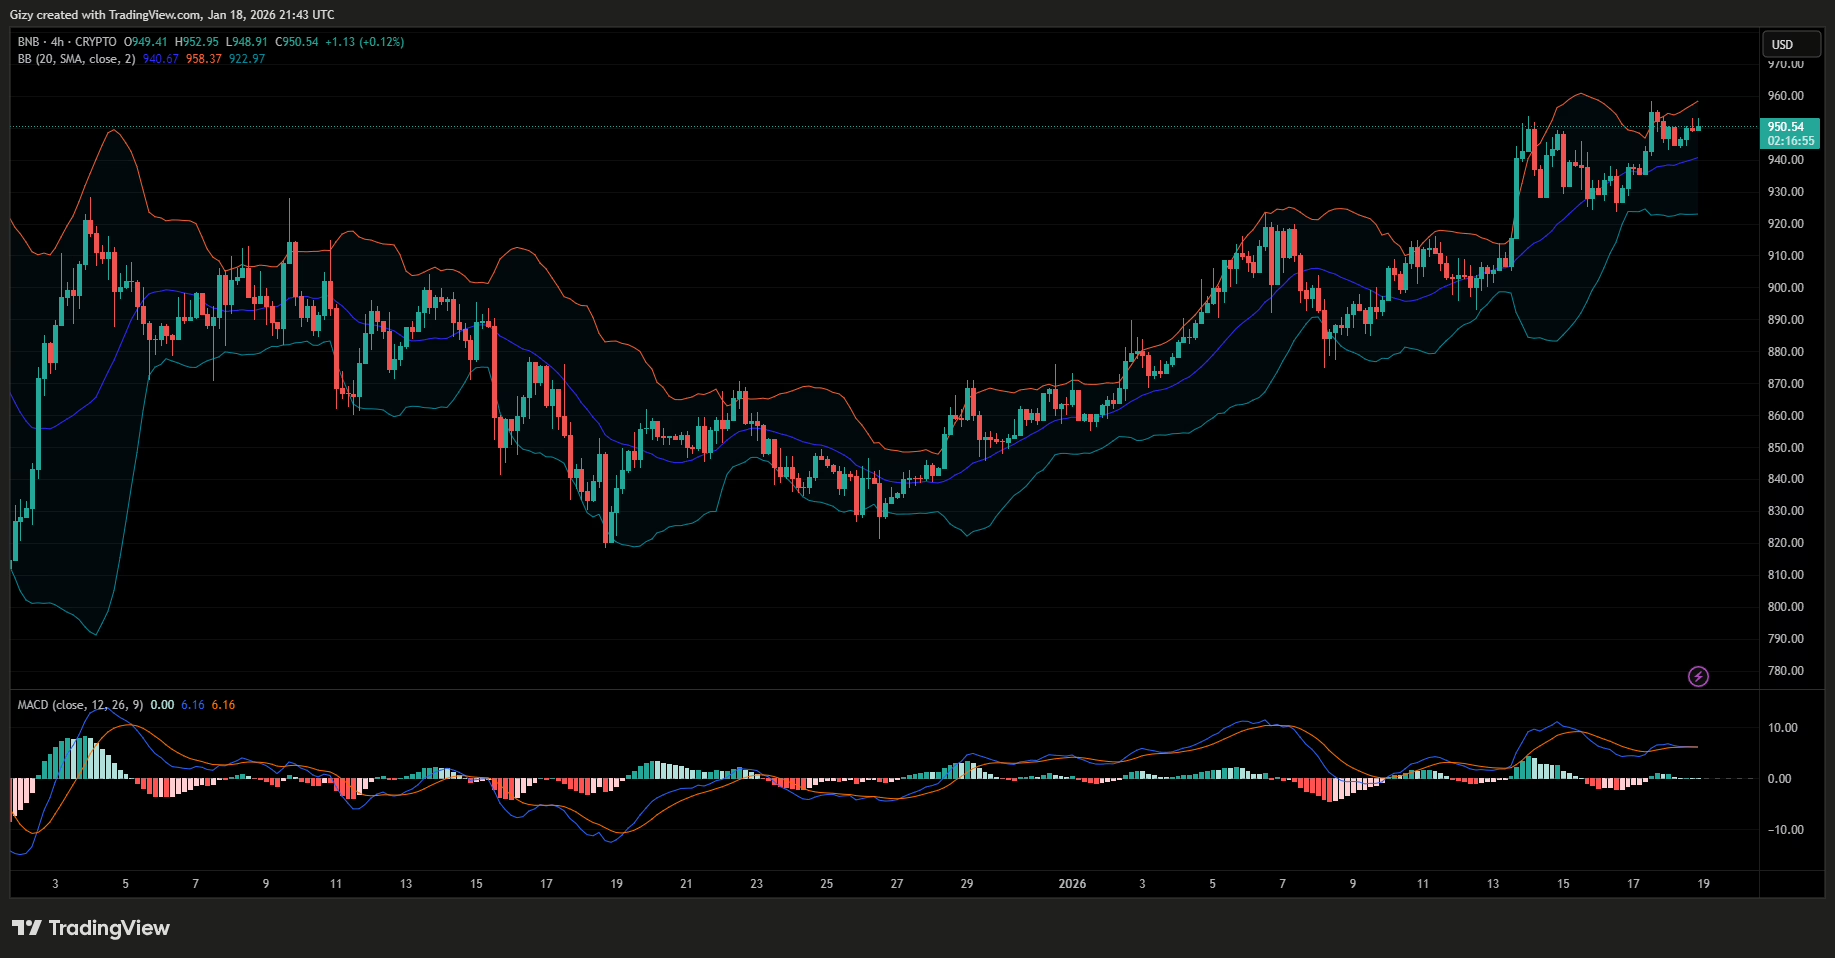
However, indicators on the 1-day and 4-hour charts print signals suggesting the uptrend would end. Focusing on the shorter timeframe, the asset is trading close to bollinger’s upper band at the time of writing. Additionally, MACD readings are not pronounced. Nonetheless, it previously had a negative crossover.
Based on the highlighted metrics, the altcoin may be heading for another period of downtrend. If that happens, the bulls must defend the $925 support or risk a potential plummet below $900.
SOL/USD
Solana recently rebounded after a slight correction earlier. It is currently experiencing notable increases at the time of writing. The asset is gearing to close the week with notable increases.
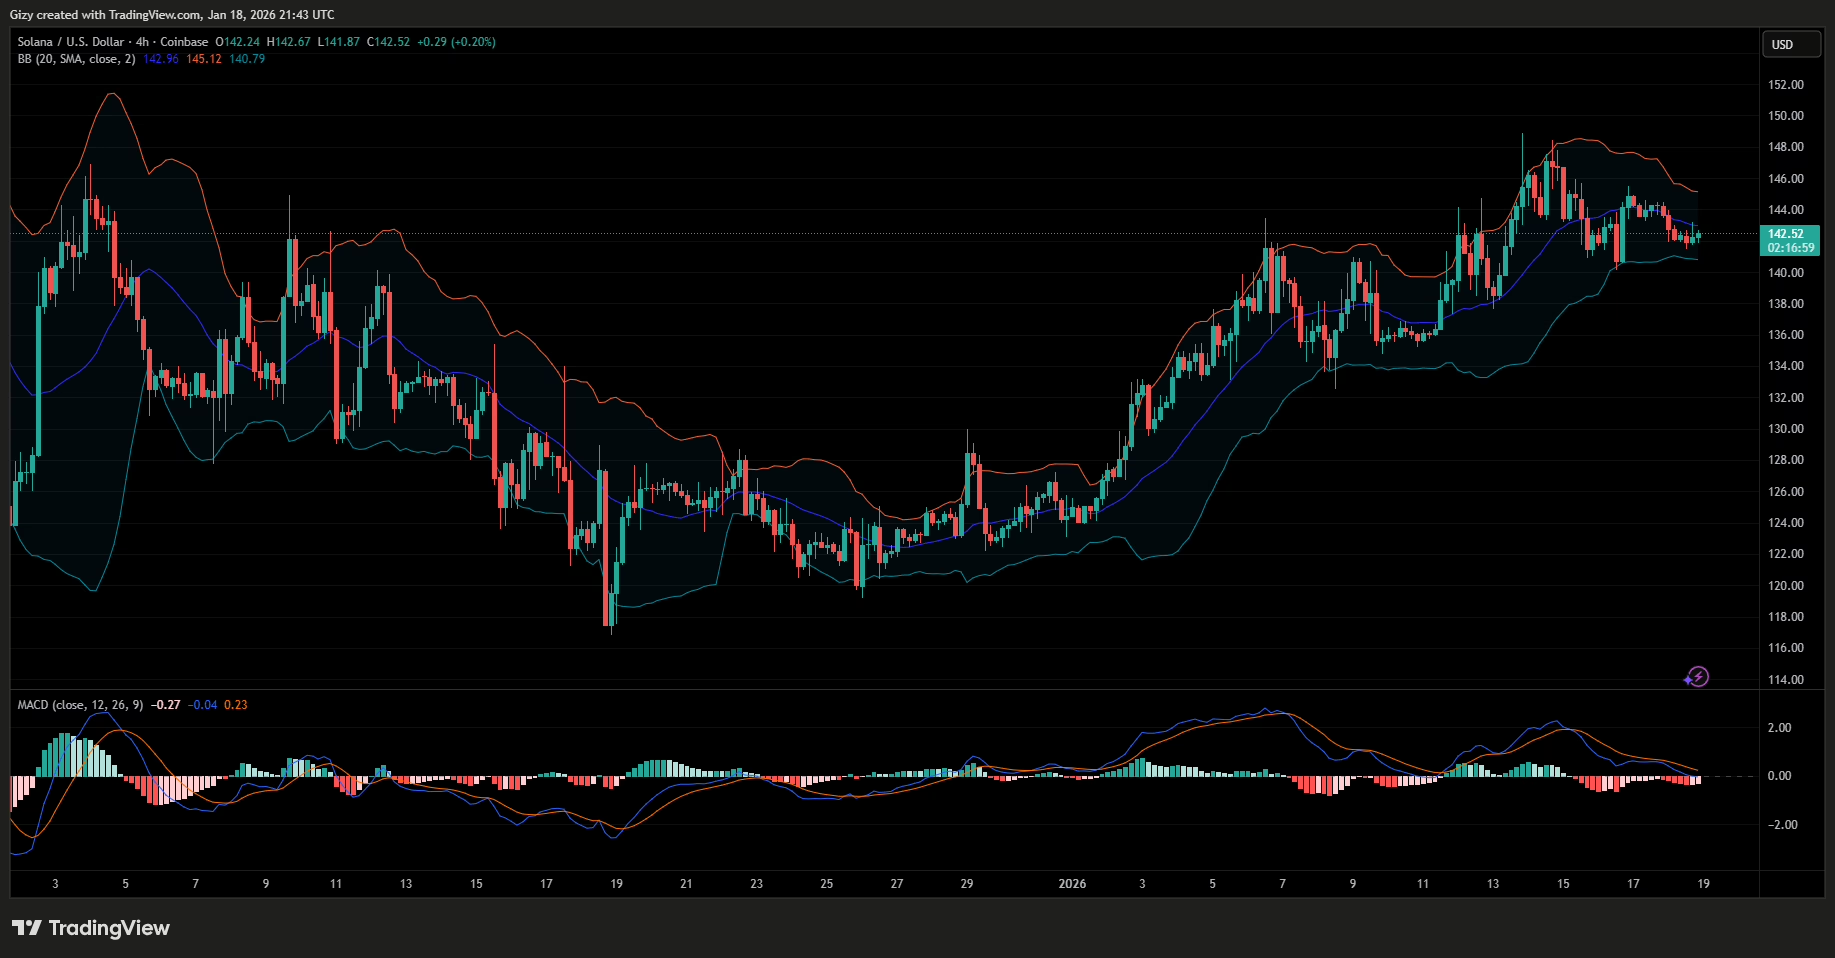
However, indicators on the 4-hour chart suggest the asset may continue to decline. A closer look at MACD shows it had a negative divergence a few days ago and has since continued its downward trend. Nonetheless, the bollinger bands offer a slim chance of surging, depicting the coin trading below the SMA as a reason.
In either case, the 4-hour chart identified $138 as a critical support. A slip below this mark would send the altcoin down below $132.
DOGE/USD
DOGE is on the verge of erasing its gains from earlier this week. Like ETH, it saw significant gains on Tuesday but then experienced rejections afterward.
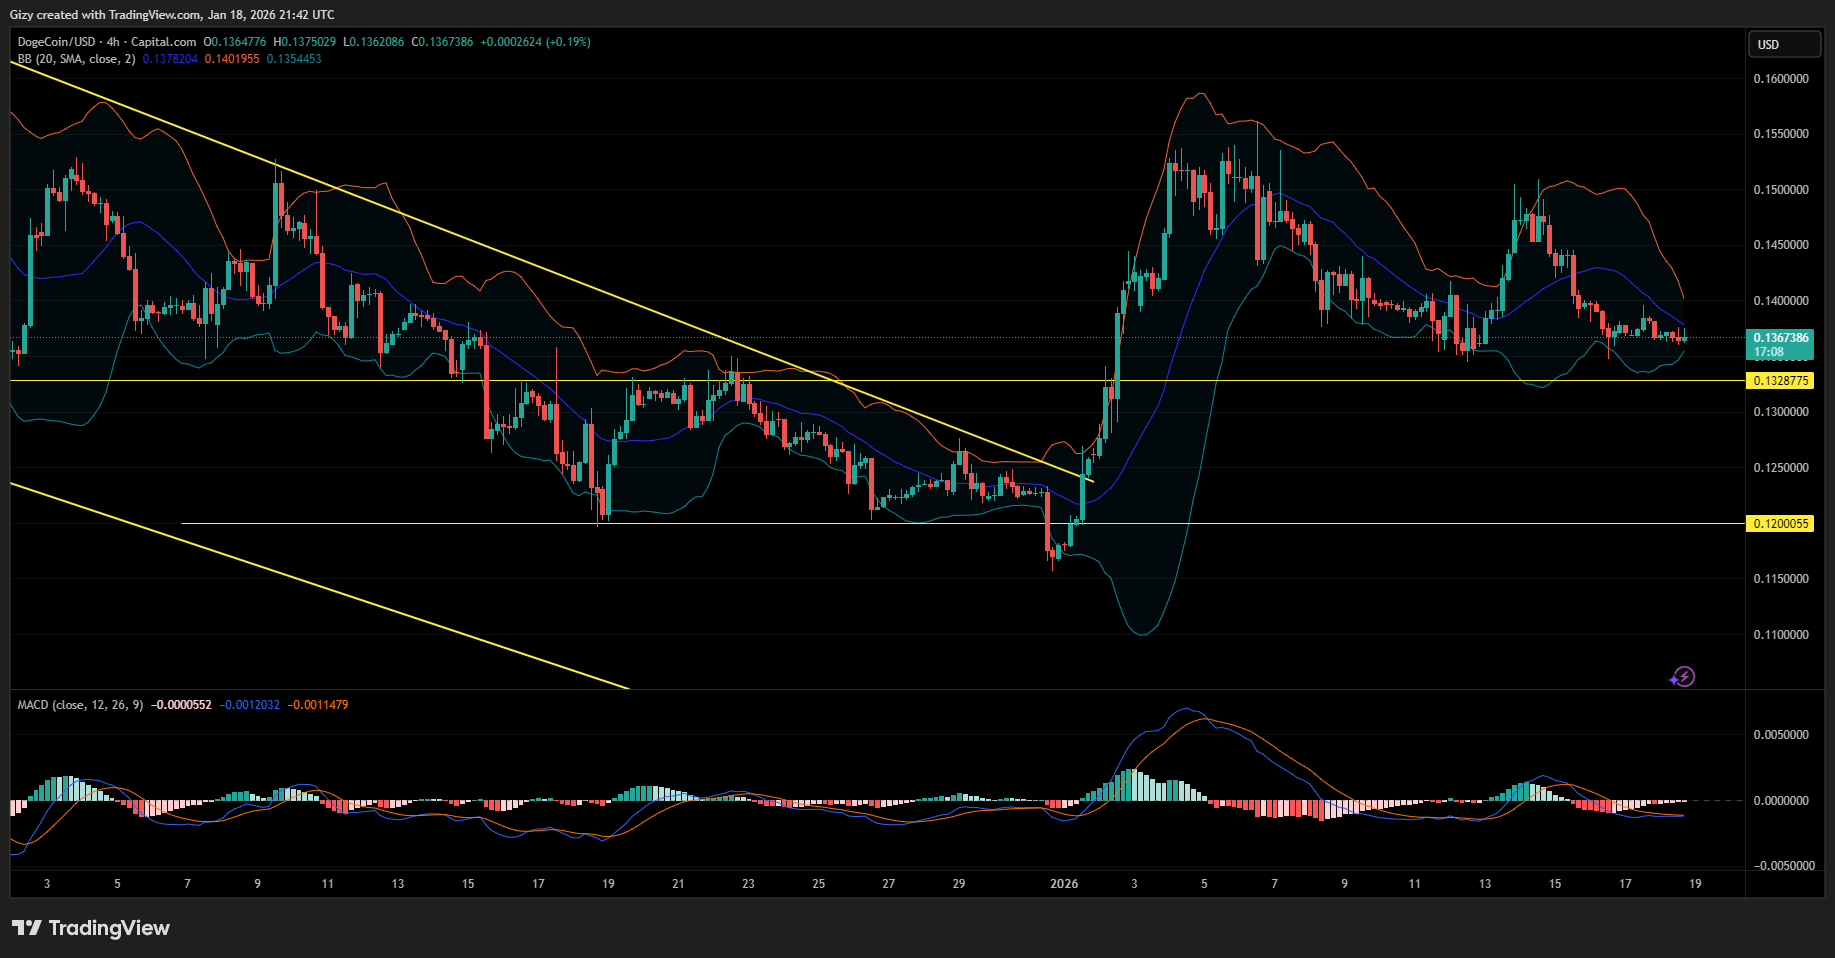
The asset is on the verge of registering a slight price improvement on the weekly scale, following its significant decline two weeks ago. Nonetheless, indicators on the 4-hour chart suggest a higher chance of further uptrend.
MACD and bollinger bands currently print buy signals, with the former edging closer to a positive crossover. If bullish signals hold, the memecoin will surge to $0.15.
ADA/USD
Cardano is trading near its lowest level of the week. It is edging closer to ending the week with a doji, shedding the gains it made on Tuesday.
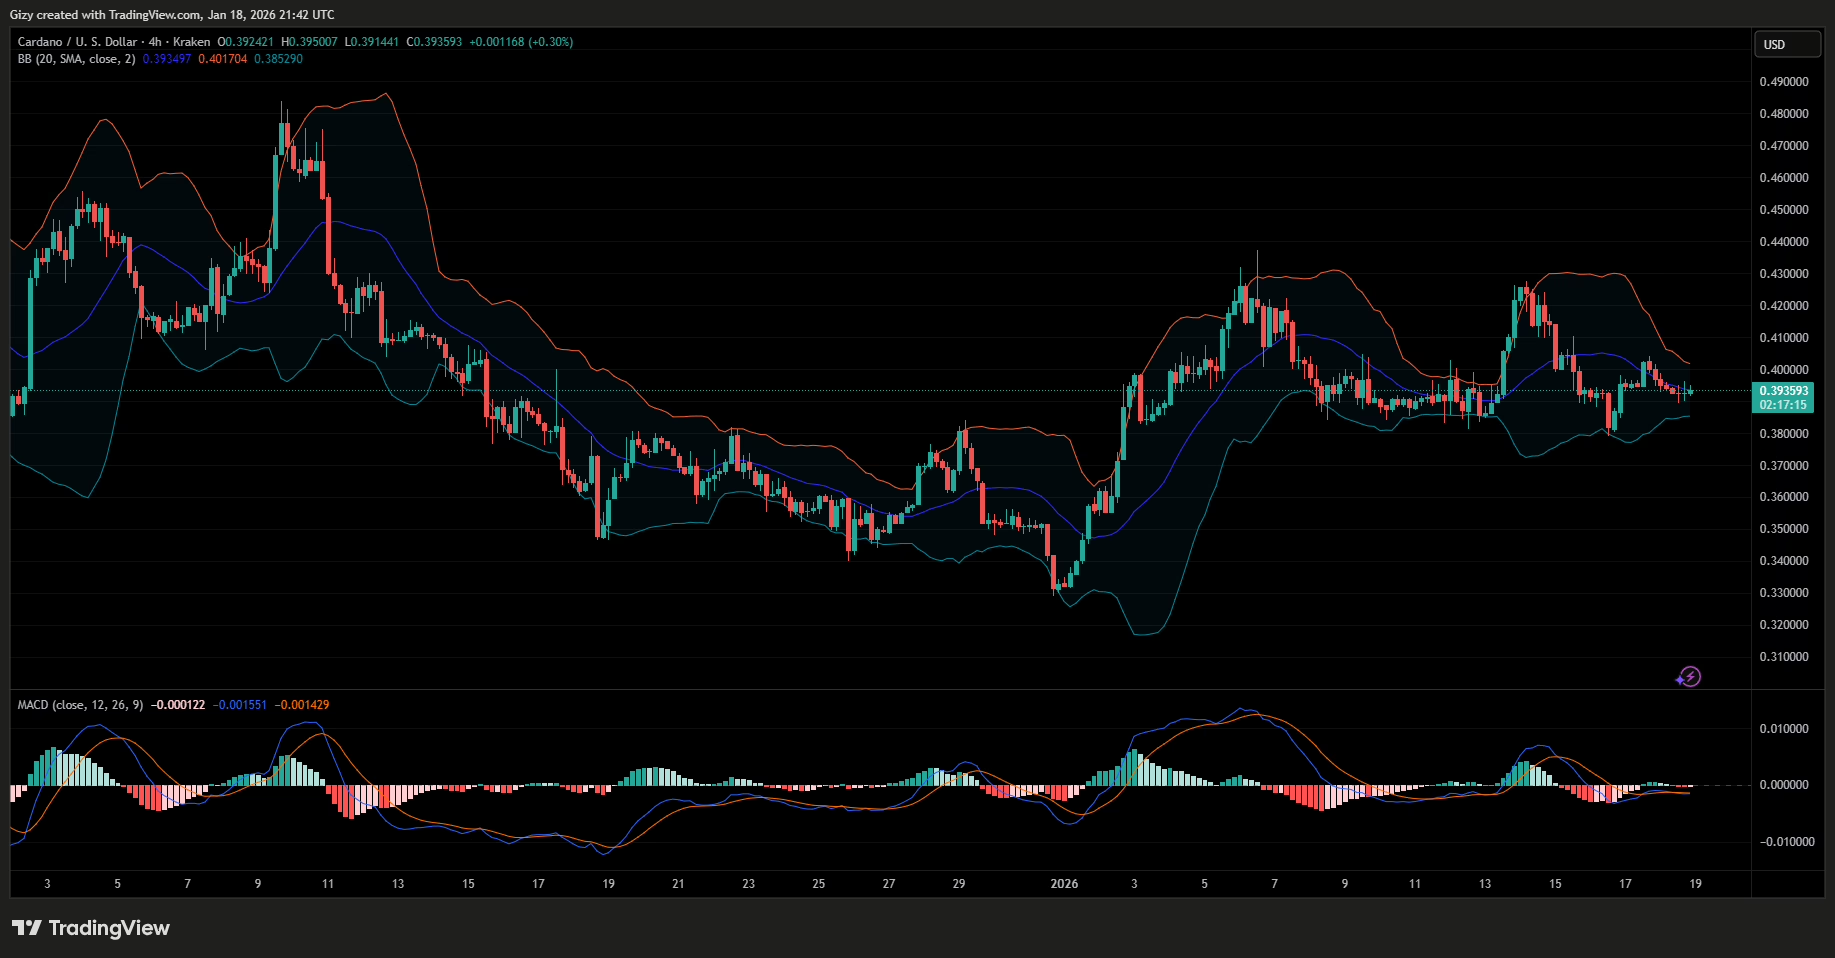
Nonetheless, indicators like the moving average convergence divergence and the bollinger bands suggest that the asset will resume its uptrend next week. MACD shows an ongoing positive convergence as ADA trades below bollinger’s middle band.
If these indicators hold, Cardano may surge even higher in the coming days. It may attempt the $0.40 barrier within the first two days of the new week.


