
Bitcoin is on the verge of retesting $72k again. The impending attempt will mark the second trial this week as it continues to grapple with notable selling pressure.
The 1-day chart suggests a reduced likelihood that this mark will decisively flip. One outlook noted that asset risk would slip lower if the bulls lost their upward momentum. Nonetheless, BTC is seeing slight buying pressure at the time of writing, but the ongoing accumulation is insufficient to cause such a massive increase.
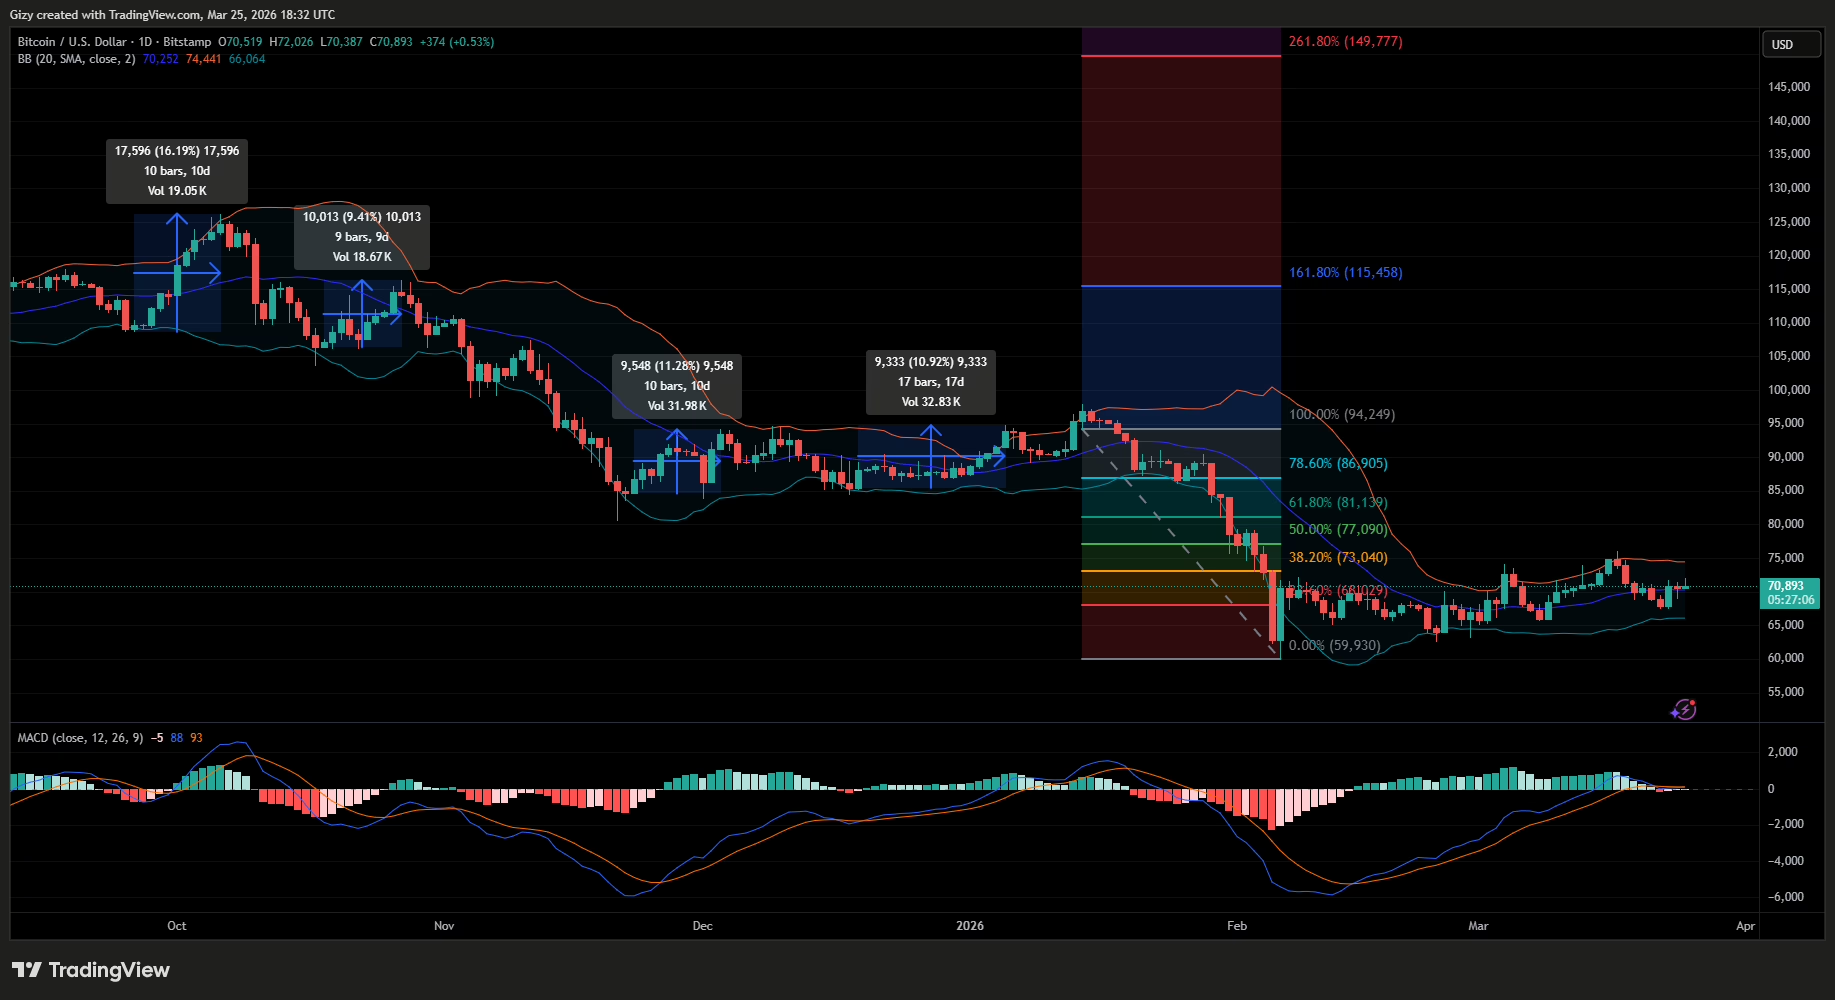
Looking back at price movements over the last thirty days reveals that this is not the first time the apex has faced such strong rejections at $72k. For context, since Feb 7, it has mostly traded below this key level despite several attempts at breaking out.
Nonetheless, the current struggle at the highlighted mark masks an underlying event affecting the coin. To understand what it is, let’s take a closer look at price action between Mar 16 and 23. Bitcoin surged to near $75k for the first time in more than 30 days.
It continued upward the next day, peaking at $76k, but stalled. One analysis called the rejection “the first sign of trouble” and suggested that the uptrend has ended. It also predicted a drop below $70k if the bulls fail to defend $73k.
However, the liquidation heatmap shows notable clusters around $69k and $68k, hinting at a rebound at this mark. Comparing the cluster with demand levels on the 1-day chart shows correlation as the asset rebounded at these levels on multiple occasions.
This time, the apex coin fell through the mark and rebounded at $67,400.
Why the Rebound is Concerning
Based on the charts, there has been significant demand concentration around $67.4k over the last two months. After losing $68k, the apex coin retraced to $65k before rebounding, suggesting the recent bounce did not occur at a key level and may lack the pressure to go higher.
The surge seen on Monday, where the asset gained over 4%, may be short-lived, and a massive decline in the coming days is almost inevitable. A closer look at the chart supports this claim, as BTC is grappling with notable selling pressure.
However, with the chart hinting at further decline, other events are brewing onchain. Several positive metrics are currently flipping negative as of this writing.
For example, the Coinbase Premium Index was positive last week, indicating that the whales were accumulating. It fell below zero on Mar 18, coinciding with the massive decline during that session. Interestingly, the drop was not one that saw the index trend close to the boundary. It is currently at lows seen in August, suggesting a significant decline in whale buying.
Amid the shift in whale buying, another notable event was the consistent ETF buying over the last fourteen days. Following the price downturn on Mar 18, the Bitcoin exchange-traded fund has seen consistent outflows in four of the last five trading days.
Aside from the ETFs, spot buying is also showing slight bearish signs. Recall that the earlier-mentioned analysis in February, the “30-day moving average volume delta was deeply negative, with -$145M on Binance and -$88M on Coinbase,” but it flipped positive in March; there’s more to it.
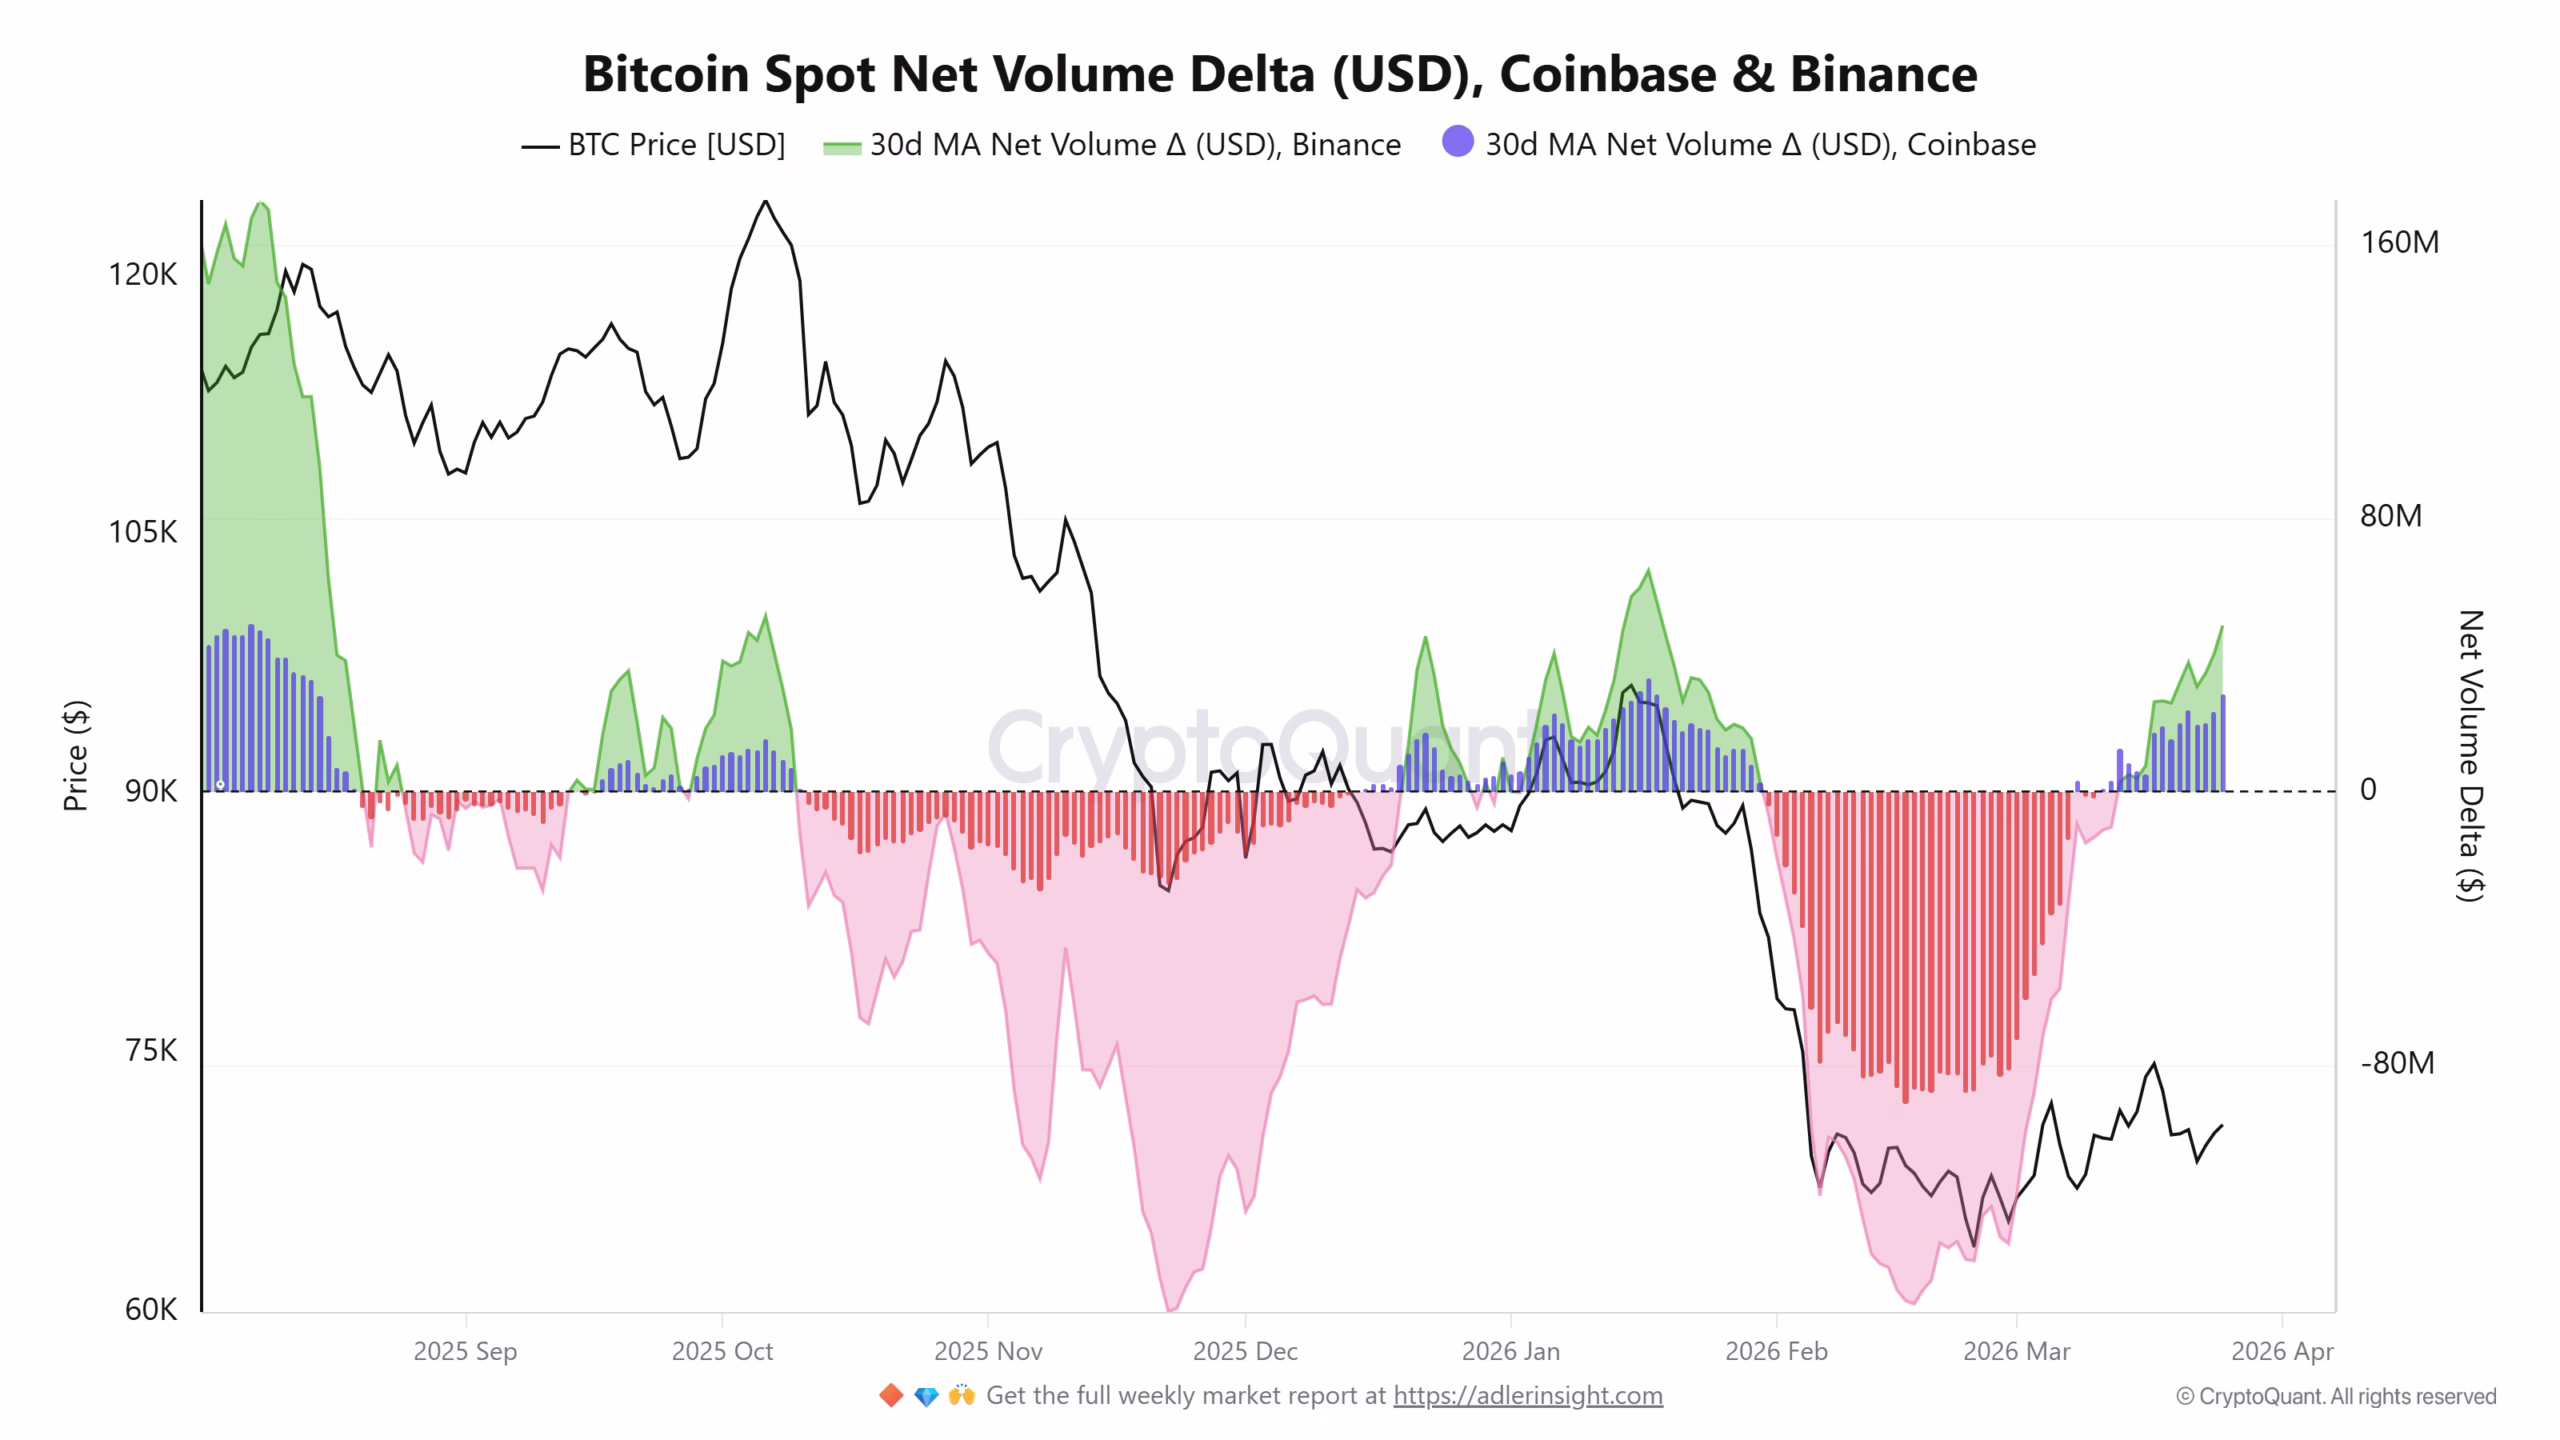
The chart above shows the Net Volume Delta for both Binance and Coinbase. A closer look shows that the apex coin is currently seeing notable buying pressure at the time of writing. However, the 30-day moving average is edging closer to an established resistance level. A drop in the metric is likely, leading to further price decline.
Bitcoin Short-Term Holders are Panicking
The realized price of short-term holders has fallen yet again. It retraced from $88k to $87k in less than fourteen days. A closer look at the chart shows that this cohort has sold once a significant move occurs, worsening dip, or stifling any serious attempt at an uptrend.
Even worse, STH’s profit has dropped significantly. The metric currently sits at 8.2%, meaning in the event of another downward pull, more selling takes place. In a nutshell, onchain indicators are currently negative and predict a more extensive decline ahead.
Aside from these metrics, geopolitical events remain volatile. Recently, Iran announced the collapse of talks with the US, citing unreasonable terms as the cause. Military analysts are now predicting an impending ground invasion. The market will no doubt retrace in the event that tensions escalate further.
Bitcoin Dangles $75k Prospect
Amid the growing bearish pressure, there is room for a short squeeze. The initial jobless claim on Thursday could result in a significant uptrend if positive.
However, beyond fundamentals, options offer another shot at an uptrend. The market is gearing up for a massive $14 billion expiration on Friday, the largest of the month. There are currently 197,640 open interests, with the calls accounting for 121,378.
The max pain is currently at $75k. Given the number of calls to put, the bulls are edging and may cause a significant surge above the max pain.
Interestingly, the Greek table provides an insight into what could trigger such a hike. At $70k, delta is currently positive, suggesting that the market makers are hedging long. However, they’ll flip max bearish at $71k and gradually throttle down afterward.
The likelihood of a surge above $75k will increase if the apex coin maintains trading above $72k on Thursday. A slip below this mark will see MM flip full bearish again.
In summary, while massive bearish builds on Bitcoin and the risk of decline remains high, options may send it above $75k again before the massive selloffs role in.
Get Trending Crypto News as It Happens. Follow CoinTab News on X (Twitter) Now


