
XRP is the top loser in the top 10 over the last 24 hours. The constant shuffle between it and BNB in the top 10 continues, as the altcoin relinquishes its spot to BNB following the latest wave of decline.
Now the fourth largest, the asset is experiencing a massive drop in trading volume. Data from CoinMarketCap shows a massive 41% drop in volume over the last 24 hours. The decline also explains why XRP saw a notable price decline.
Aside from the altcoin, the global cryptocurrency market cap prints a red candle on Tuesday. The bullish fundamentals from Monday have since faded, and investors are grappling with notable selling pressure.
The 1-day chart suggests that the downtrend will worsen this week as key indicators flip negative. The same reading is also present in the 4-hour chart. One such indicator is the bollinger bands. A closer look at previous movements reveals that an attempted breakout was unsuccessful.
It is currently declining following this failed trail. Aside from the BB, the MACD also prints negative signals: the 12-EMA halted its uptrend, and the histogram printed shorter bars.
These readings point to a further decline in the next 48 hours. Let’s take a closer look at how some assets in the top 10 will perform.
BTC/USD
Bitcoin is currently trading down by more than 2% at the time of writing. It began to decline after its failed attempt to sustain the previous day’s upward momentum.
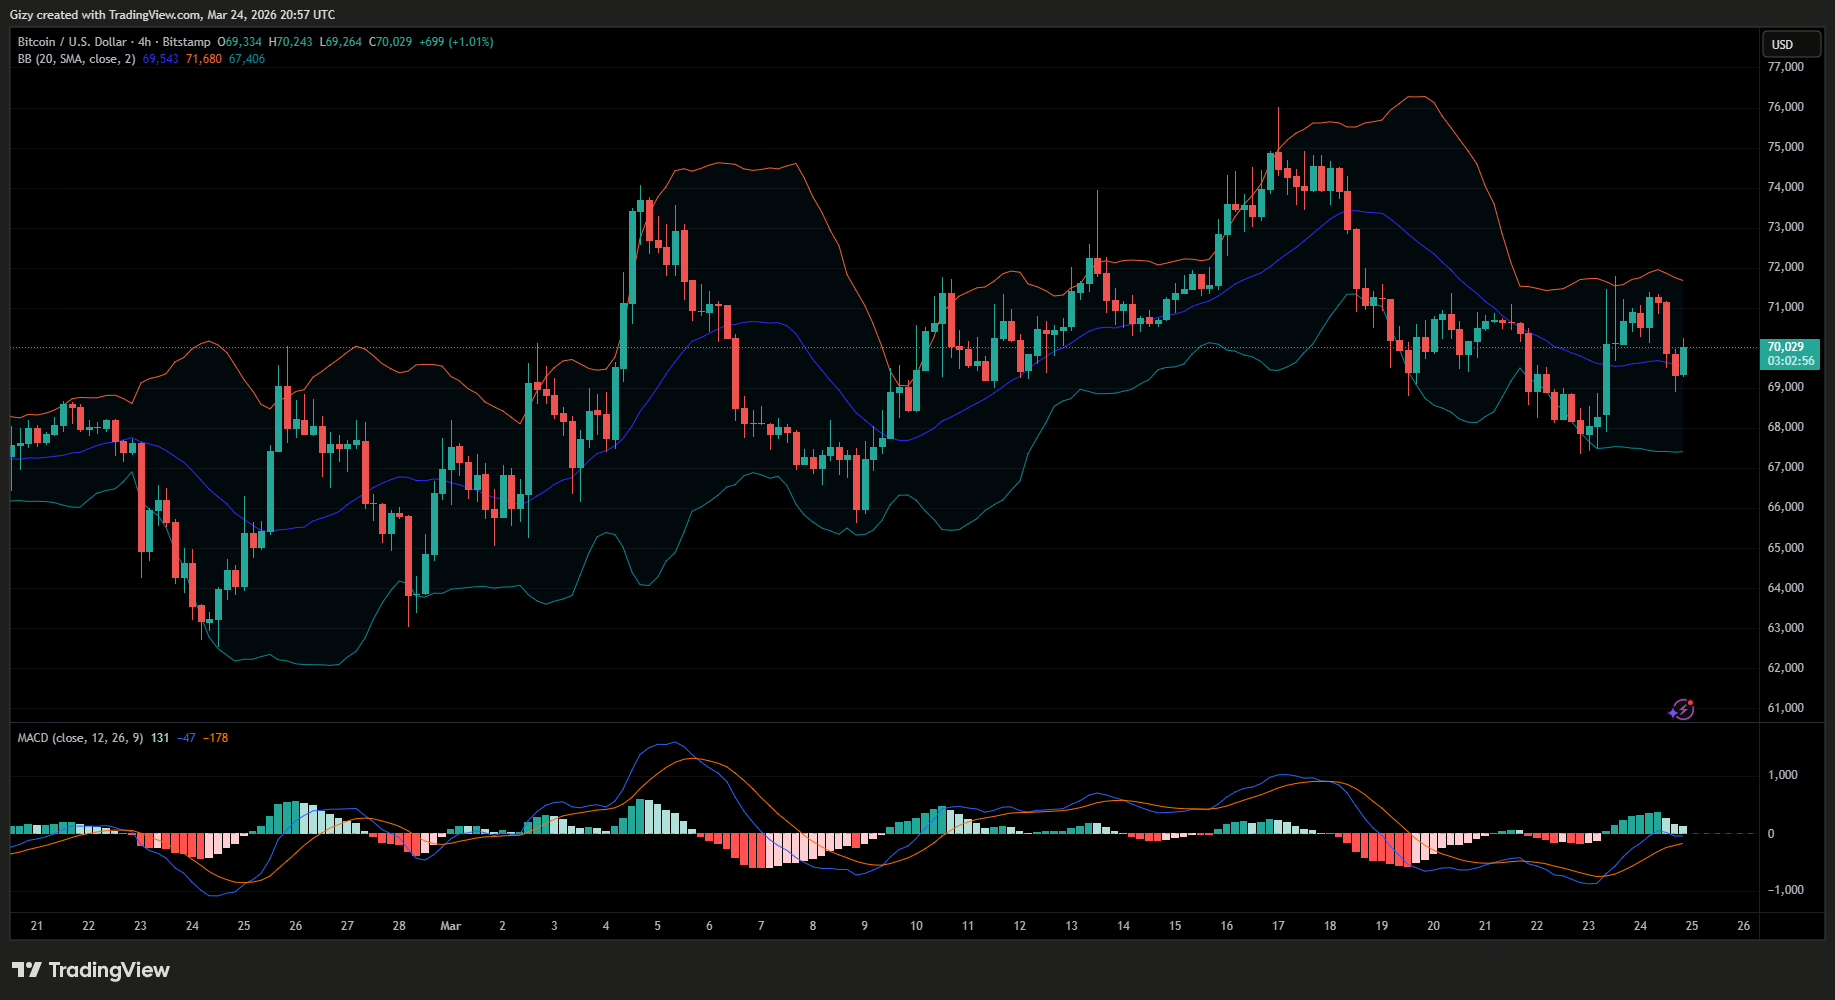
The 4-hour chart explains why it is currently struggling to surge. A closer look shows that on Monday it peaked at $71,801, almost $300 above bollinger’s upper band. In a nutshell, the latest decline may be in response to the breakout.
Per the bollinger bands’ principle, the apex coin may continue downward in the coming hours. Its target may be the lower band at $67,300.
The moving average convergence divergence supports a further decline, as it prints sell signals at the time of writing. A closer look at the indicators shows that the 12 EMA halted its uptrend in the early hours of Tuesday. It currently trends downwards, hinting at an impending negative crossover.
ETH/USD
One outlook from the previous week warned that if the bulls failed to sustain the buying pressure at the time, Ethereum would likely retest $2k.
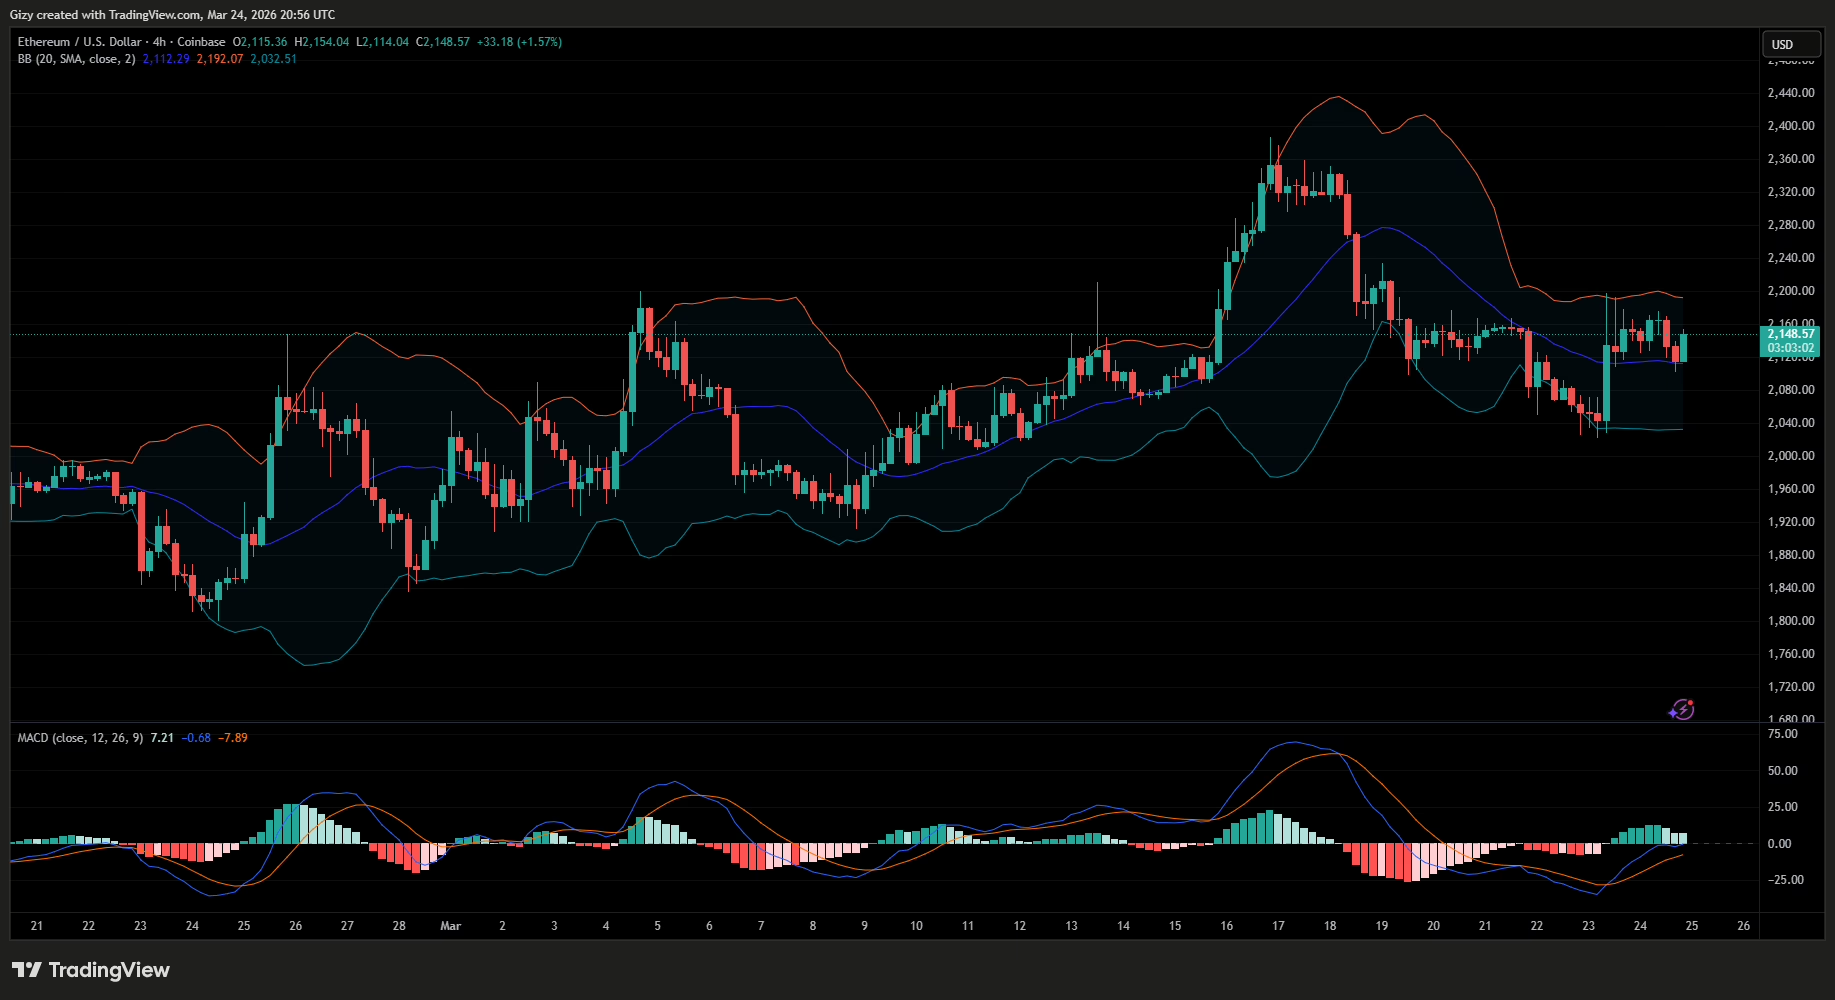
As predicted, the test happened in the early hours of Monday when prices retraced to a low of $2,022. However, the 4-hour chart showed a sharp surge that sent it to $2,198. It soon faced notable selling pressure, resulting in a slight decline.
The altcoin is currently trading at $2,125. The selling pressure intensified on Tuesday, pushing prices down to $2,101. A closer look at the chart reveals that amid the increased pressure, ETH maintained trading above bollinger’s middle band.
If the trend continues, the bulls may stage further buyback, pushing as high as $2,250. However, if it loses this key mark, the apex coin will retest $2k again.
Additionally, MACD prints sell signals, warning of a significant decline if prices slip below the SMA.
BNB/USD
The previously mentioned outlook also predicted a drop in BNB to $625. It retraced below the mark on Sunday, retesting $620.
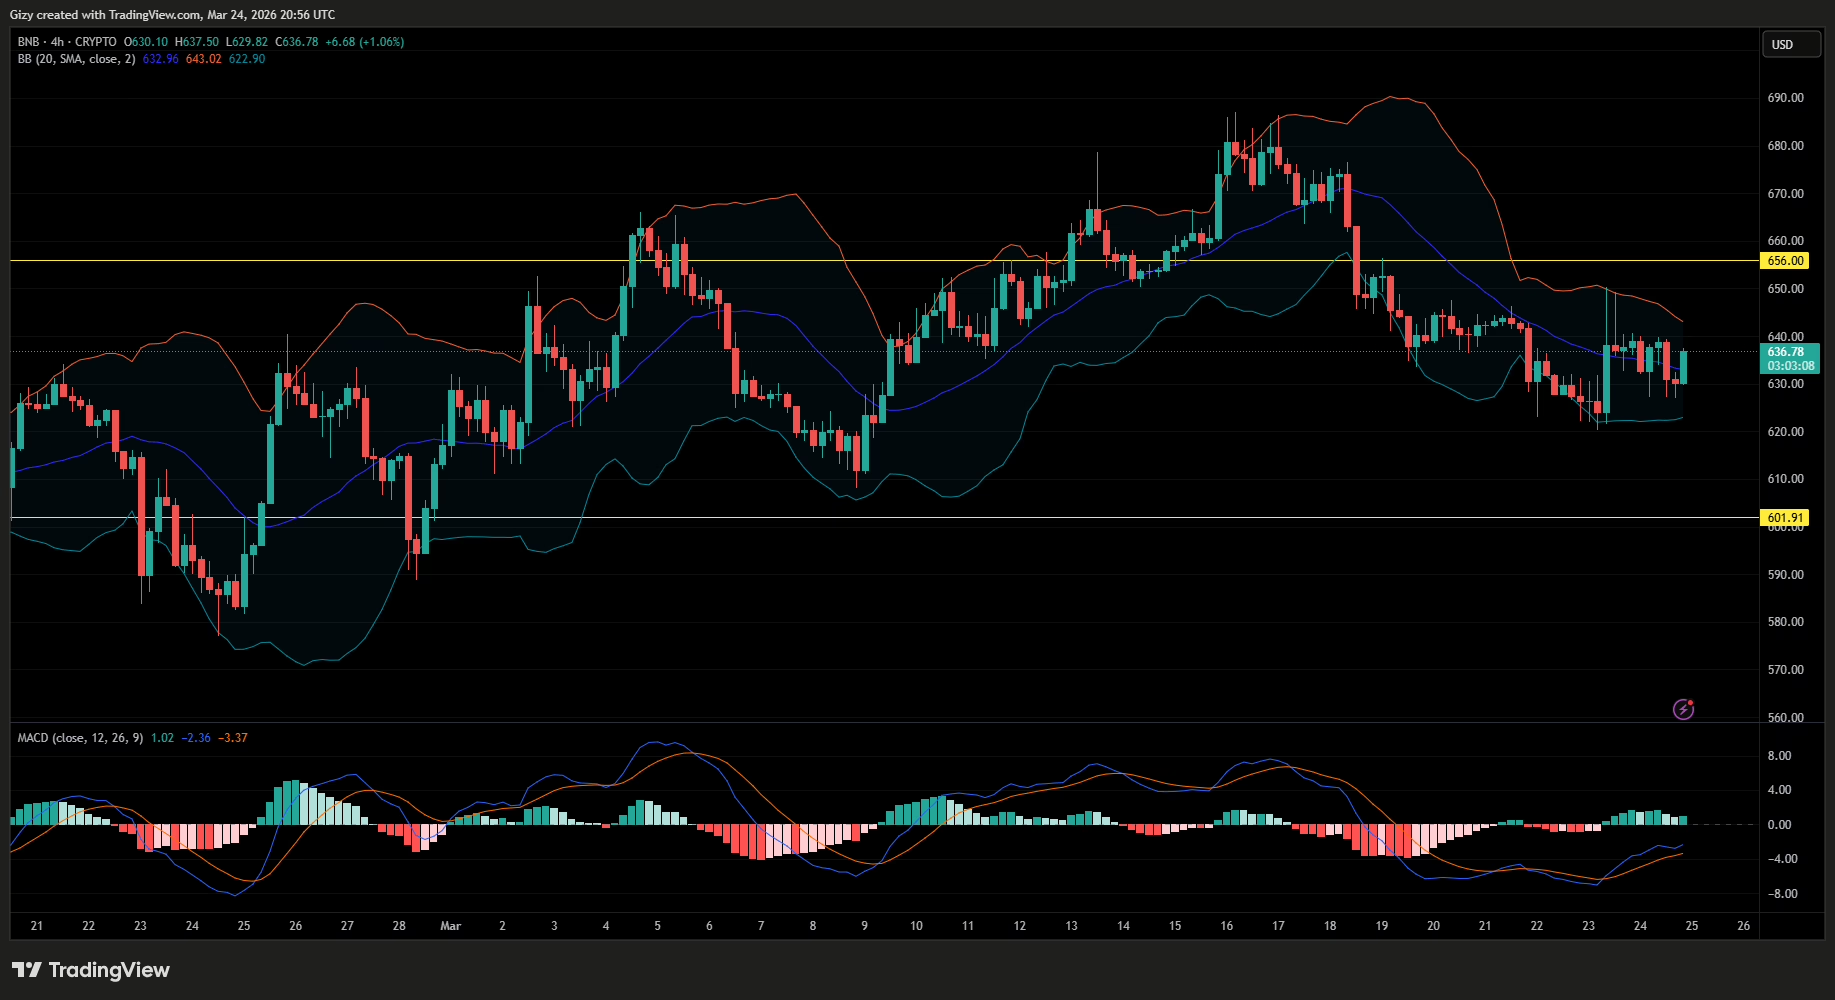
Nonetheless, it saw notable buying pressure afterward. As a result, it peaked at $650 on Monday. It has since lost momentum following a breakout above bollinger upper band. A closer look at price action revealed that the altcoin held on to $627 despite several retests. The bulls may stage a rally at this level in the coming hours, sending BNB back above $650.
However, the moving average convergence/divergence suggests a reduced likelihood of this playing out. It prints a sell signal when the 12- and 26-EMA are close to intersecting. Such a negative crossover may indicate a possible decline below $620.
XRP/USD
On the 1-day chart, XRP experienced a significant price increase on Monday, surging to a high of $1.46. However, it saw a slight correction afterward, but ended the day with gains exceeding 3%.
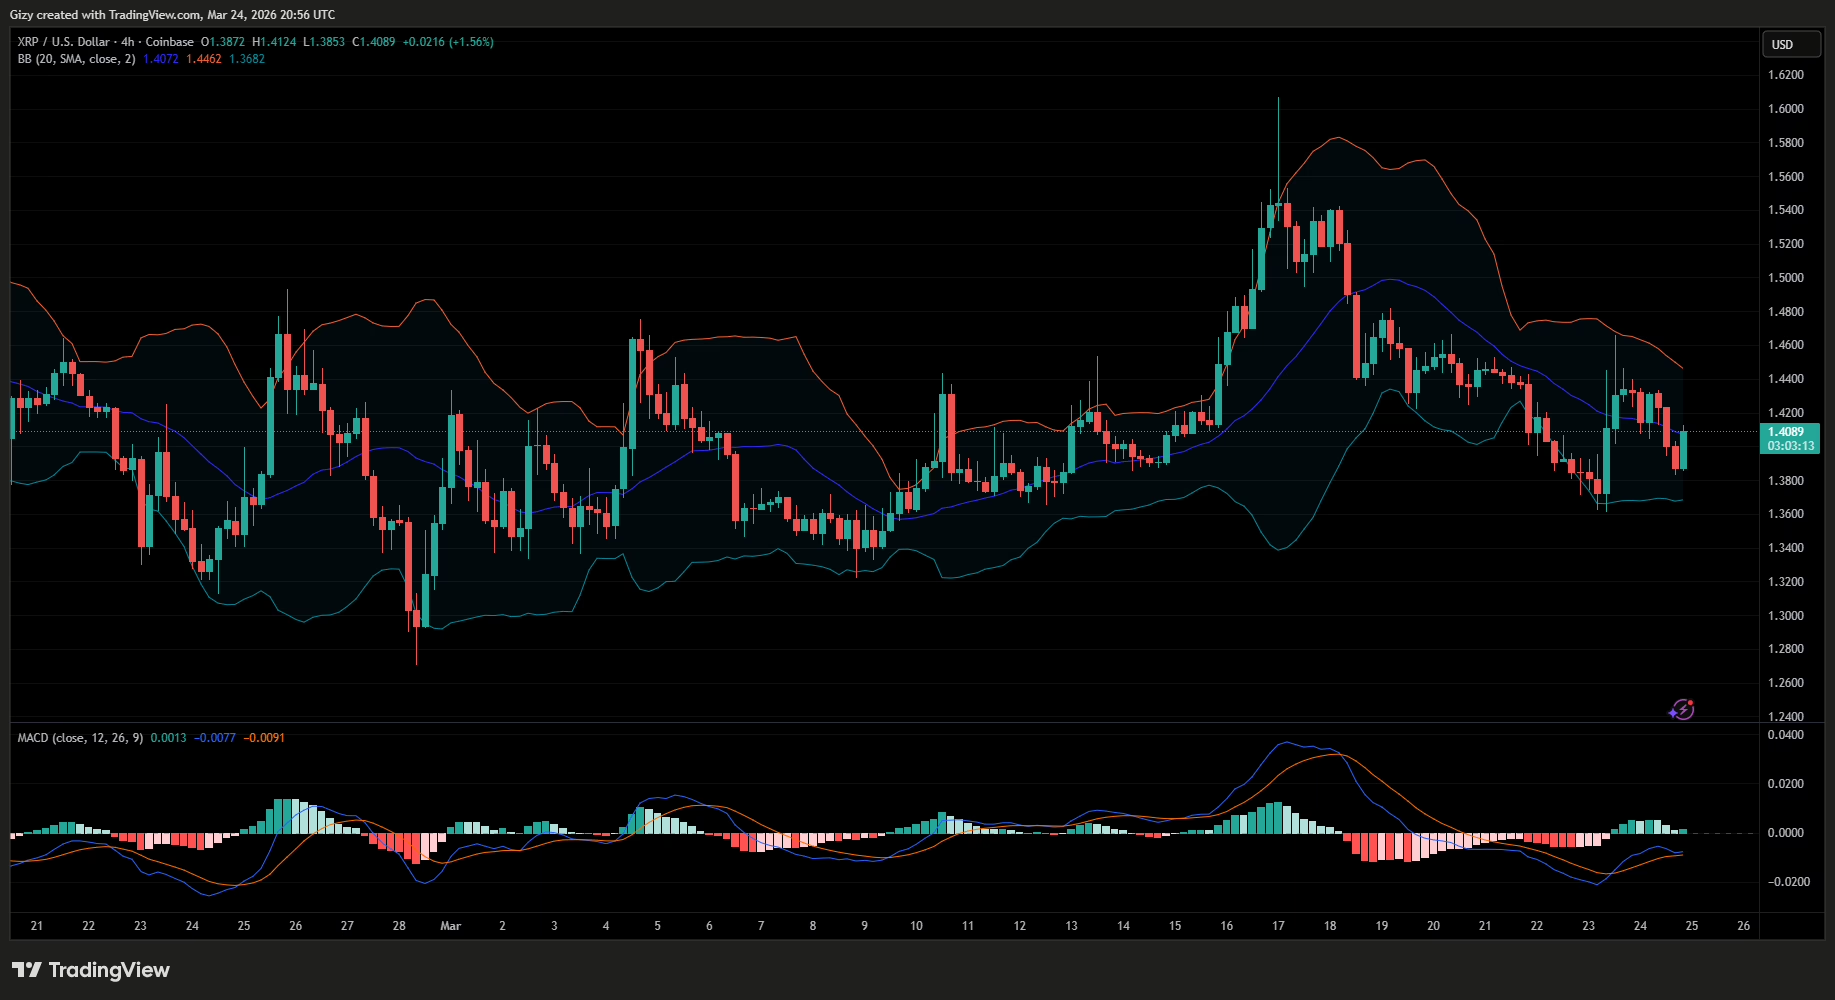
Tuesday is a far cry from what transpired the previous days. The altcoin has been mostly bearish, shedding almost all of its previous gains. On the 4-hour chart, it is seeing a slight buyback and trading slightly above its low.
However, the bollinger bands suggest that the downtrend may continue. XRP retraced below the middle band a few hours ago. The next likely level for rebound is the lower band at $1.36.
SOL/USD
Like XRP, Solana saw significant buying pressure on Monday. It surged from $86 to $92, ending the session with gains exceeding 6%. The hike erased all the losses it incurred over the weekend.
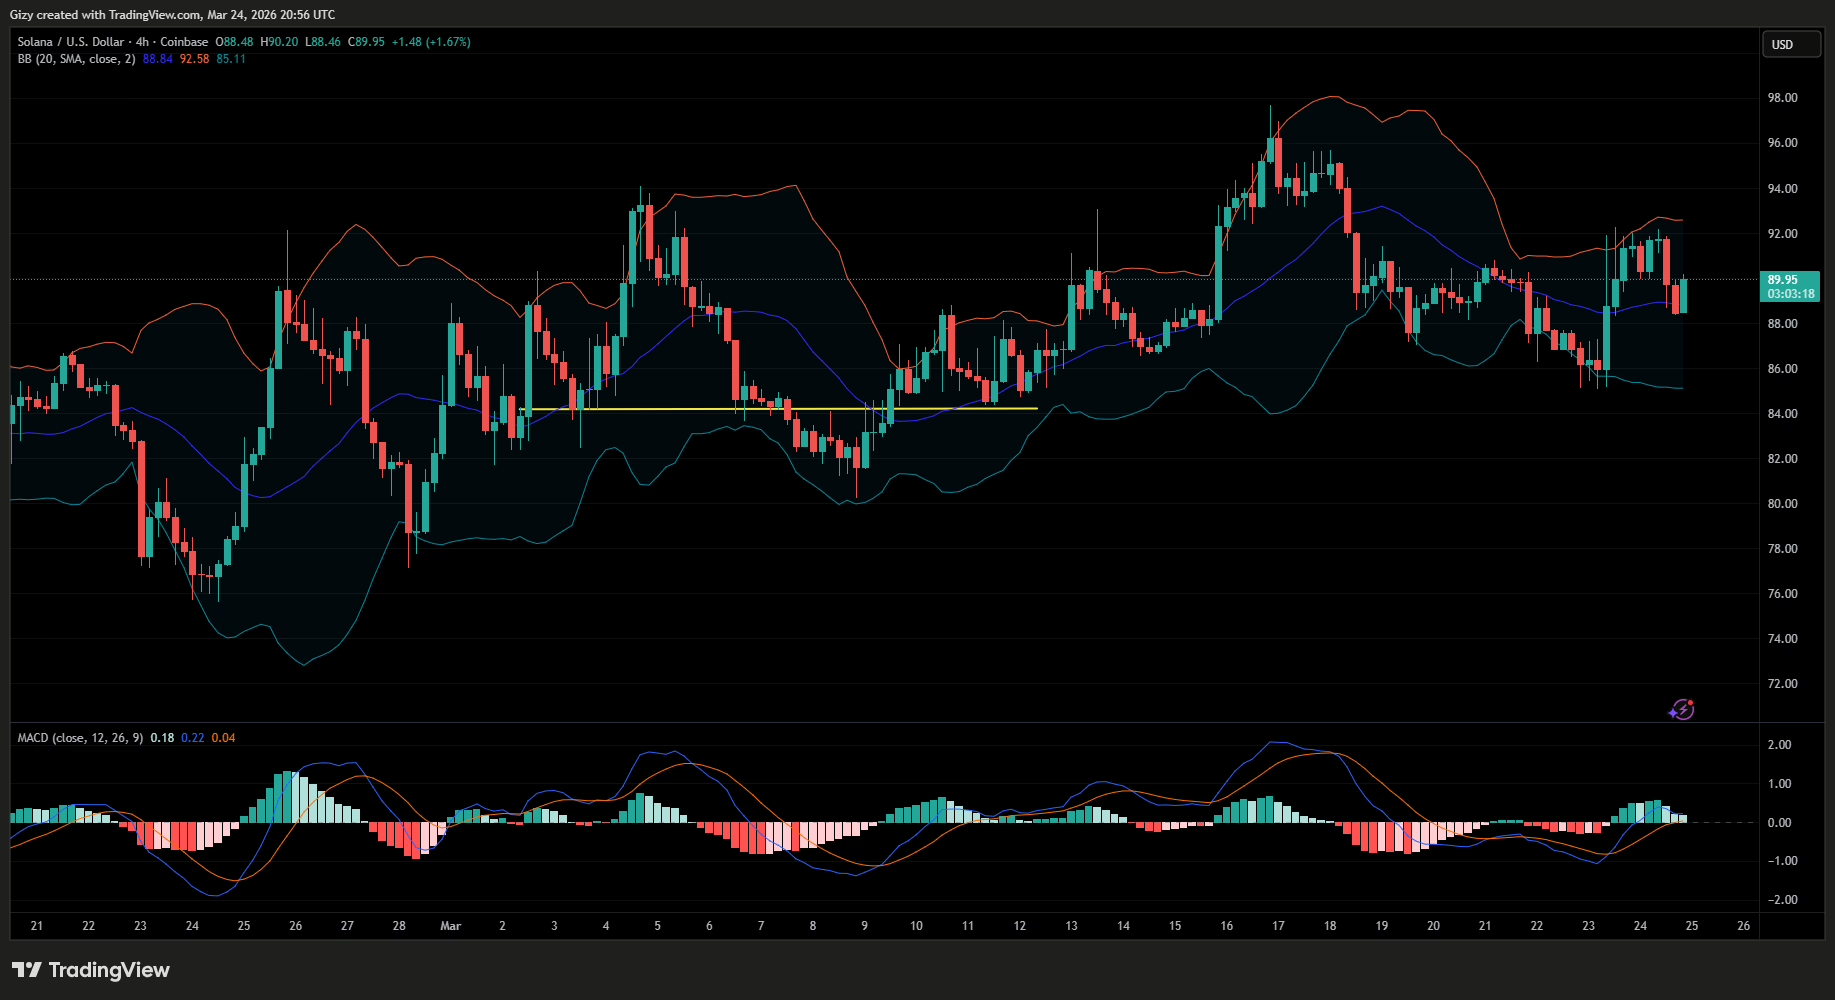
However, it is down over 3% on Tuesday, suggesting the bears have resumed selling. The 4-hour chart shows that the bulk of selling pressure happened in the last eight hours. As a result, SOL is currently trading at $88.5, a level with slight demand concentration.
The bulls must defend this mark, previous price movements suggest a decline to $85. The bollinger bands also support this prediction as the altcoin is currently trading below the middle band and will retrace to the lower band next.
DOGE/USD
DOGE saw notable selling pressure over the weekend, resulting in a drop to $0.089 for the first time in more than fourteen days. However, it rebounded on Monday, surging to $0.093.
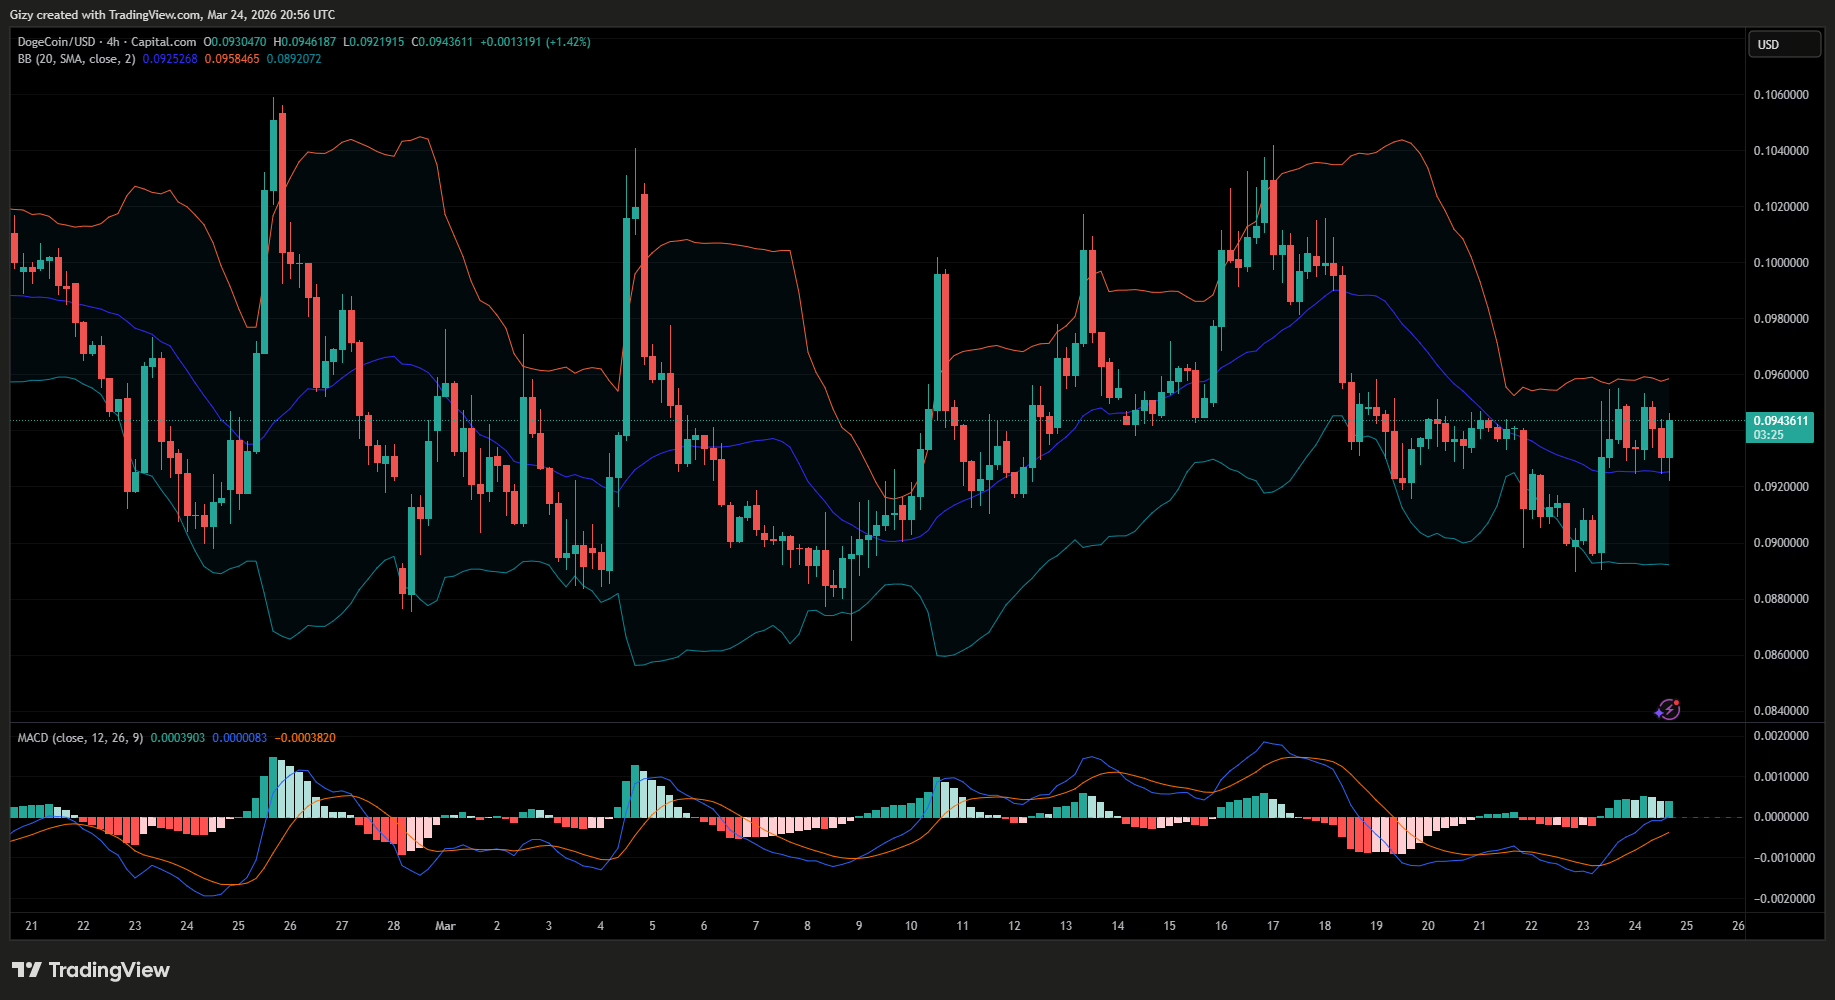
It soon began grappling with notable selling pressure but maintained trading above bollinger’s middle band. It recently bounced off the mark and is trading closer to the upper band. If the bulls sustain the current uptick, the memecoin will retest $0.096 within the next 48 hours.
However, losing the mark will send it to the lower band at $0.089.
HYPE/USD
Hyperliquid peaked at $39.4 on Monday but lost momentum shortly after. It retraced below its opening price and ended the day down almost 3%.
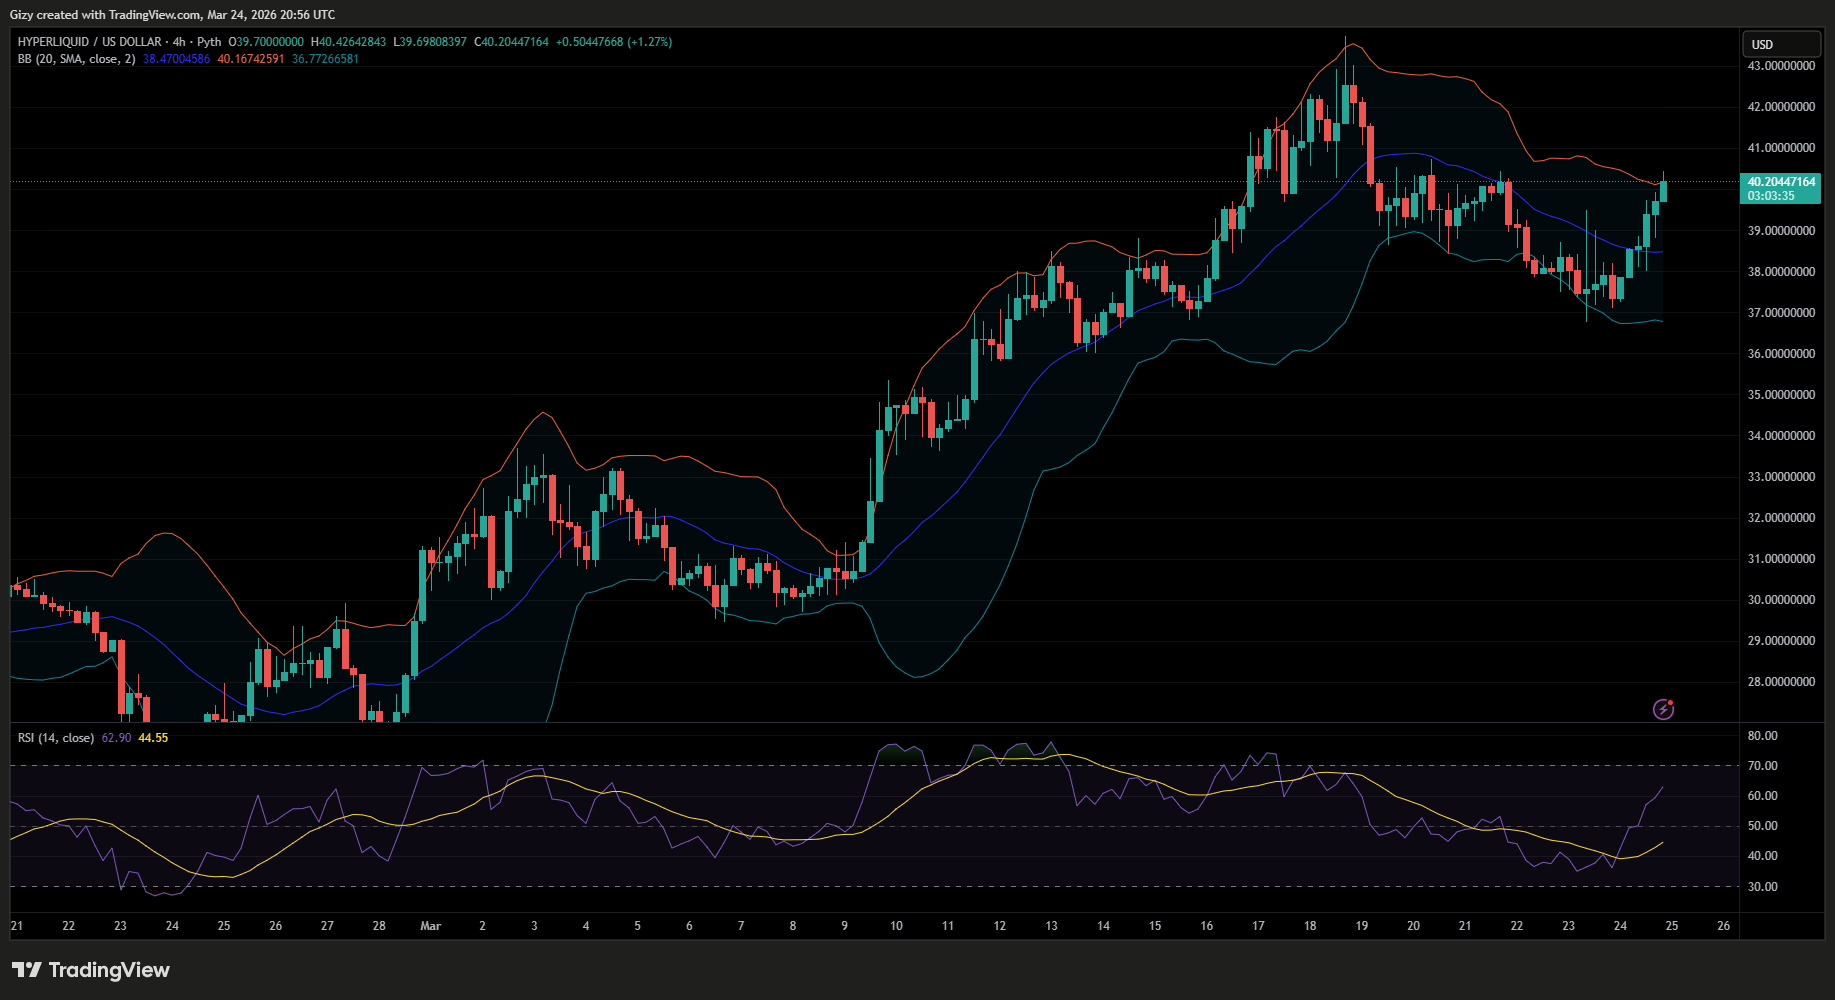
It is currently experiencing one of its biggest surges. It opened Tuesday at $37.3 and surged to $40.4. Currently up over 7%, it is trading near its high after slight corrections.
However, previous price movements on the 4-hour chart indicate a higher likelihood of a trend reversal after breaking above $40. Since last week, the altcoin has been grappling with notable selling congestion at the mark.
HYPE may drop to $38.5 if it fails to break the barrier in the coming hours.


