
Bitcoin is seeing more increases at the time of writing the bulls attempt buyback in the late hours of Tuesday.
The 4-hour chart show that the apex coin trended sideways of the session but retraced lower, a few hours ago. It dropped to a low of $108,717 but rebounded and struggled to continue the uptick. Nonetheless, trading conditions improved in the session starting at 16:00 UTC. Bitcoin surged to a high of $111,117 and is currently trading higher.
However, all is not positive for the largest cryptocurrency. Data from CryptoQuant shows that over 36.3k flowed into exchanges into over the last 24 hours. This figure contrasts with the 32.6k that moved out. As a result, the exchange reserves are increasing.
Bitcoin Network Activity Slows Down
Reports from Glassnode indicate that Bitcoin network activity is slowing down. The monthly average transfer volume has declined by 13% from $26.7 billion to $23.2 billion. Notably, the yearly average of this metric is $21.6 billion, and a drop below this mark would confirm that investors are becoming increasingly dissatisfied with Bitcoin.
They are expressing this dissatisfaction by either dumping the asset or selling fewer units. This also means that there is less speculation of further increases, suggesting reduced faith in the coin.
The drop in network activity coincides with the massive decline in prices. Trading actions on Tuesday marked the end of Bitcoin’s three-day downtrend. It lost almost 6% during this period and dropped to a low of $109,283.
Nonetheless, BTC long-term holders were the largest sellers during the downward trend and realized a greater profit than in most other cycles. Such profit-taking mostly happens during the late phase of the market cycle. This might mean that the apex coin is seeing an end to the bull run.
Adding to the concerns for the bulls, several indicators on Glassnode are bearish. For example, active addresses dropped 2% to 692k over the last three days. Due to the decline in this metric, network fees have decreased by 17%. This also means that there is less demand for blockspace.
It is worth noting that the number of sellers was significant during this period, causing the supply in profit to drop from 95% to 91%. Additionally, the net unrealized profit and loss decreased to 5%, indicating a reduction in profitability.
Bitcoin Bulls Push Back
Trading actions on the 1-day chart indicate that the apex coin is poised to erase the losses incurred on Monday. It is up by 2% over the last 23 hours, with the bulk of the uptick happening in the last 8 hours.
Some of the driving forces include massive buybacks from institutions. According to a recent report from HODL15Capital, 14 public treasury companies added 4,330 BTC ($476 million) to their reserves in the last 48 hours.
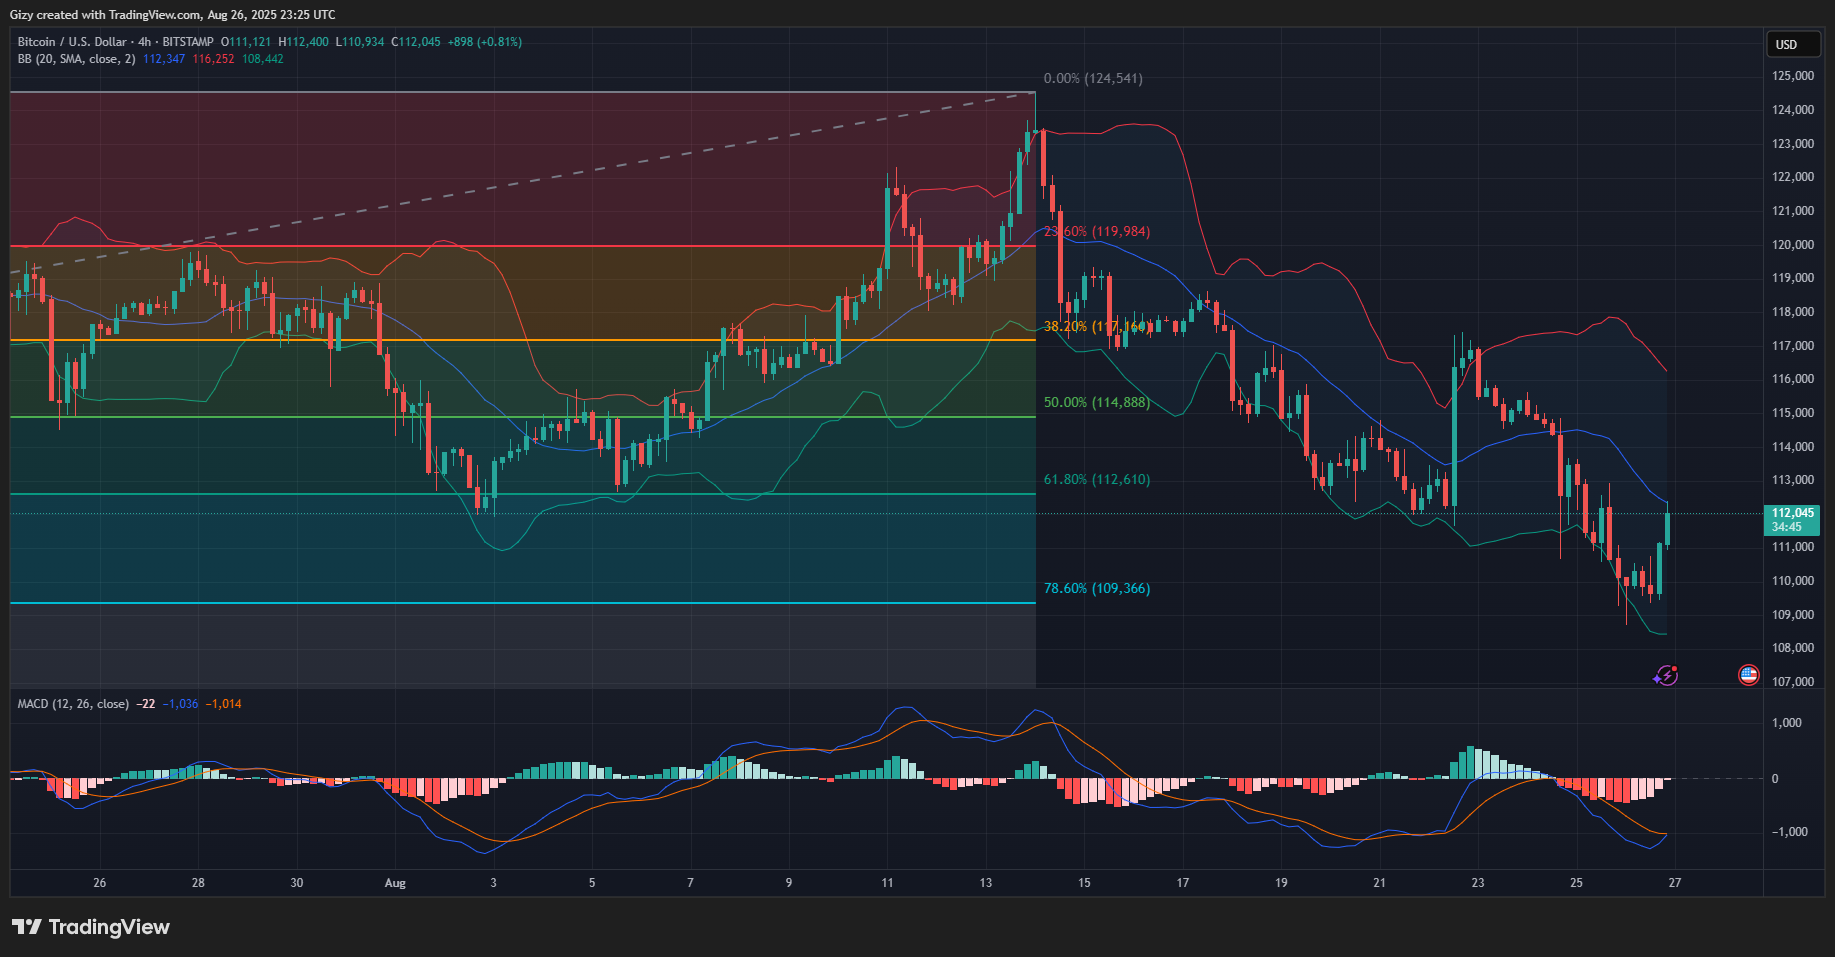
The 4-hour chart indicates that buying pressure remains significantly high, causing indicators to shift in a bullish direction. One such is the moving average convergence divergence. The metric shows that the 12- and 26-day EMAs are in contact, completing the bullish convergence.
While MACD indicates further increases, the Bollinger bands point to the next possible price target. It is worth noting that the asset faces notable rejection at the middle band. However, readings from the MACD suggest that the coin will break above this metric and retest above $115,000.


