Litecoin is on the rise following the inflow of fresh liquidity into the market. It is seeing notable price improvement, spurring expectations of further increases.
The altcoin is experiencing a significant pullback from the previous day’s decline, resulting in a massive retracement. It kicked off trading at $118 and started plummeting in the early hours of the session. Interestingly, the 4-hour chart provides a more comprehensive view of how prices performed during this period.
The chart shows that the bulk of the decline happened in the session starting at 4:00 UTC, resulting in the asset dropping by over 4%. Although the downtrend slowed, the altcoin continued to decline, experiencing another significant drop late on Monday. LTC lost another 2% and dropped to a low of $106 hours later.
Litecoin is edging closer to ending the three-day decline as it gained over 4% on Tuesday. It trades at $113 at the time, suggesting that the bulls are sustaining the recent upward momentum. Nonetheless, it is worth noting that altcoins saw notable increases before the latest wave of downtrends.
Institutional interest in the asset was a contributing factor to the surge. One such big firm was MEI Pharma. The company recently announced that it would set a strategy for an LTC reserve and followed through by buying 929,548 units a few days ago.
Another reason for the hikes was the promise of a Litecoin spot exchange-traded fund. Canary filed for the ETF and awaits the SEC’s decisions. While the filing is not recent, the verdict on whether it will become a reality will be clear in October, and some analysts recently predicted a 90% chance of approval.
Will Litecoin Surge Now?
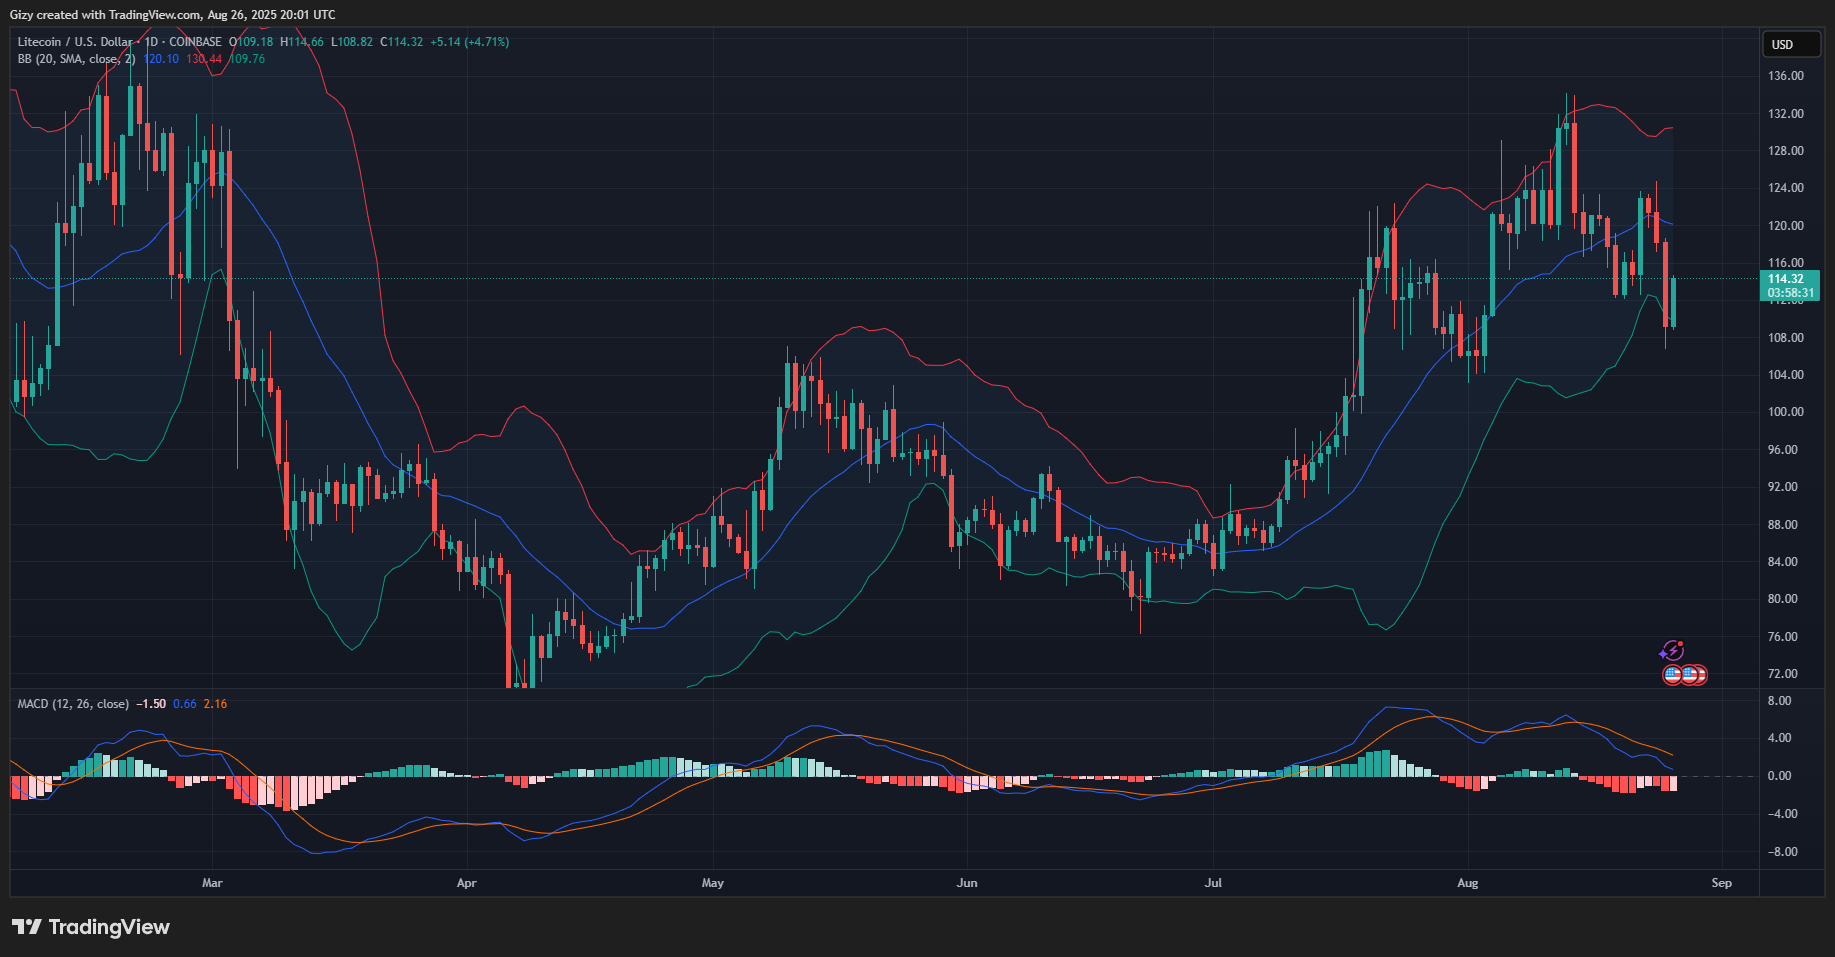
Indicators on the 1-day chart are printing mixed signals at the time of writing. For example, the moving average convergence divergence is poised to continue its downward momentum amid the buybacks. The 12 EMA is sinking to new lows, and the MACD’s histogram prints a bar of the same length as the previous day.
However, the relative strength index is rising, surging from 42 to 47 in the last 24 hours. While its current state shows no signs of its next price action, remaining neutral, it indicates a rise in buying pressure.
Nonetheless, the bollinger band sheds more light on the reason for the latest hike. Litecoin dropped below the lower band on Monday, a traditionally significant signal that often marks the end of a downtrend. The candle representing the current day’s trading action indicates that the altcoin bounced off this critical level.
Readings from the bollinger bands suggest that the coin will continue its uptick. It is worth noting that the asset traded between the middle and upper band before the recent decline. It may return to trend and retest the upper band at $130.
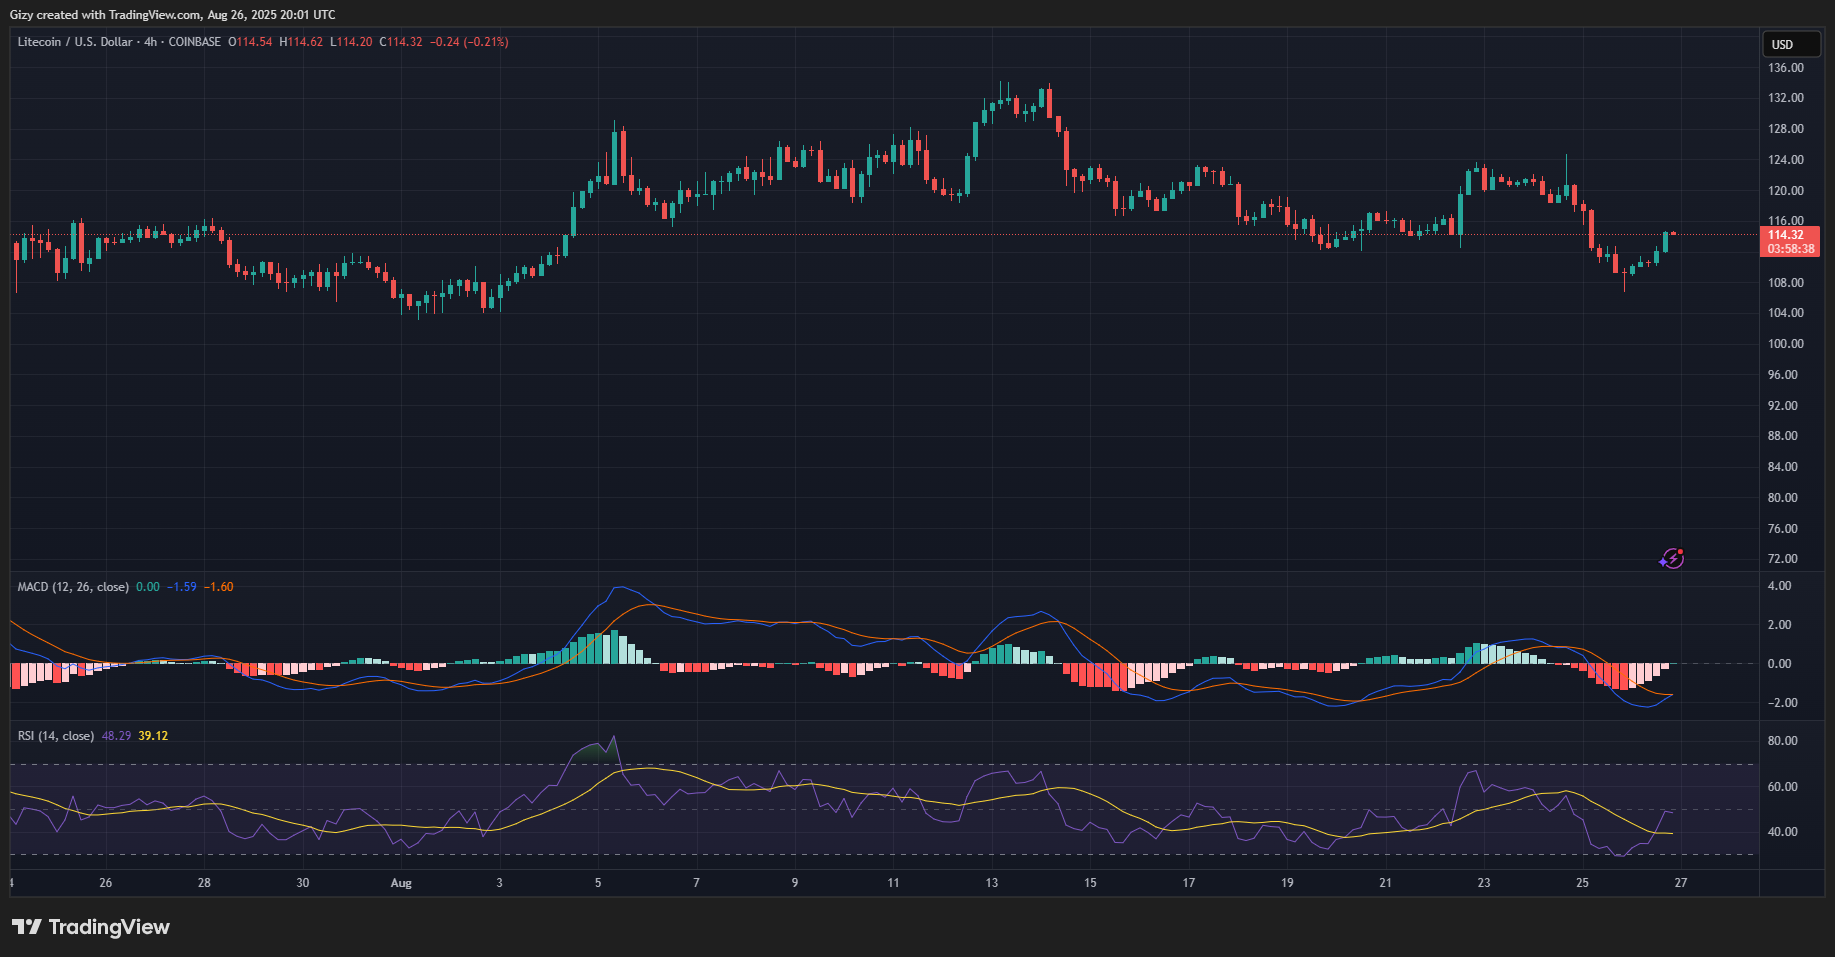
Nonetheless, price action is looking more positive on the shorter timeframe. The 4-hour chart shows that the altcoin was oversold on Monday and is recovering at the time of writing. Aside from RSI, the MACD shows an ongoing bullish convergence that may signal further increases in the coming hours.
Litecoin will look to reclaim the $120 mark. Previous price movement shows that the altcoin hovered around this mark for an extended period before surging higher. However, it is also worth noting that this mark is the make-or-break level.


