Bitcoin had one of its biggest declines on Tuesday, retracing from $92,779 to a low of $87,777 before rebounding. Although it closed the session slightly above its low, it still lost over 4%.
Investors are currently grappling with the effect of the massive decline and struggling to stage buybacks at the time of writing. The apex coin recently surged to a high of $90,471 but retraced and threatens to slip below $89,000.
While the asset continues to experience notable selling pressure, a closer look at events on the 1-day chart shows that Tuesday’s dip was not a standalone event. BTC has been in decline since Thursday, losing almost 10% cumulatively.
The reason for the downtrend has made the rounds. However, the crypto market is still grappling with bearish sentiment, and investors are currently hedging against further decline.
However, questions about when the asset will rebound rage. Some believe it will surge in the coming days and are opening long positions or adding to existing ones.
Bitfinex Whale Takes Action on Bitcoin Decline
One group currently doing this is Bitfinex whales. The BTCUSD LONG chart shows that they began adding and opening more positions on Sunday, and volume has increased steadily since then.
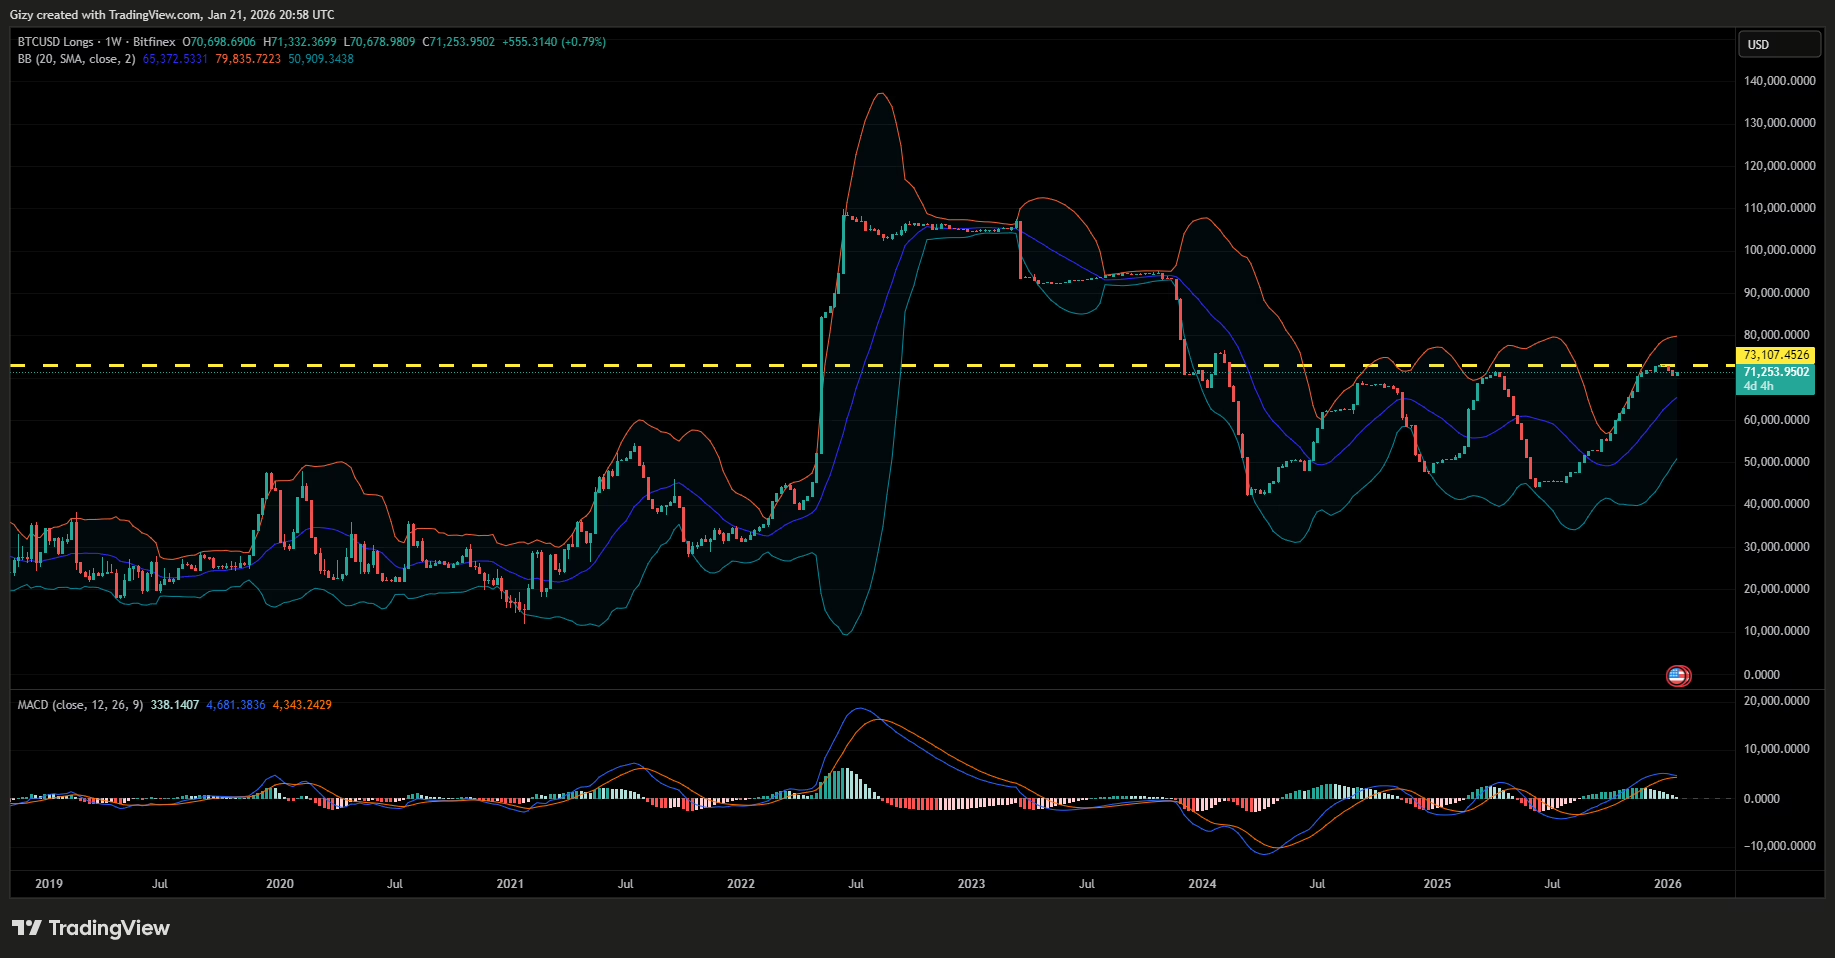
The latest trend shows a reversal from a pattern that unfolded at the start of January. Bitcoin whales were gradually cutting their long positions at the start of the month. The drop in these positions has since caused different reactions, with most being bullish.
A look at the 1-day chart of Bitfinex traders’ LONG shows an increase in open interest since July 2025. Nonetheless, there were a few slowdowns, but the major drop that began on Jan 1 may have signalled the end of the uptrend. The number of long positions on Bitfinex dropped by over 3% before they resumed adding more positions.
There are several reasons to keep a close eye on Bitfinex whales. A closer look shows that the metric has trended against BTC’s spot price for years now. Using the 2024-2025 run as a case study reveals that when the longs decline started in late 2024, prices surged. However, when traders added more open interest, the price dumped in response.
The diverging trend between prices and open interest is due to whales cutting their positions as BTC surges. Hence, some investors who have monitored this chart for a while will conclude that the apex coin was gearing up for another massive uptrend when the chart prints red.
However, since Bitcoin started its latest decline, long positions have taken the hit. Liquidation on Tuesday alone exceeded $990 million. On Monday, the bulls lost $680 million.
The liquidations and spot price explain the recent increase in new long positions. Nonetheless, questions about the relevance of the BTCLONG to the current spot price remain unanswered.
BTCUSD LONG Nears 2022 High
The metric under consideration can tell when it’s a bear market. It reached its highest level in 2022, peaking at 109,764. Interestingly, the number of long positions at the time of writing is 71,107, almost 35% from the previous high.
Looking back at how the metric trended before 2020, indicates that BTC may be experiencing the bear market. The glaring characteristic of this period is the persistent price decline, which suggests prices may decline further, prompting traders to add more long positions.
In a nutshell, the BTCUSD LONG indicates that the bear market is here and the apex coin will retrace even lower in the coming days. Nonetheless, the asset may experience a short-term surge.
1-Week Chart Agrees With Bearish Bitcoin Predictions
Bitcoin is printing a bearish pattern on the 1-week chart. The chart shows the asset was in a downtrend from October to November. However, it resumed its uptrend the next month, surging and creating progressively higher lows.
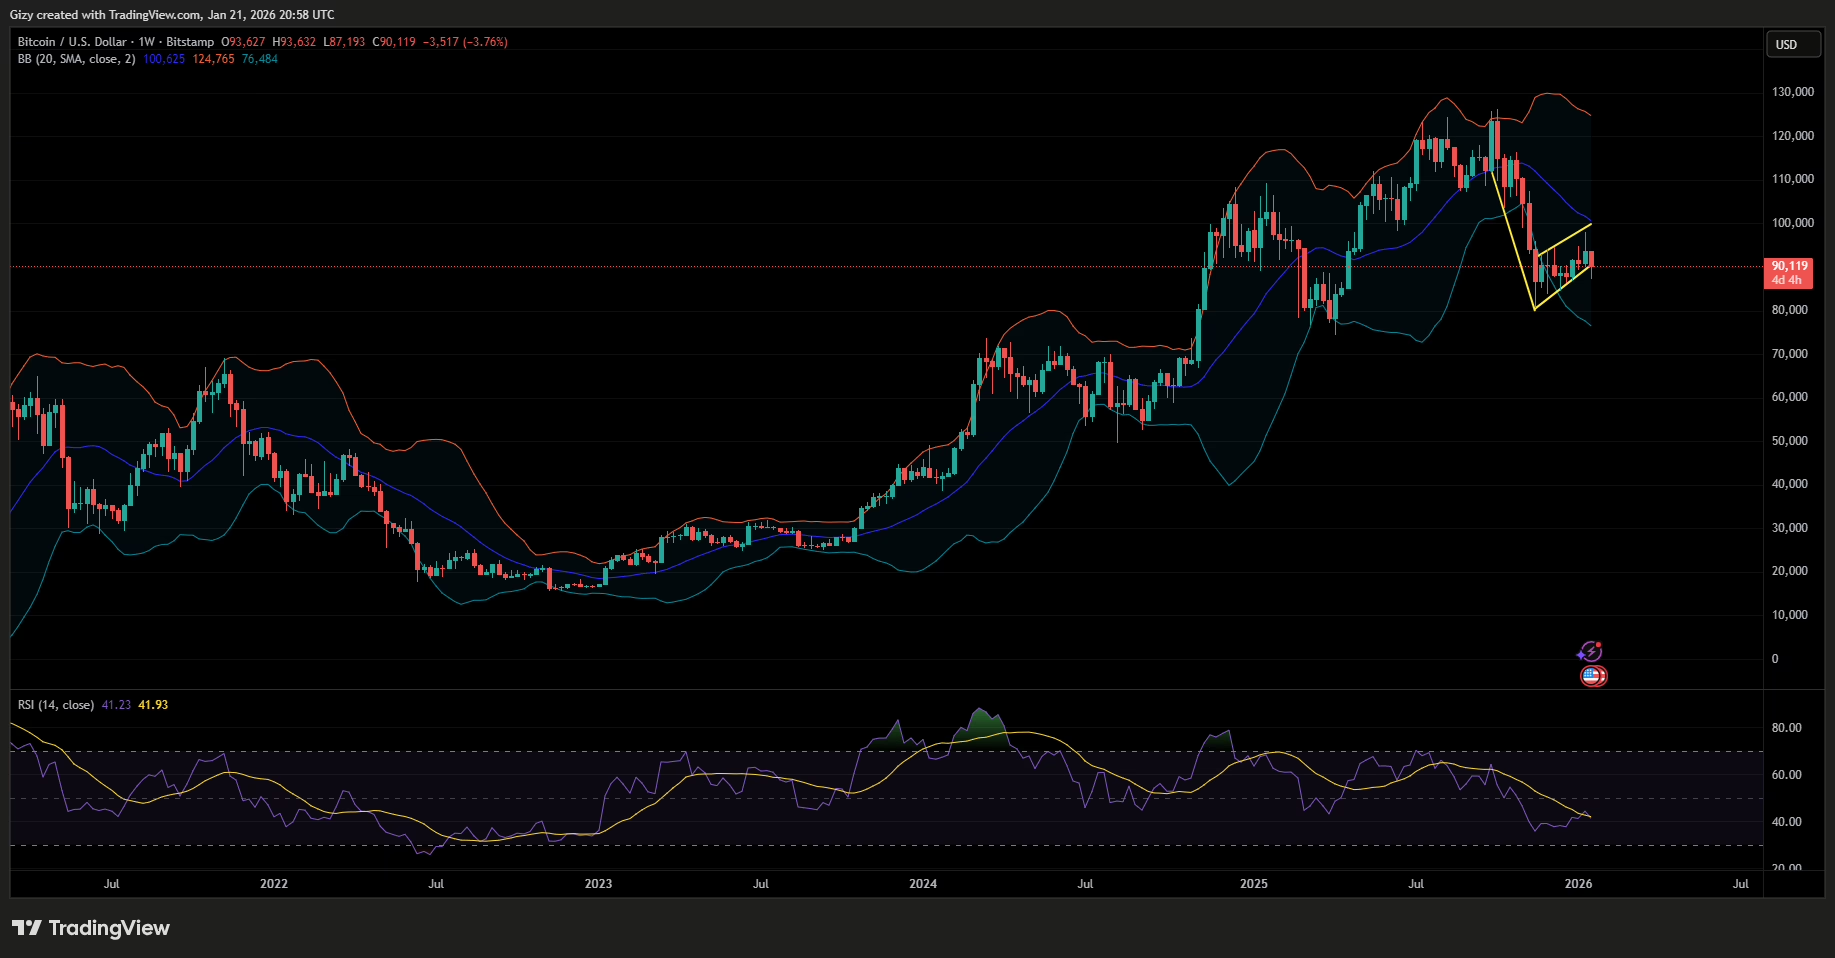
The earlier statement describes a bearish flag visible on the chart above. Nonetheless, there’s more. BTC broke below the pattern this week. Although it trades slightly higher than its low, it is still trading out of the mark.
Traditionally, a bearish flag forms during a downtrend, suggesting the relief rally is only short-term. After the small recovery, further downtrends would follow. Taking the bear’s flag into consideration, the apex coin’s recent breakout suggests that the downtrend is far over.
Nonetheless, investors would keep an eye on trading action next week as printing the next red candle below the pattern will confirm further decline.
While the chart hints at further decline, indicators suggest that a rebound may occur soon. For example, BTC tested bollinger’s lower band in November, bouncing off it. Since rebounding off the mark, the apex is expected to retest the middle band at $100k.
Additionally, the moving average convergence divergence prints a buy signal at the time of writing. A closer look shows a narrowing gap between the 12- and 26-EMA, indicating an ongoing bullish convergence.
However, neither indicator invalidates the bear flag (yet). A new red candle next week, below the pattern, would confirm further decline. Nonetheless, if that does not happen, the apex coin will continue trending within the pattern until it breaks out above $100k.
The bear flag only becomes invalid after Bitcoin flips $105k. In summary, the coming week will reveal whether the downtrend resumes or BTC surges to $100k before it does.


