
Bitcoin kicked off the third quarter with one of its strongest starts. Historically, Q3 is the least performing quarter of the year as the apex coin gains a little above 5% on average.
Nonetheless, July is the fourth least performing month of the year as the apex coin gains approximately 8% on average. In line with its usual performance, the apex registered massive gains over the last 30 days.
It is worth noting that BTC gained over 2% in June and is heading closer to registering gains exceeding 10% in July. The latest increase is unsurprising as a previous outlook hinted at it.
While taking into account the average gains in the seventh month of the year, the analysis predicted a surge above $115k. The write-up also took into account softening fundamentals as the U.S. trade war neared its end.
July had its fair share of positive fundamentals. One of the biggest events is the passing of the CLARITY Act and the GENIUS Act.
The U.S. House of Representatives voted to advance the bill on the 17th. It is worth noting that the voting process met significant opposition, as 217 voted in favour and 212 voted against it.
One of the major criticisms of the bills is their strong anti-central bank digital currency stance. Lawmakers asserted that this important piece addresses concerns about potential federal overreach and surveillance.
During the voting process, lawmakers were especially interested in the Clarity Act. The House Financial Services Committee chairman, French Hill, expressed satisfaction in a public statement while congratulating President Trump and Speaker Mike Johnson.
These actions had a profound effect on prices, fueling an uptrend.
Bitcoin Registered A New All-Time High
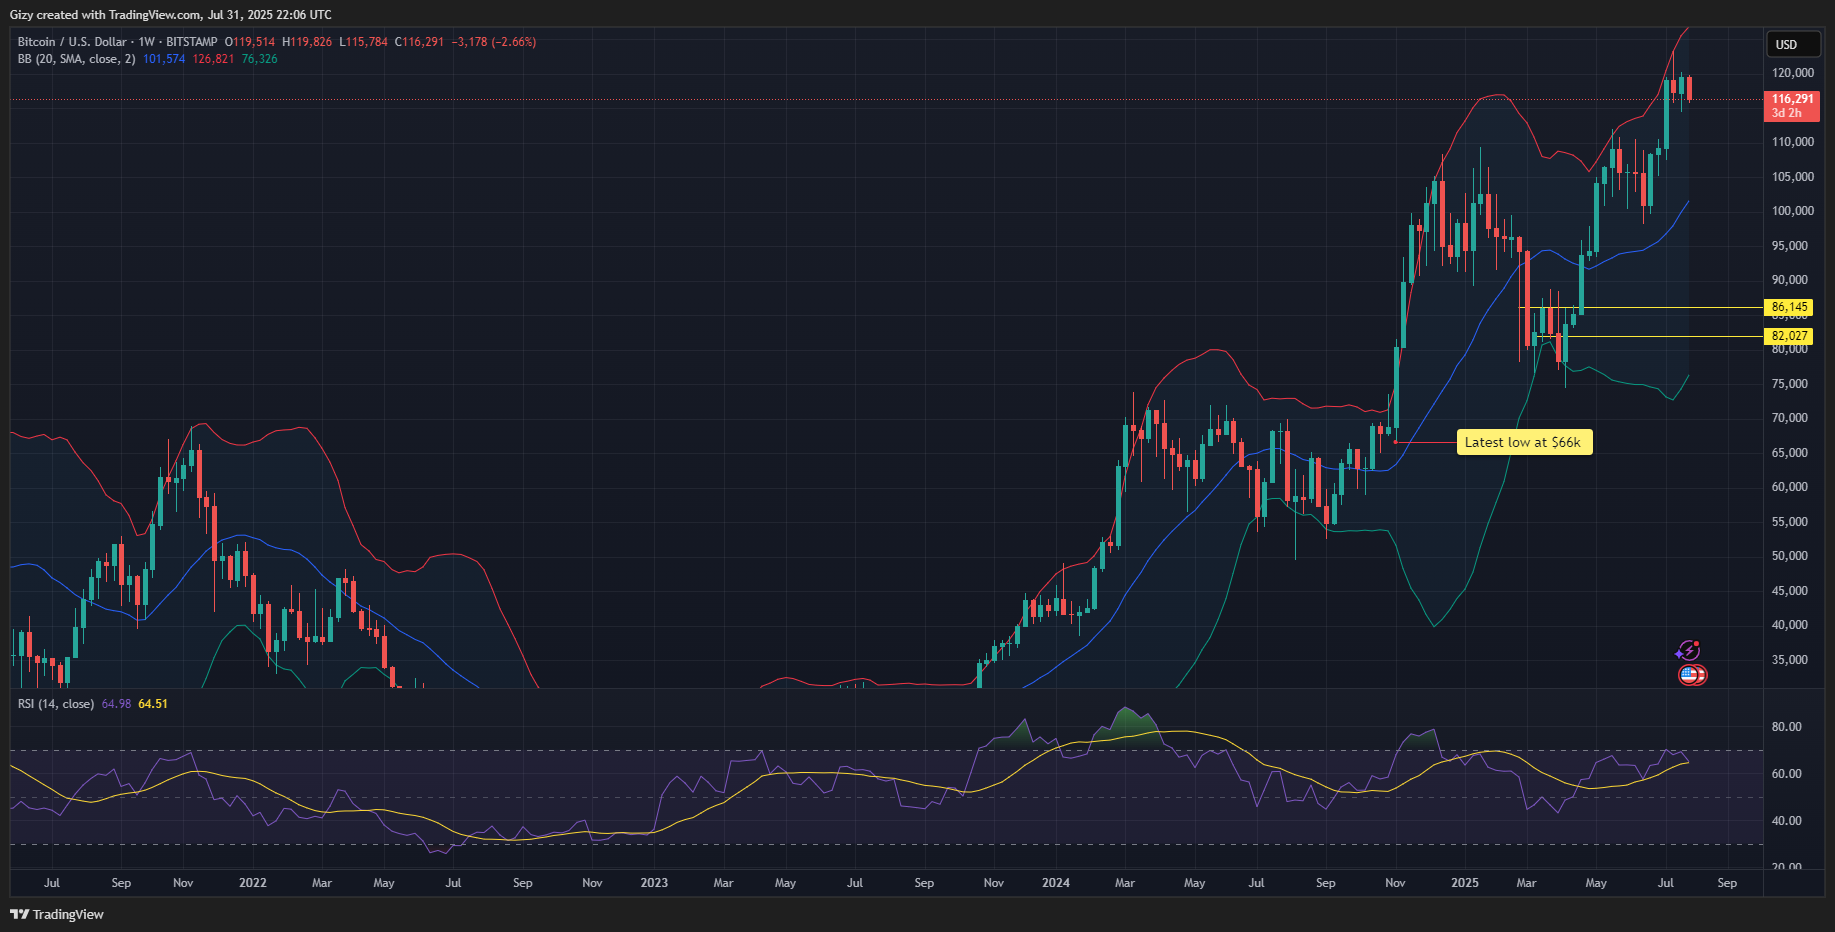
Breaking the charts down to the 1-week timeframe reveals that the apex coin registered significant volatility over the last 30 days.
The week starting July 7 was the most bullish as the asset surged from $109,231 and broke above the previous all-time high of $112,000. It is worth noting that BTC had a slight decline to $107k but rebounded afterwards.
Bitcoin continued upward as the week progressed, breaking above a predicted $115k but facing notable rejection to its bid at $120k. As a result, it saw slight corrections at $119,482.
The apex coin saw reduced volatility during the following week and closed with the first red candle after 3 weeks of consistent increases. Nonetheless, a closer look reveals a wick that extends above $120k.
The largest coin surged to $123,234 on July 14, marking its new all-time high. However, the bulls failed to sustain the uptrend, resulting in a slight downtrend. The buyers tried to reignite the run last week but failed as BTC closed with no significant increase.
The candle representing the current week’s price action notes that the apex coin is yet to register any notable price change. Nonetheless, a closer look at trading action over the last 3 weeks shows that the asset consolidated during this period.
Spot ETFs registered massive inflows over the last 30 days. Cumulatively, the investment funds registered their second-highest net inflow on a monthly basis. Exchange-traded funds saw an influx of $6.13 billion, sending the total net assets to $151.3 billion.
The week of July 11 saw the highest inflow. Investors bought $2.72 billion in U.S. spot ETFs. It is worth noting that this significant price spike preceded Bitcoin’s all-time high.
August: The Second Most Bearish Month
Bitcoin is entering a month with a history of massive losses. The 8th month of the year is historically the second most bearish month.
A look at previous price movements during August shows that BTC registered significant losses almost every year. Since inception, 14 years have passed, and the apex coin has failed to surge 9 times, ending the session lower than it started.
Its biggest loss happened in 2011 when it lost 32%. Nonetheless, it has also recorded notable gains, with the largest increase in 2017, gaining over 63%. It is worth noting that 5 of the past 14 Augusts ended in notable increases.
On average, Bitcoin loses 0.23% during this period, and the median range is -8.13%. The data indicates a high likelihood of massive losses this year.
A closer look at the previous trend suggests that the 8th month’s conditions worsened compared to July. For example, in 2024, BTC gained over 3% in July but lost 8.73% in August. In 2023, the coin lost 4% in July and 11% in August. In 2022, the coin gained 17% but lost 14% in the eighth month.
If these trends hold, the over 10% increase in the last 30 days will result in notable losses within the next 30 days.
Bitcoin Risk Plummets to 100k
Trading action over the last 3 weeks saw Bitcoin consolidate. It traded sideways with a few moments of massive decline. However, it has struggled to reclaim the $120k resistance.
It is worth noting that since it surged to a new ATH, the coin is yet to see a massive correction. This is due to consistent accumulation from institutional buyers. Recent data from Glassnode noted that 96% of the total Bitcoin supply is in profit. It also reported that the unrealized profit hit a new high of $1.4 trillion.
The sheer amount of unrealized profit increases the likelihood of a cascading effect of sell-offs that might be triggered by institutional selling.
Long-term holders who have held BTC for 155 days or longer are gradually flipping bearish. If the situation worsens, the apex coin will see massive downtrends. It may see a 5-10% decline over the next 30 days.
Indicators on the 1-week chart support this prediction. One surge is the relative strength index. The metric rose to a high of 70 during the first week of July. However, it has since been on the downtrend, with readings at 67% at the time of writing.
Previous price movement indicates that after Bitcoin is overbought in the 1-week chart, it sees a notable decline. RSI reading coincides with that of the Bollinger band.
The apex coin retested Bollinger’s upper band 3 weeks ago but retraced, following its failure to break above the metric. Previous price movement suggests that it will drop to Bollinger’s middle band in the coming weeks.
The readings from both indicators reinforce predictions of a 5-10% drop over the next 30 days. This would mean a slip to as low as $100k.


