Bitcoin surged to its highest level yet on Monday, reaching a peak of $123,236. It retraced after hitting this milestone, closing at $119,879.
Trading actions on the first day of the week set the tone for how prices are currently unfolding. The apex coin retraced to a low of $115,729 on Tuesday. Although it recovered, it failed to reclaim $120k. It registered brief success the next day, but was unable to end the session around it.
Bitcoin prints a doji at the time of writing, after testing the highlighted mark. It retraced lower but rebounded and is now trading at its opening price. The asset is heading for another close below $120,000.
Thursday will mark its third day below the mark. Nonetheless, questions about why BTC is struggling to break out are hitting new levels.
Data from CoinMarketCap shows a decline in interest in cryptocurrency. Trading volume is currently down by almost 5%. It is surprising, given that fundamentals are positive, especially with the passage of the GENIUS and CLARITY bills in the US.
Investors continue to accumulate at a decent pace, with exchange-traded funds seeing a notable inflow. Data from Lookonchain shows that the ETF registered a net flow of 6,930 BTC in the last 24 hours. The latest inflow is notably higher than the previous day’s, which was 3,412 BTC.
Why Is Bitcoin Stuck?
The apex coin is seeing massive selling pressure. A Bitcoin OG who had 80,009 BTC, worth $9.46 billion, moved 40,192 BTC, and many anticipate that the purpose of the transfer is to sell. The whale previously transferred some units to exchanges and shows no sign of halting its actions.
Data from Glassnode reveals that the largest cryptocurrency is trading above its 95th quantile. A surge above the mark may trigger massive profit realization by a large number of holders. The trend is unfolding at the time of writing.
However, one group of holders is leading the charge. The percentage of short-term holders’ supply in profit was 95% when the apex coin attained its all-time high. The reading is higher than the long-term holders in profit. Such profit from the aforementioned group is pushing them to sell.
Reports from Coinglass show that more traders are banking on further declines in the derivative market. Short position accounts for more than half the open trades at the time of writing. The trend is noteworthy as it mostly correlates with notable price moves.
The bulls accounted for more than half of the open positions in the derivatives market. BTC surged to an ATH as a result. Trading action in this sector is a contributing factor to why the apex coin is stuck.
What Will Happen Next?
The 4-hour chart indicates that the apex coin is currently in a range-bound movement. It registered slight price changes due to low volatility on this timeframe.
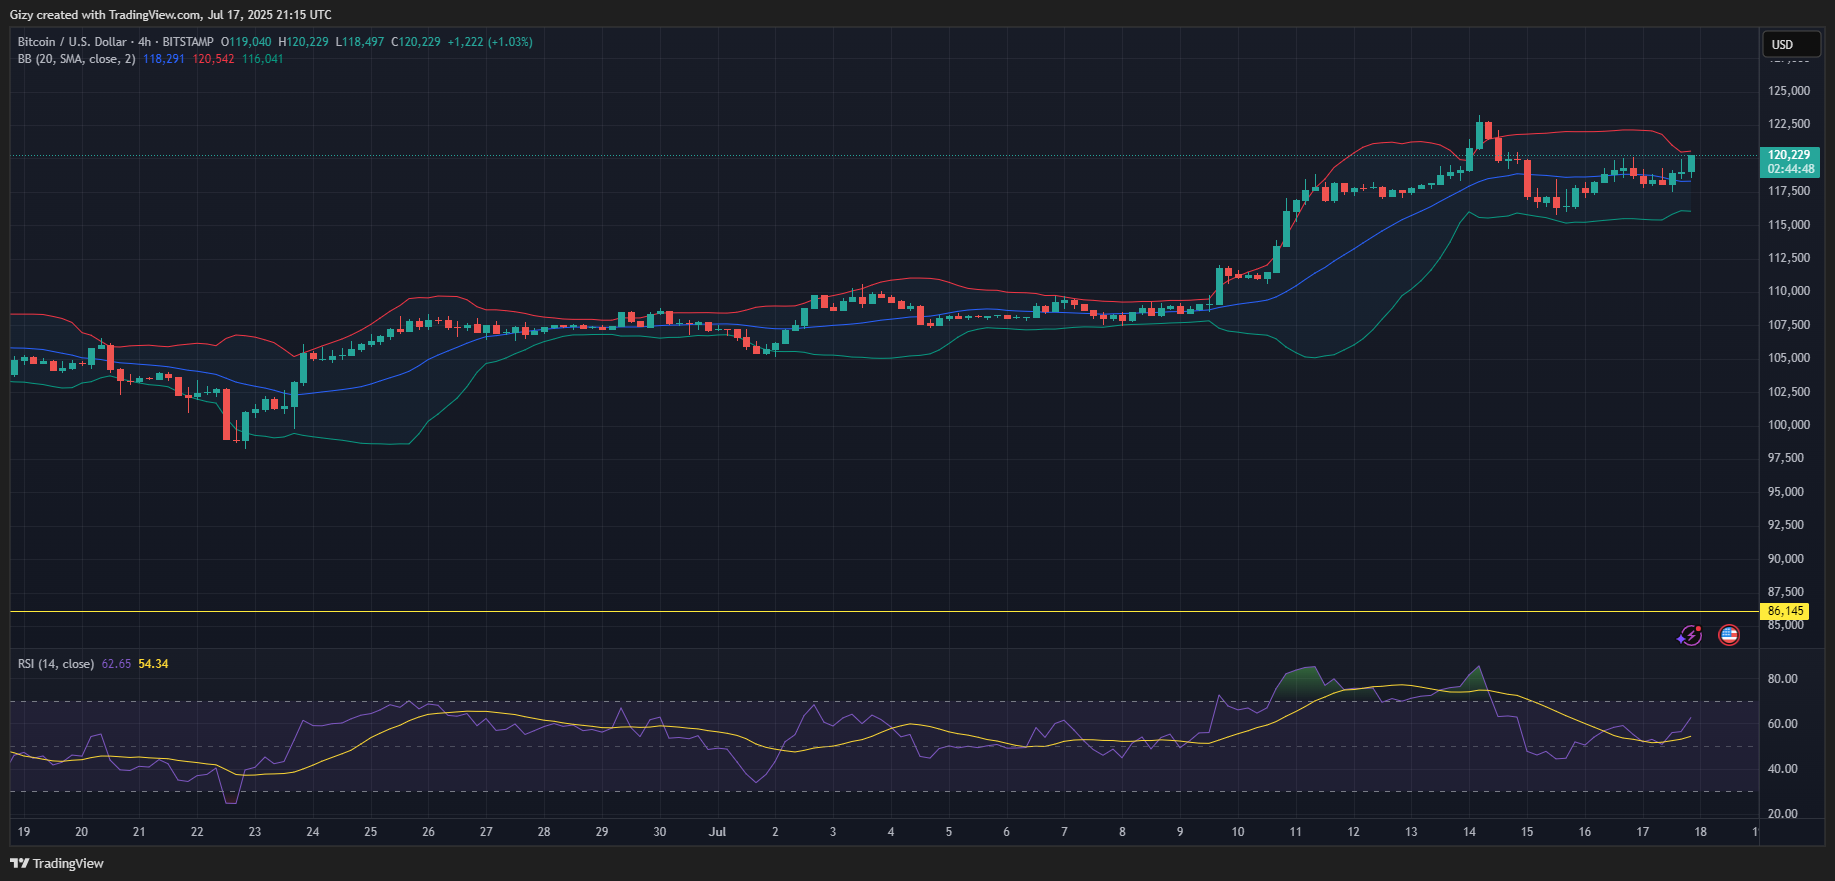
The bollinger bands is reacting to the latest trend. It is constricting as the gap between the upper and lower bands tightens. The pattern mostly indicates an impending breakout. However, the indicator is silent as to when the breakout will happen.
The relative strength is at 57, indicating that there is room for an upward swing or further decline.


