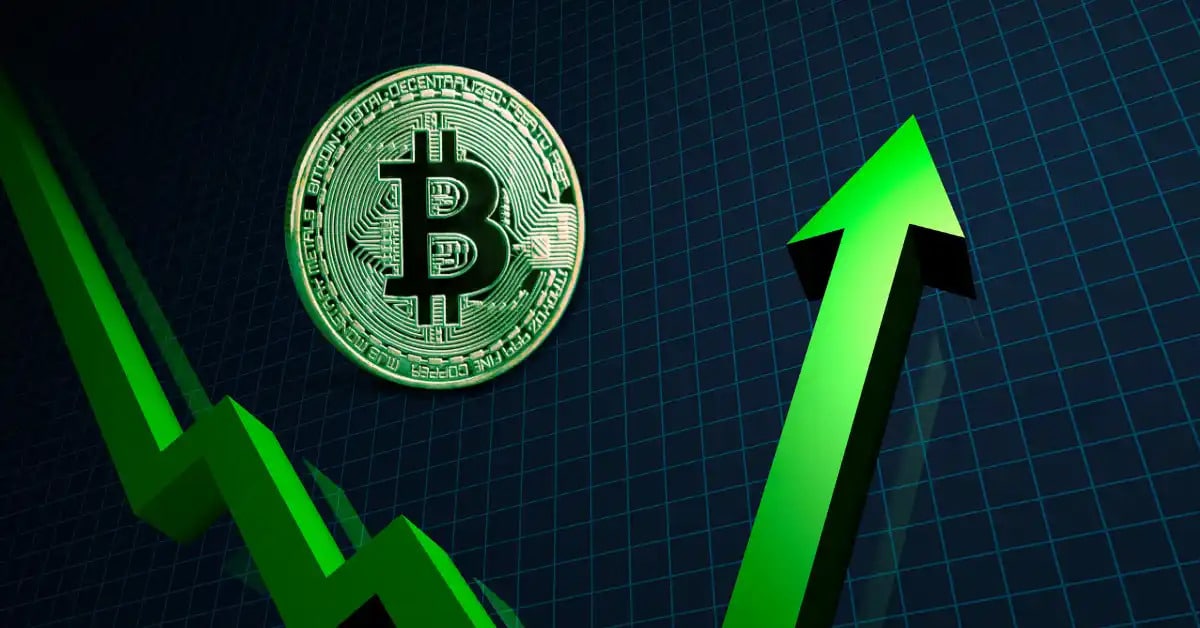
Bitcoin attained a fresh all-time high a few hours ago. It opened Wednesday at $106,891 and surged after a brief decline.
The 2-hour chart shows the quick rise from $107,348 to $109k. It broke the mark for the first time since January and peaked at $109,874. Its latest high is over $500 higher than the January ATH.
BTC’s most recent all-time high caught many unaware as the bears lost massive figures in the derivatives market. Short positions worth over $50 million were liquidated in 60 minutes. The total liquidated short positions exceed $135 million in the last 24 hours. Total rekt capital on Bitcoin is more than $155 million, as long positions lost over $21 million.
Why Did Bitcoin Surge?
The apex coin continues to see more uptrends as fundamentals remain positive. The week started with the news that the US Senate advanced a bill to regulate stablecoins. Investors saw the move as an important step in regulating the entire crypto market and landscape in the United States.
JPMorgan Chase unexpectedly announced that it would allow its clients to buy Bitcoin but would not provide custodial services. The announcement is surprising, as it comes a few days after the CEO voiced skepticism about the asset.
It is worth noting that investors are hopeful that the US and China will restore their trading relationship after both nations reduced tariffs. The market is slowly seeing more liquidity inflow as trading of massively volatile assets increases.
SoSoValue indicates that the bullish sentiment is present around ETFs. Exchange-traded funds saw a massive inflow of $667 on Monday, the highest since May 5. The inflows continued on Tuesday with an over $329 million in buying volume.
Data from CryptoQuant shows BTC is seeing massive buys at the time of writing. Exchange reserves dipped by 0.33%. Trading on the derivatives market is increasing as the open interest grew by over 10% in the last 24 hours.
Transactions in the apex coin surged with an increase in active addresses. Receiving and sending saw notable growth.
Will the Uptrend Continue?
A previous analysis pointed to an impending golden cross. It pointed to the uptrend the 50-day moving average is having. It closed the gap between it and the 200-day MA following the latest price increases. A cross will result in further price increases.
The surge above $109k saw it break above the second pivot resistance. However, it lost the mark and trades below it at the time of writing. The apex coin remains above the first pivot resistance, which means it has more upward potential.

Nonetheless, the moving average convergence divergence prints sell signals amid the milestone. Since Saturday, the 12-day EMA has trended close to the 26-day EMA. While the metric may not signify a clear direction for the next price action, a closer look shows that the shorter EMA trades beneath its counterpart.
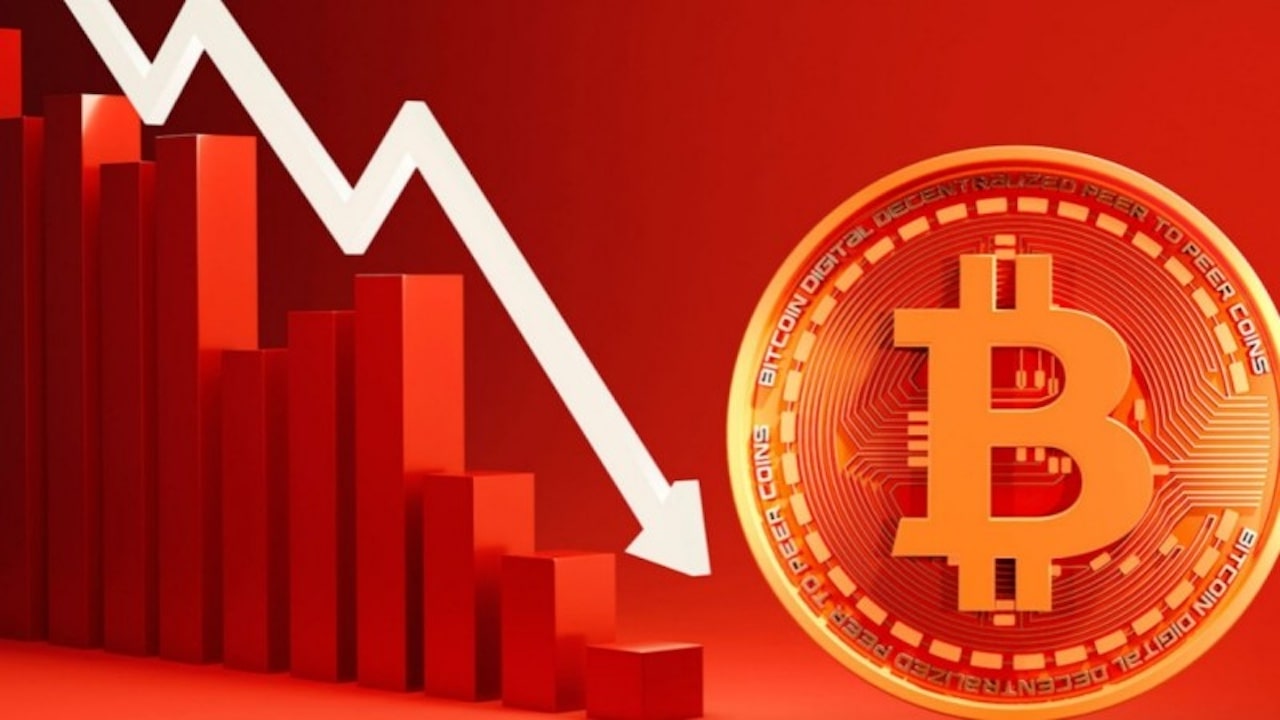
It is worth noting that the apex coin is overbought and due for correction. Data from CryptoQuant shows that investors expect this outcome as short positions increased by over 3% in the last 2 hours.
Bitcoin risks a decline to $102k if the ongoing selling pressure continues. Conversely, it will break above $110k in the coming day.


