Bitcoin dropped to its lowest value in August following another round of massive selloffs. The plummeted on Friday, displaying the opposite of how prices played out last week.
The apex coin has been on the decline since the early hours of the day. The 4-hour chart shows no significant green candles; the bears continue to maintain selling pressure. However, a look at the 1-day chart shows that the coin is seeing an even steeper drop than on Monday.
The asset is down by over 4% and is edging closer to ending the day with massive losses, the level not seen since April. Nonetheless, BTC retraced from $112,581 to a low of $107,586. A sweep through the charts shows that the coin is revisiting this level for the first time since Jul 4.
Bitcoin’s latest retracement comes at a time when many expected a recovery following the previous losses. However, the dip sparked notable discussions, with the calls of market manipulation growing again.
Nonetheless, the derivatives market is teeming with activity as some struggle to keep their positions open. Traders lost over $543 million in the last 24 hours, with the bulls accounting for $449 million of that loss. The second-largest liquidation occurred on Bitcoin, with rekt capital exceeding $149 million.
However, questions about what caused the dip hang in the air amid several speculations. Donald Trump recently announced new tariffs on Friday, targeting a small number of shipments this time. The tariffs are back after a several-month hiatus.
PCE Concerns
The personal consumption expenditures are the metric the Federal Reserve uses to track inflation. The core PCE was released on Friday, and the figures raise huge concerns. July PCE inflation rises to 2.6%, in line with expectations of 2.6%.
Nonetheless, core PCE inflation rose to 2.9%, its highest since February 2025. These are signs that inflation is rising. While traditionally, these figures are supposed to create doubts about a rate cut in September, it is almost certain that a rate cut is coming.
However, fears of a rise in the prices of several commodities, in addition to the latest tariff, are causing selloffs across the market.
Will Bitcoin Rebound?
The 1-day chart shows that the apex coin is seeing slight buybacks at the time of writing. However, the rebound is not significant as the threat of further decline remains high. Nonetheless, this does not erase the likelihood of a notable pullback.
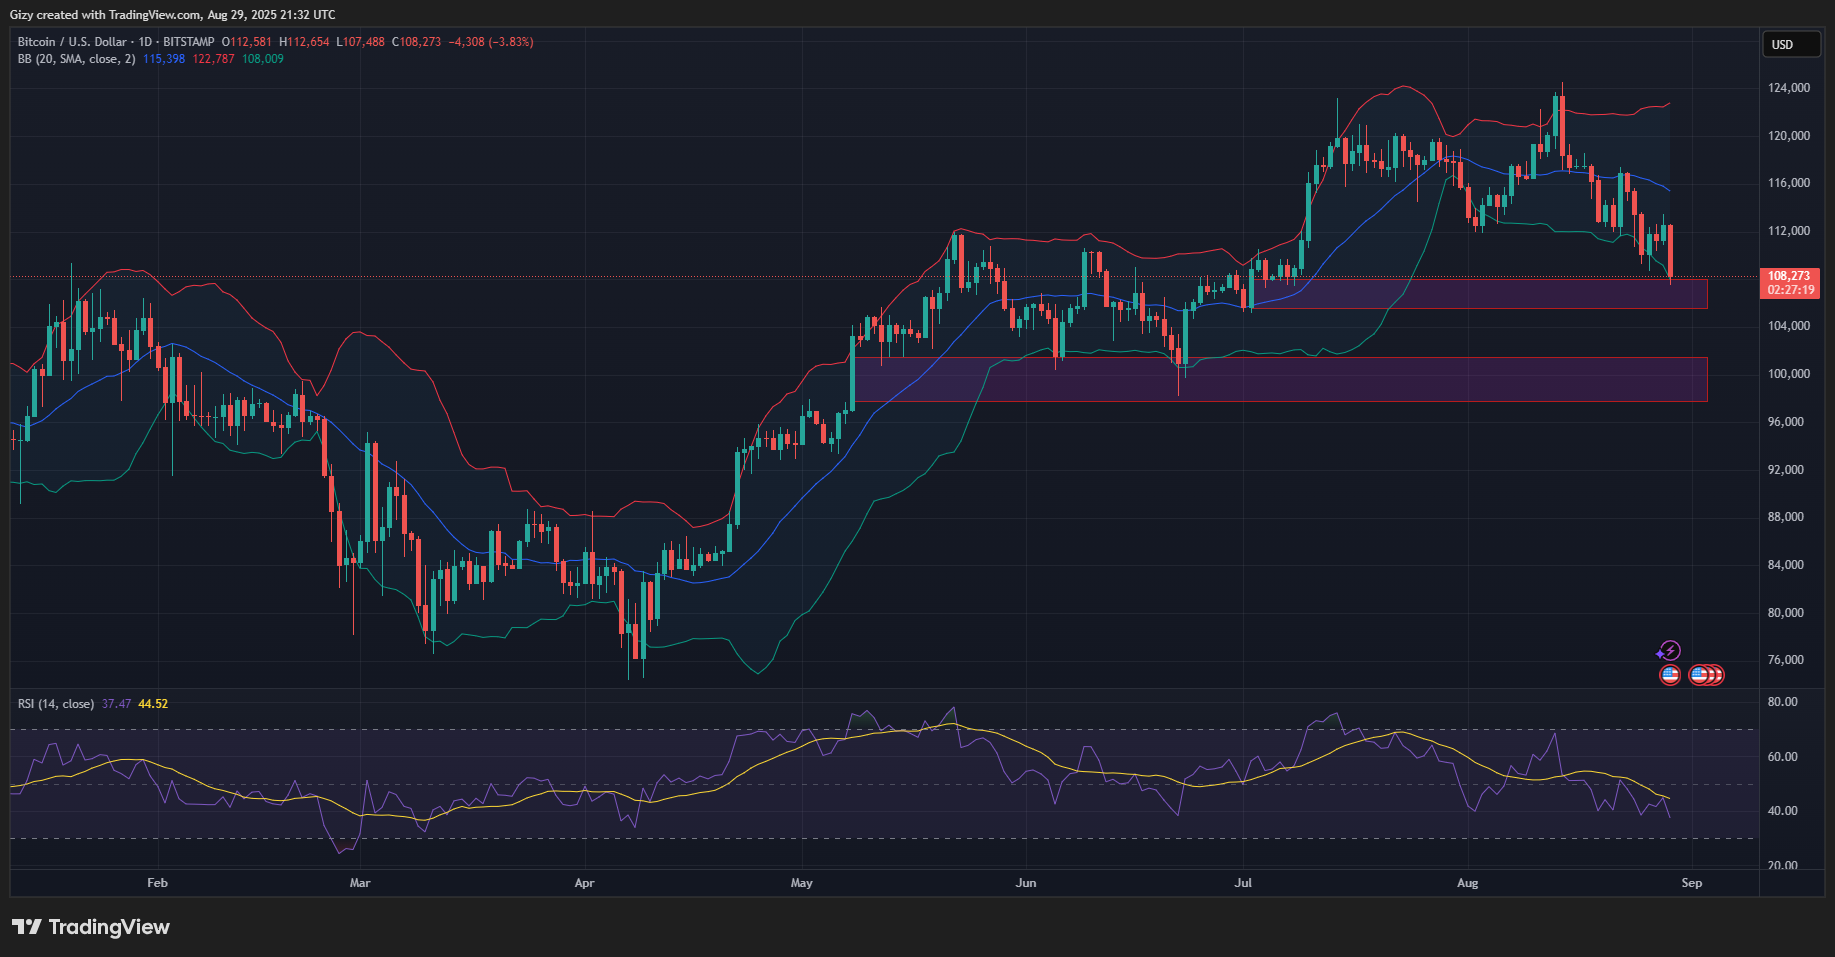
The chart above shows that Bitcoin is trading within a demand zone, stretching from $108k to $105k. A closer look reveals that the asset surged above this level in the first days of July. The coin will likely rebound around this mark.
Adding to the assertion of a possible pullback are the Bollinger bands. BTC broke above the indicator a few hours ago, which mostly signals the end of a downtrend.
However, if the bulls fail to defend this mark, Bitcoin will drop to the next zone spanning from $100k to $98k. The relative strength index suggests that such a slip is likely, as the metric stands at 37, indicating room for further decline.
Nonetheless, in the event of a rebound, BTC may encounter notable selling pressure at $110k.