Chainlink has been on the rise over the last thirty days. It broke several levels since starting the climb, retaking key price levels.
One such uptick started on Thursday when the asset surged above its seven-day high from $24. It broke the $27 support and continued upward, hitting a high of $29.5. It gained over 20%, closing at its peak. The close resulted in the asset continuing the surge the next day, breaking above $30
LINK momentum after the surge, retracing and closing at its opening price. A repeat the next day as the asset had significant resistance to its bid above $31. Nonetheless, the asset is heading for another green close on the weekly scale.
It erased Monday’s losses, which saw it dip from $26 to a low of $19. Currently up by over 8% over the one-week timeframe, it marks its fourth consecutive week of notable gains.
The most significant drivers of the uptrend were fundamentals. One such example is the large purchase of Donald Trump’s World Liberty Financial. The firm announced the purchase of over $1 million LINK and other assets. Many believe that the latest announcement was an affirmation that the President-elect supports the cryptocurrency.
Coinbase announced a collaboration with Chainlink a few days ago. The exchange’s Project Diamond is integrated with the crypto project. Both institutions claimed that the integration would provide data and enable complete lifecycle management of new tokenized assets on the platform.
The chart shows that the asset’s trading volume significantly increased over the last seven days. As of Dec. 13, it peaked at $5.6 billion. Nonetheless, the build-up also happened on Dec. 3, with volume hitting a high of $12 billion.
An Impending Dull Start
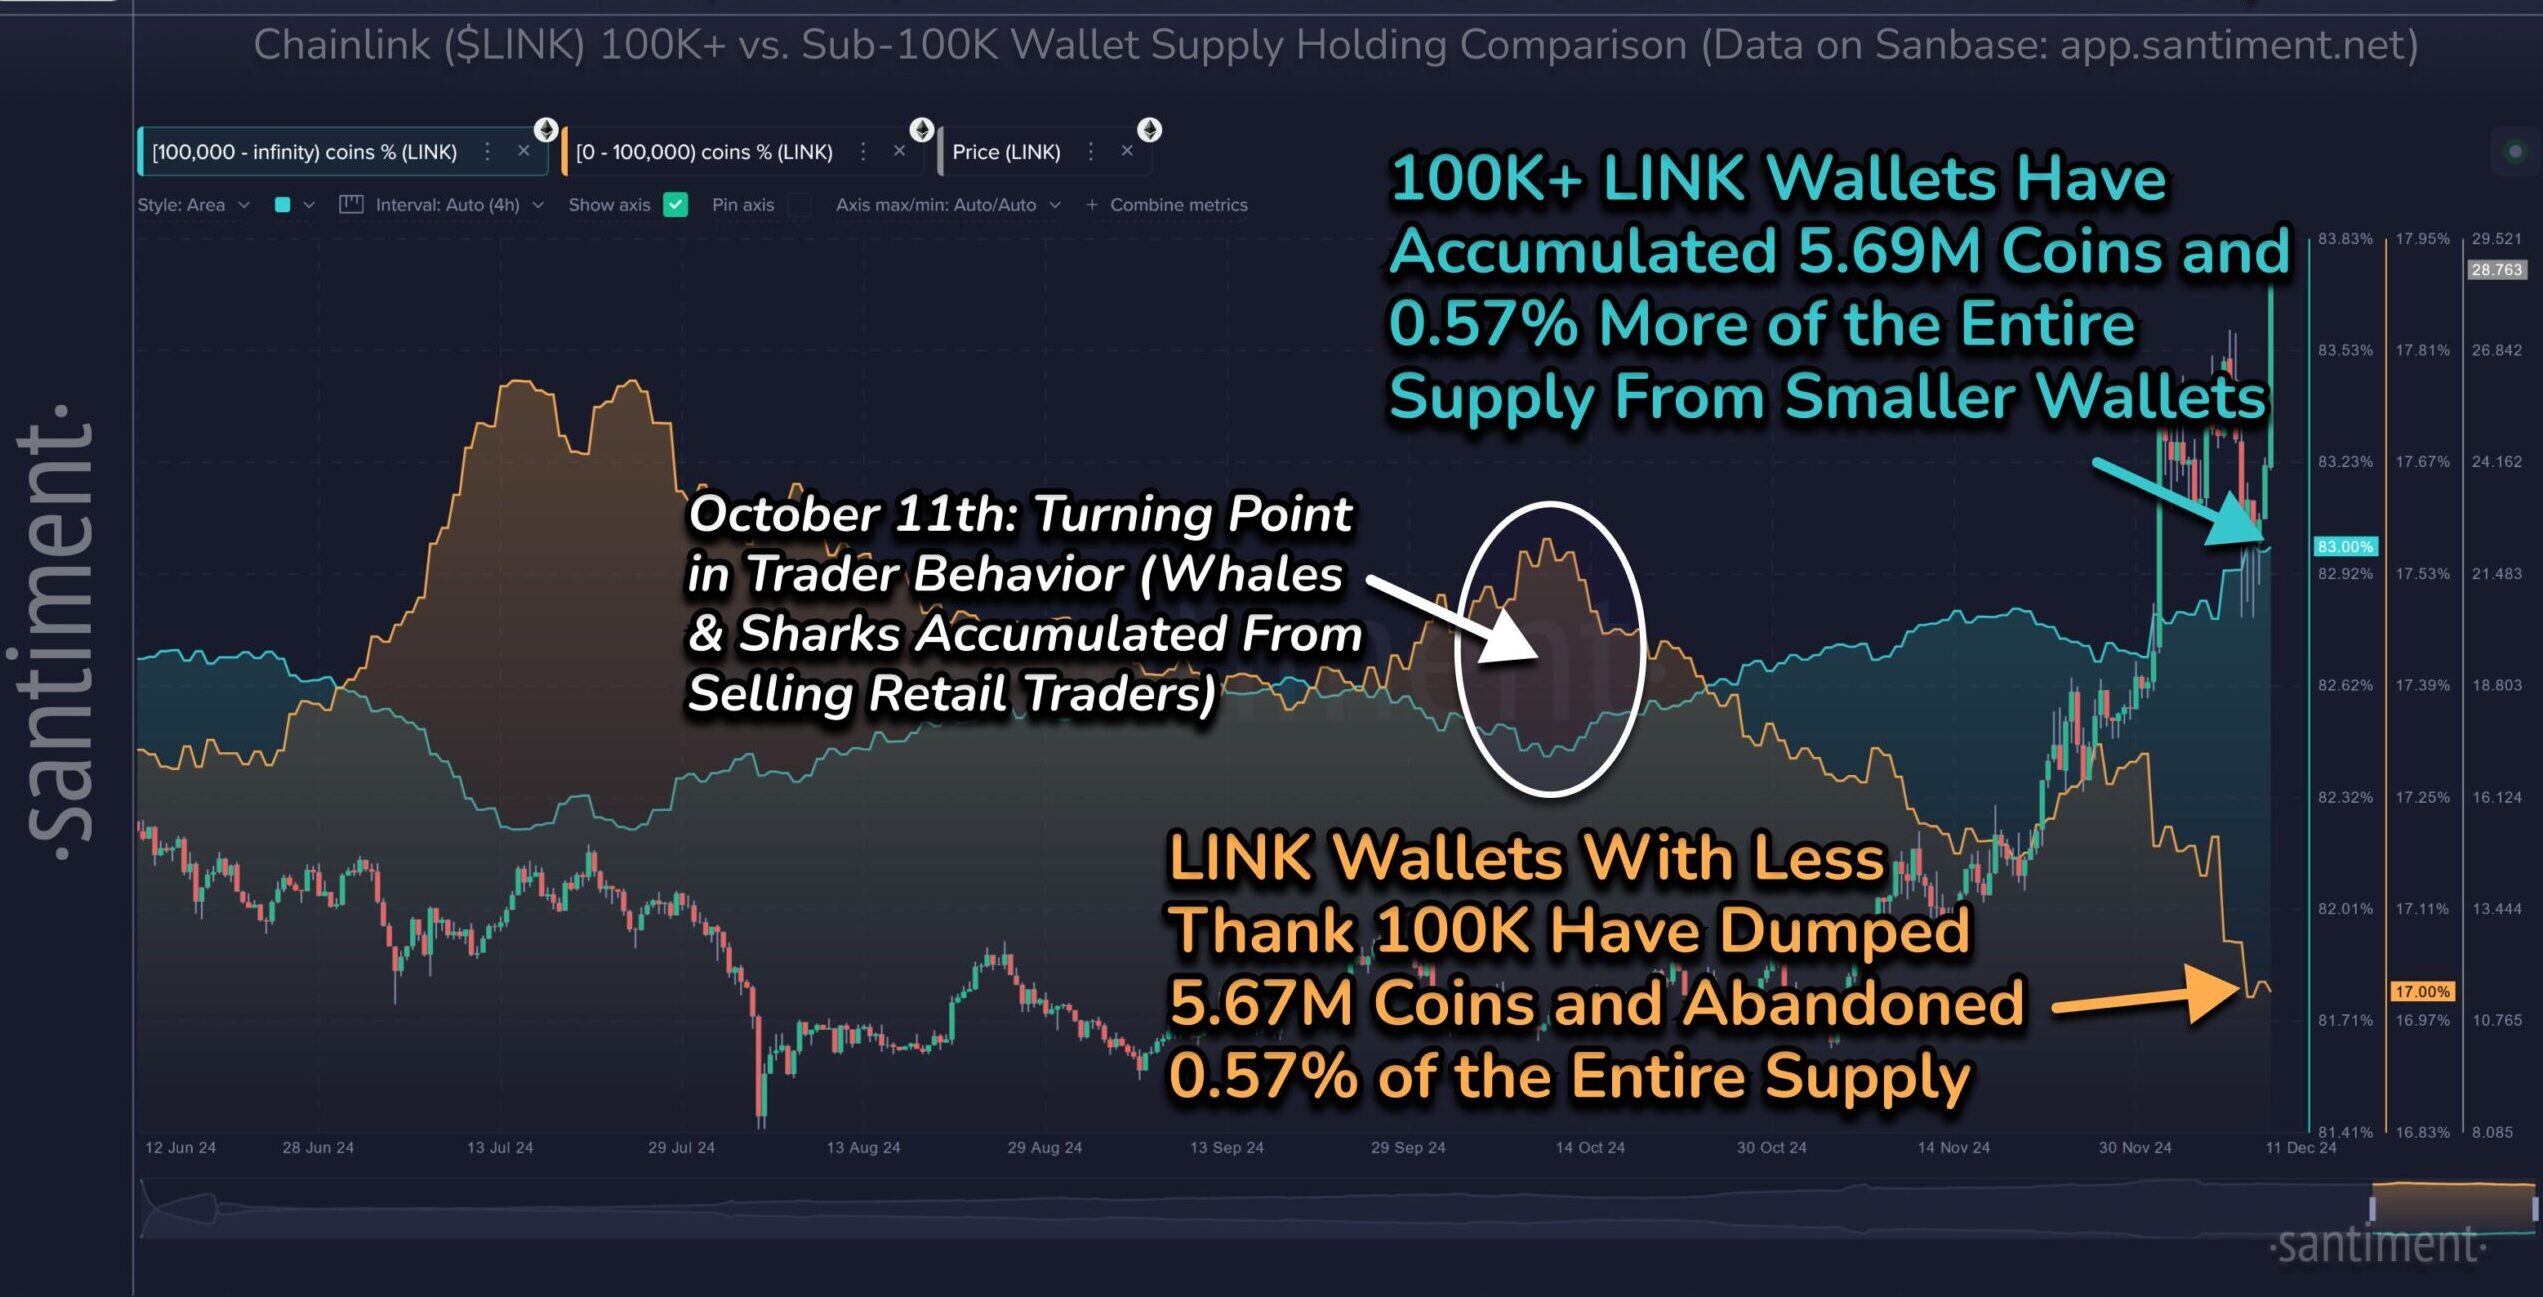
Data from Santiment shows that Chainlink always starts the week slightly slow, with no notable movements. The image below from sentiment data shows that the asset sees small price movements at the start of the week.

The chart above shows a few changes as the seven-day session progresses. It hints at a dump from wallets holding less than 100k LINK. This means that most notable small investors sell off their assets before a significant pump.
The selloff could be due to low bullish sentiment. After the dump, the whales scooped up the excess supply, causing the price to surge.
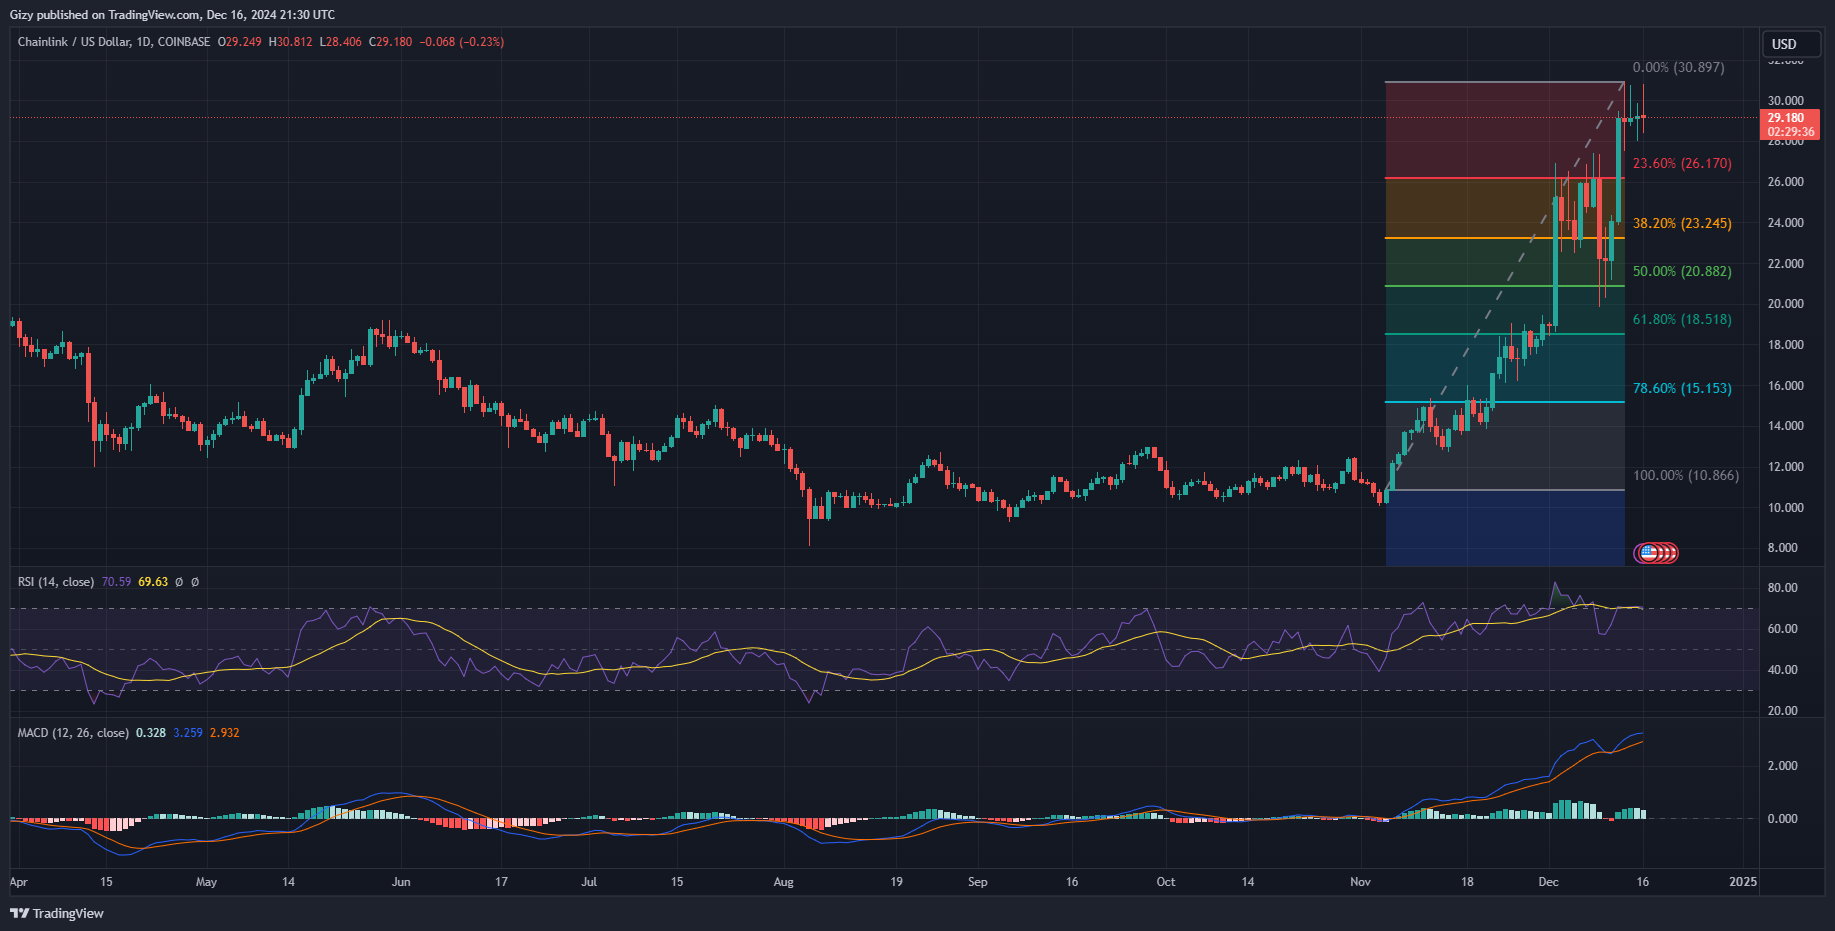
Chainlink has since struggled to continue its uptrend following its failed attempt at $31. The one-day chart shows that the asset registered dojis over the last three days and may close another. The ongoing trend indicates strong selling congestion around the highlighted barrier, creating ideal conditions for a possible whale scoop.
Chainlink Aims for $35
Previous price movement shows that the asset may be gearing a major breakout following its most recent price performance. A period with a semblance to the ongoing trend was between Nov. 23 and Dec. 1. The asset failed to register any notable change in value during this timeframe but had a massive breakout afterward.

Nonetheless, the slow price movement may result in a dip. One recent case happened on Dec. 9, as the altcoin had low volatility compared to the previous sessions. In either case, a breakout is imminent.
Indicators on the one-day chart suggest that the asset is closer to a massive retracement. The relative strength index shows that LINK is overbought, as it trended above 70. It is due for a significant correction. The Fibonacci retracement level points to a possible decline to $26. Losing that key level may result in a drop to $23.
Nonetheless, the moving average convergence divergence shows that the asset maintains notable bullish sentiment. The constant attempt at the $31 barrier indicates that it is close to a breakout. It may break above $31 and attempt the $35 barrier.
