
Bitcoin is trading at $66k at the time of writing. The coin started the day at $61,500 but prints one of the longest candles on the charts.
The latest surge comes barely a day after the asset lost all of its accumulated gains and printed a doji on the weekly scale. Currently up by over 7%, some traders fail to recognize the trigger for the latest price rally.
Consumer Price Index Came in Lighter
Recall that a previous analysis stated that the coin is set to experience significant moves from two major catalysts, the producer price index and the consumer price index. The PPI dropped during the previous intraday session but failed to have any effect on the prices of various assets.
The main metric many looked forward to is the CPI which recently dropped. The release will dictate possible actions on interest rates by the feds. It came out at 0.3%, which is significantly lower than the expected value. This also hinted at a possible rate reduction from the feds this year.
This marked the first time in three months that the consumer price index fell lower than expected. While many expect this trend to continue, others are looking forward to June’s FOMC meeting.
ETFs are Picking Up
Bitcoin ETFs are gradually picking up. Previously, several traded funds registered severe dumps as traders withdraw from them. However, the trend is changing. These funds are seeing funds inflow as investors keep buying.
In the last two days, the exchange-traded funds saw an inflow of more than 160 bitcoin. The latest data shows that it has wiped the May 9 and 10 losses.

The image above shows the continuation of the trend during the current intraday session. The investment firms saw an increase of 2,100 BTC, which is worth $135 million. This brings the seven-day net inflow to 1,408.
The latest increase in fund influx comes amidst the ongoing dump of the Grayscale Bitcoin Trust by investors. It shows that the market is moving past the company
Bitcoin Price Outlook
Bitcoin has seen a lot of bullish action during the current session, and several indicators have flipped bullish. One such are the exponential moving averages.
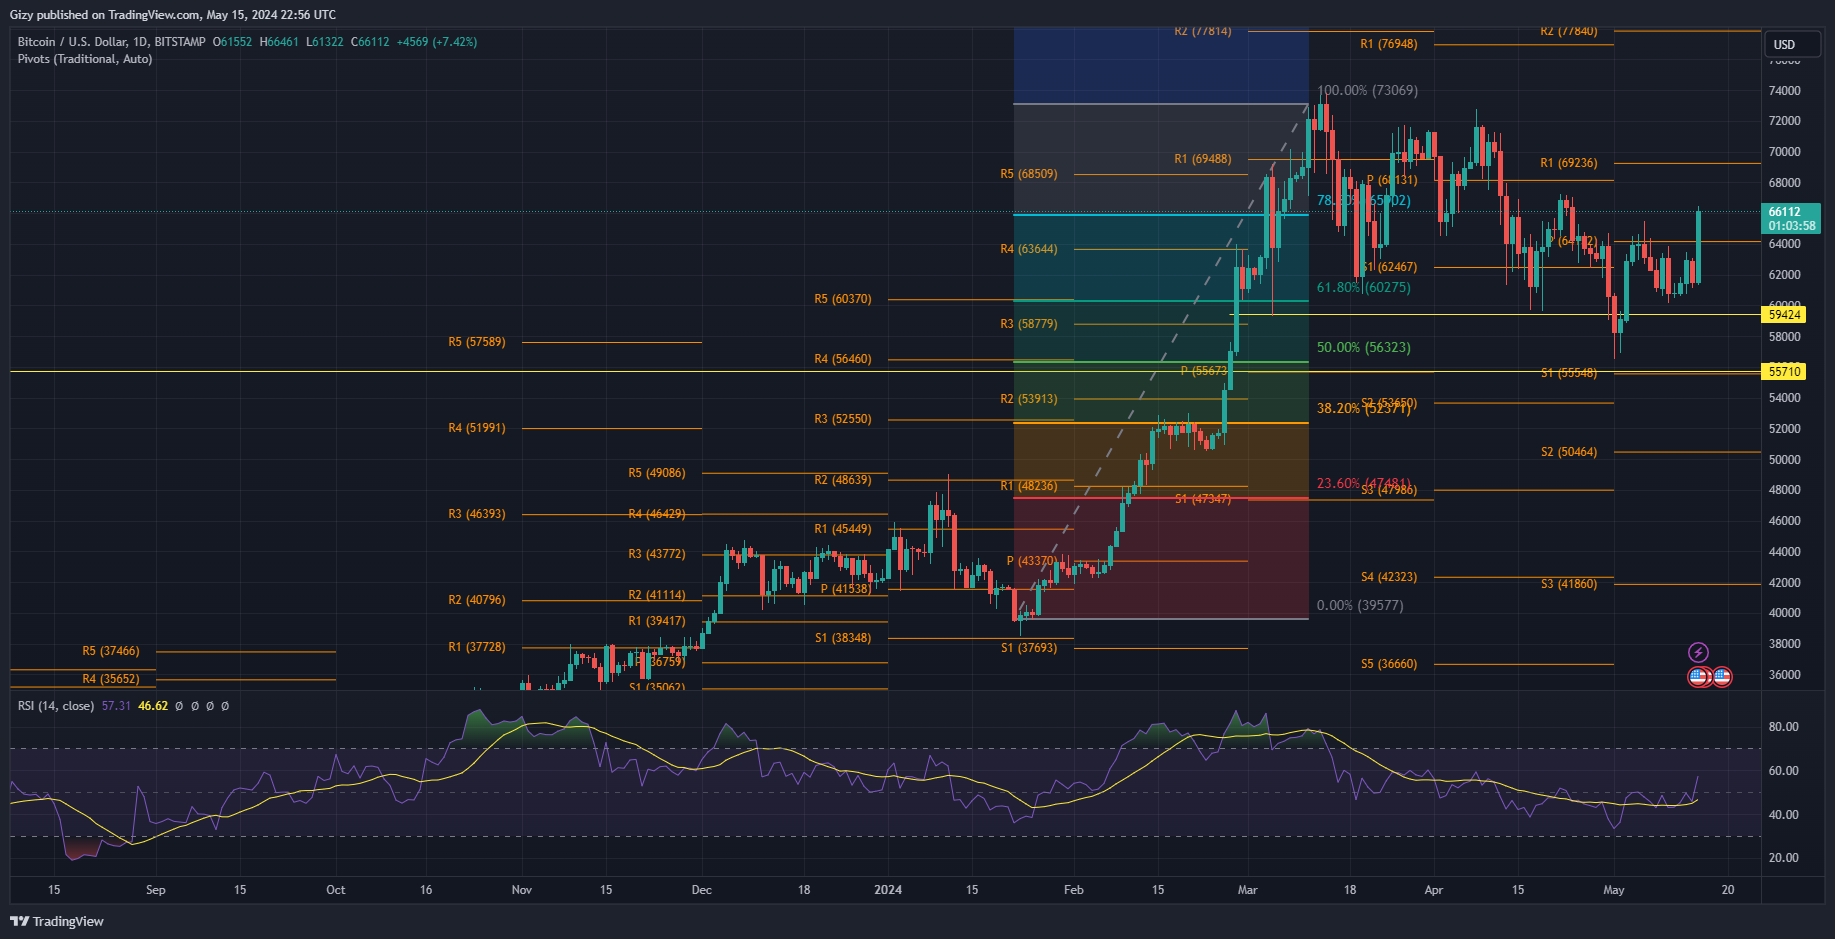
The coin traded below the 50-day EMA over the last seven days. This opened speculation of it flipping the 100-day EMA as the metric served as a critical support. However, with the latest surge, the apex coin decisively flipped the 50-day EMA. It has also climbed above its pivot point at $64k. A close above the mark will result in further climbs.
Nonetheless, the moving average convergence divergence is printing buy signals at this time. The 12-day EMA is on the uptrend following a close rapport with the 26-day for most of the last two weeks. The latest change in trajectory reaffirms the bullish divergence. Additionally, the relative strength index is on the rise. It surged from 45 to 57, giving the bulls an advantage.
With the most recent bullish reading from several indicators, BTC is set to see further increases. One of the levels it will attempt in the coming days is the first pivot resistance at $69k. However, since flipping the pivot point, the bulls may accumulate above it.
The Fibonacci retracement adds to the support at the present price. The apex coin is trading above the 78% Fib level. Although not one of the critical levels, it offers a level of demand concentration. Currently at $65k, the coin is at a level some analysts call the make-or-break mark.
Bitcoin must continue to trade above the 78% fib level to test $69k. However, a slip below the critical level will result in a drop to the previous lows.


