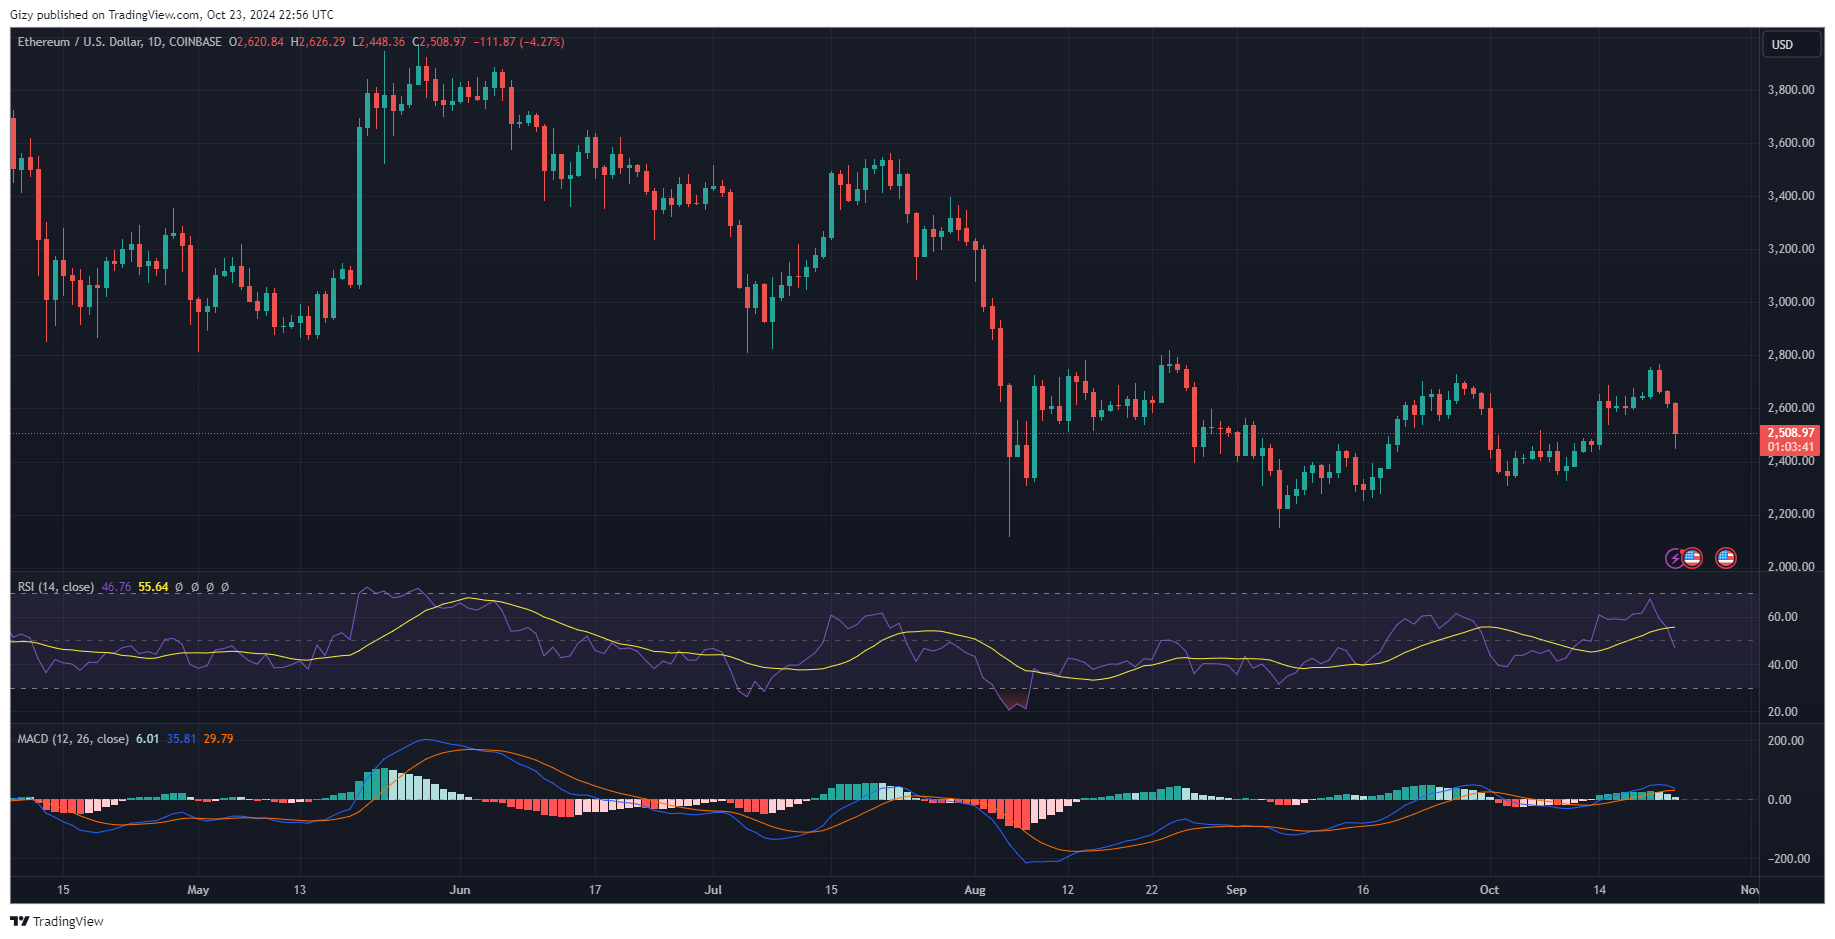
Ethereum continue its decline with a 5% drop over the last twenty hours. It started the day at $2,620 but saw a spike in selling pressure, resulting in the asset losing the $2,600 support and hitting a low of $2,482.
The latest dip continues the downtrend that started on Monday. The apex altcoin started trading at $2,747 but dropped to a low of $2,653 and closed with losses of almost 3%. The drops continued into the previous intraday session, dipping and retesting $2,600.
The most recent downtrend comes after the coin had notable uptrends last week. It ended the session with gains exceeding 11%, attaining its peak on Sunday. It opened trading at $2,647 but surged as buying volume spiked.
Ethereum hit broke the $2,700 resistance for the first time since August and hit a high of $2,758. Although it had small corrections, the day ended with gains of almost 4%.
The latest declines barely weeks after the Ethereum co-founder outlined fresh goals for the blockchain. He highlighted that the ecosystem must be able to handle over 100,000 transactions per second on L1 and L2. He also wants better interoperability between all layers, making Ethereum “feel like one ecosystem”
Coinbase Premium is Negative
The ongoing decline comes as the asset is seeing massive funds outflow from key regions. For example, traders in the US are currently bearish and selling off their assets. ETH is seeing less inflow from this region. This is the same sentiment with traders in Korea.
Nonetheless, EFTs and other products are seeing notable inflow as the funds premium is positive. Inflow from the US into this instrument exceeded $10 million over the last 24 hours.
Exchange reserves are declining amidst the massive downtrend. The netflow total suggests that fewer traders are moving their assets from cold storage to sell. Many analysts believe that the trend is cushioning the ongoing price decline.
The bulls are also scrambling to keep their long positions open by adding more funds, which is increasing the funding rate. Nonetheless, the bears are having a field day as liquidation on long positions exceeds $62 million over the last 24 hours.
Onchain indicators like the relative strength index and stochastics are currently neutral. This comes after they showed that the asset was overbought. The current reading shows that the downhill movement may end.
Ethereum May Retest $2,400
Indicators on the one-day chart show that the apex altcoin may see further declines in the coming days. One such is the moving average convergence divergence. The 12-day EMA is declining and will intercept the 26-day EMA in the coming day. Trading conditions will worsen as the bearish convergence nears completion.

The relative strength index points to volume as the reason for the latest downtrend. It dropped from 67 on Monday to 46 at the time of writing as selling pressure mounts. The same sentiment is present on the average direction index as it heading downward. The trajectory is because of the massive drop in momentum.
Nonetheless, the Bollinger bands indicate the reason for the latest downhill movement. The apex altcoin broke out from the upper band on Sunday. A break out only happens at the peak of the uptrend, which means the bulls will get exhausted. This played out starting Monday. The latest declines may halt after the asset slips below the middle band.
