TIA bulls resumed the uptrend during the previous week, resulting in massive value increases. The altcoin almost doubled in worth, hitting a critical price level.
The highlighted asset is one of many that experienced significant surges. Another example is SAND. It started trading at $0.34 last week but retraced to a low of $0.32 before rebounding. Following the rebound, it shot up, breaking $0.55. It broke above $0.80, peaking at $0.82 and closing with gains exceeding 122%.
MANA resumed its uptrend following notable declines two weeks ago. It opened trading at $0.39, surging after a brief decline. The altcoin broke above its six-month high at $0.50. It broke above $0.70, peaking at $0.77. MANA closed the session with gains exceeding 85%.
The global cryptocurrency market cap hit a new high during this period. It gained over 10%, hitting a high of $3.38 trillion. The fear and greed index climbed, hitting 90, showing extreme greed. However, the trend is currently different. The index is declining as the value of several major coins plummets.
There is also growing bearish pressure on ETFs. Nonetheless, the crypto market saw over $500 million influx into various spot ETFs.
How will this action affect trading this week?
Top Four Cryptocurrencies to Watch
BTC/USD
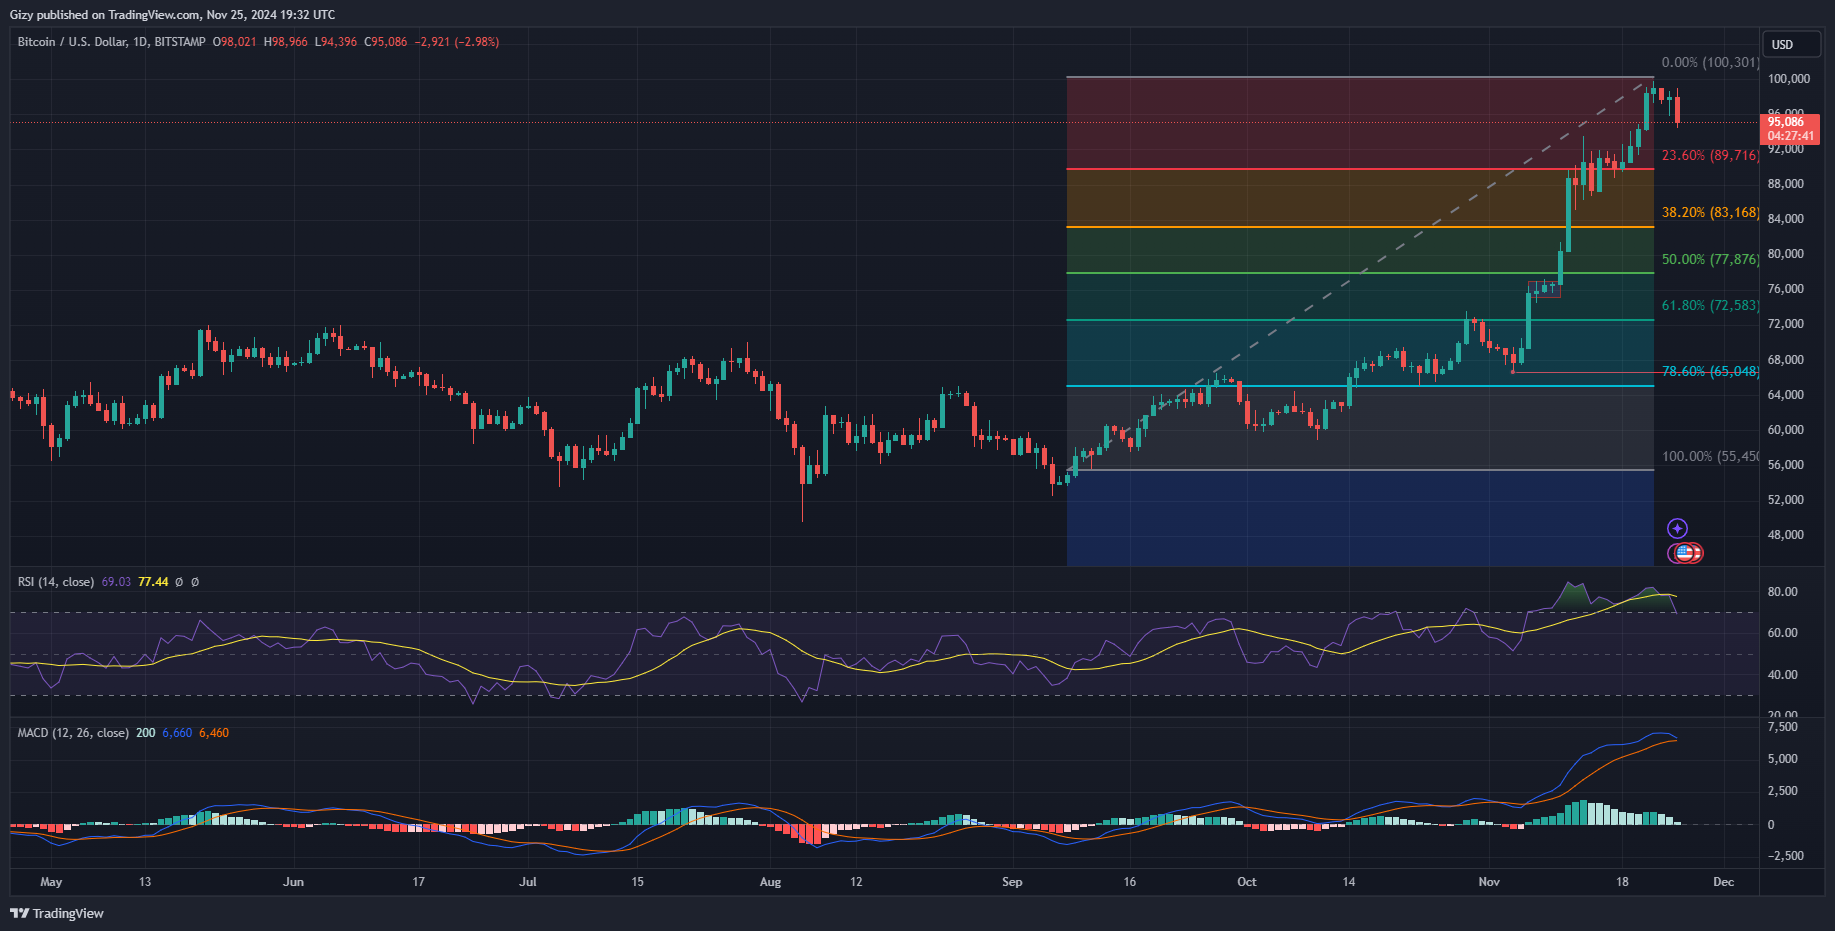
Bitcoin had massive volatility the previous week, surging to a new all-time high. The latest milestone happened on Friday when it recovered from a drop to $97,300. It climbed, peaking $200 shy of $100k. It experienced slight selling pressure afterward.

Nonetheless, the buildup to the ATH started on Monday after it broke above the $92k resistance. Thursday was one of the biggest highlights of the session. It opened trading at $94,300, broke $96k and $98k, and peaked at $99,121. The asset gained over 4% during this session.
Bitcoin has since been on the decline following last week’s uptrend. It is currently on a downtrend following the failure to sustain the momentum. It started the current session at $98k but retraced after solid resistance at $99k. It is currently trading at $95,000 following its dip to $94,600.
Indicators like the relative strength index hint at further declines. It is 68, dropping below 70 for the first time since Nov. 6. The asset is experiencing one of its most significant declines over the last fourteen days. Down by over 3%, the apex coin may experience further declines.
The moving average convergence divergence prints bearish signals at the time of writing. The 12-day EMA is declining in response to the ongoing selloff. It may intercept the 26-day EMA, completing the bearish convergence. The Fibonacci retracement indicates a possible decline to the 23% level at $89k.
SUI/USD
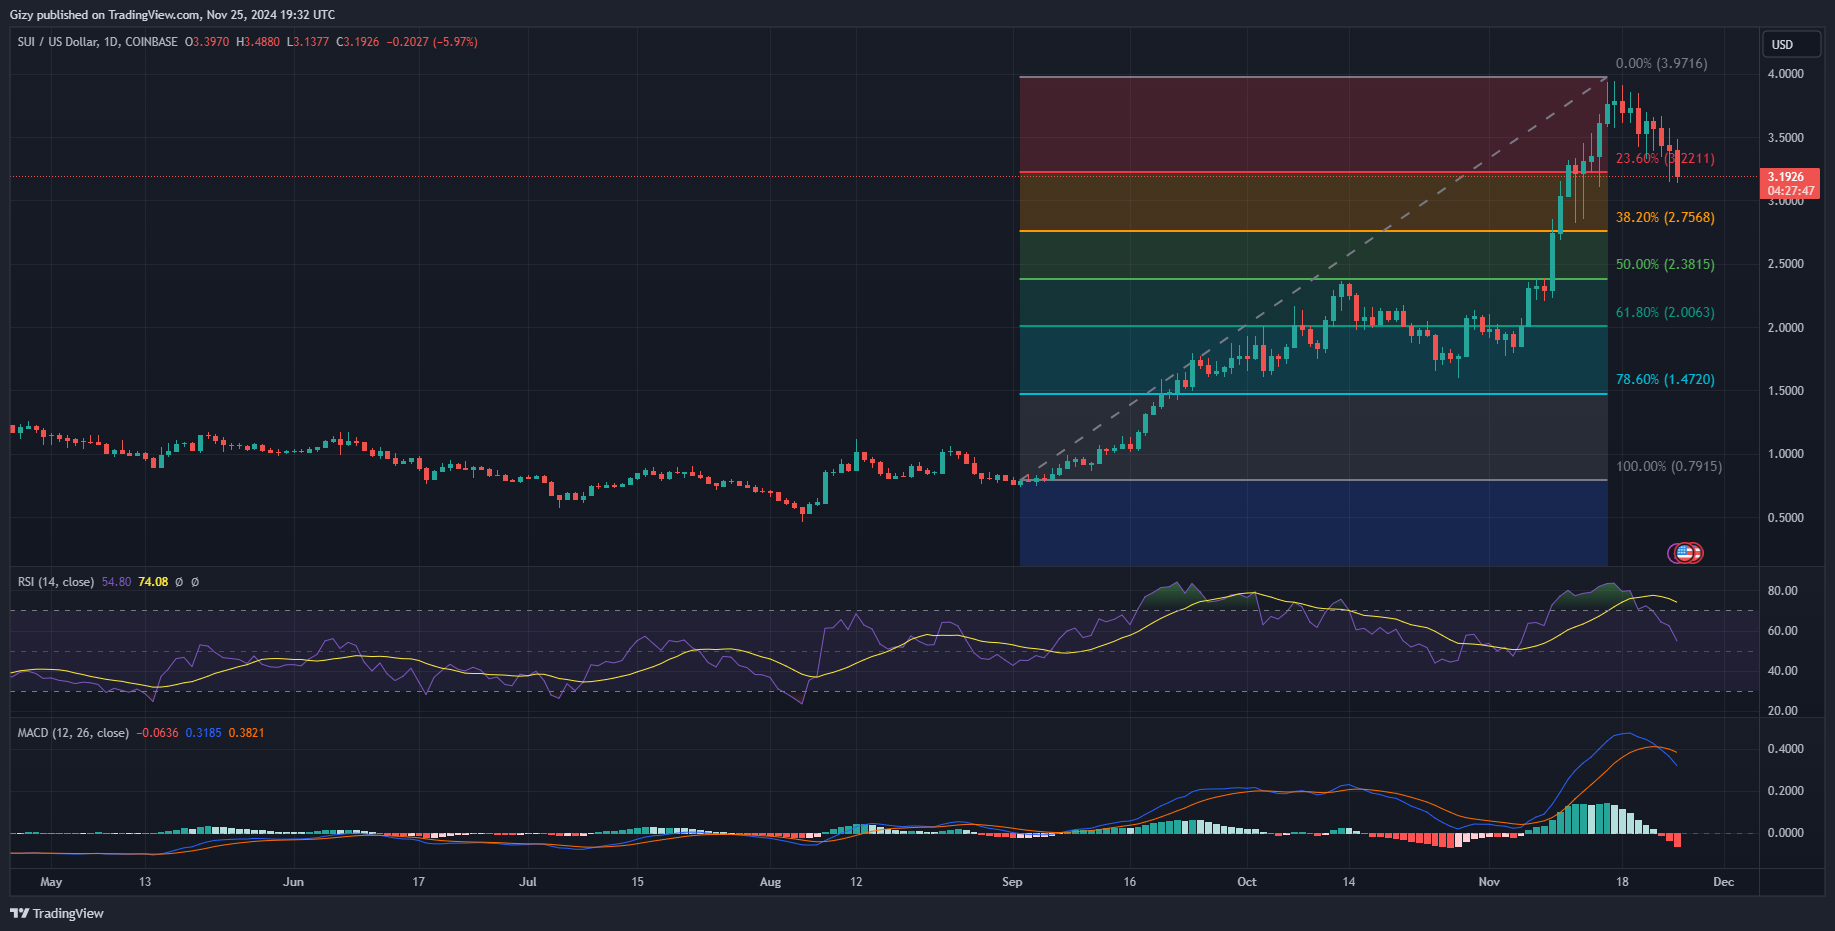
SUI has been on the downtrend for most of the previous week. It had a bearish start to the session, losing almost 3% last week on Monday. Wednesday was another red day for the asset as it retraced from a high of $3.84 to a low of $0.42. It closed with losses exceeding 5% despite small attempts at recovery.

Sunday action was one of the biggest dips of the session. SUI dropped to a low of $3.14 but recovered. However, the decline is ongoing at the time of writing. It experienced a massive rejection of its bid at $3.50. It’s currently down by over 6% with no signs of recovery, as some indicators point out.
MACD printed a bearish divergence a few days ago. The altcoin has since been on the decline following this event. The 12-day EMA continues its decline, and the 26-day EMA continues to follow the same trend. This is also the same reading on RSI. Nonetheless, it is currently at 54, hinting at a possible change in trajectory.
Currently trading below its 23% Fibonacci retracement level, it may decline further as the bulls show no signs of ending the downtrend at the current price. It is important to halt the downhill movement at the current price or risk further declines below $3.
XLM/USD
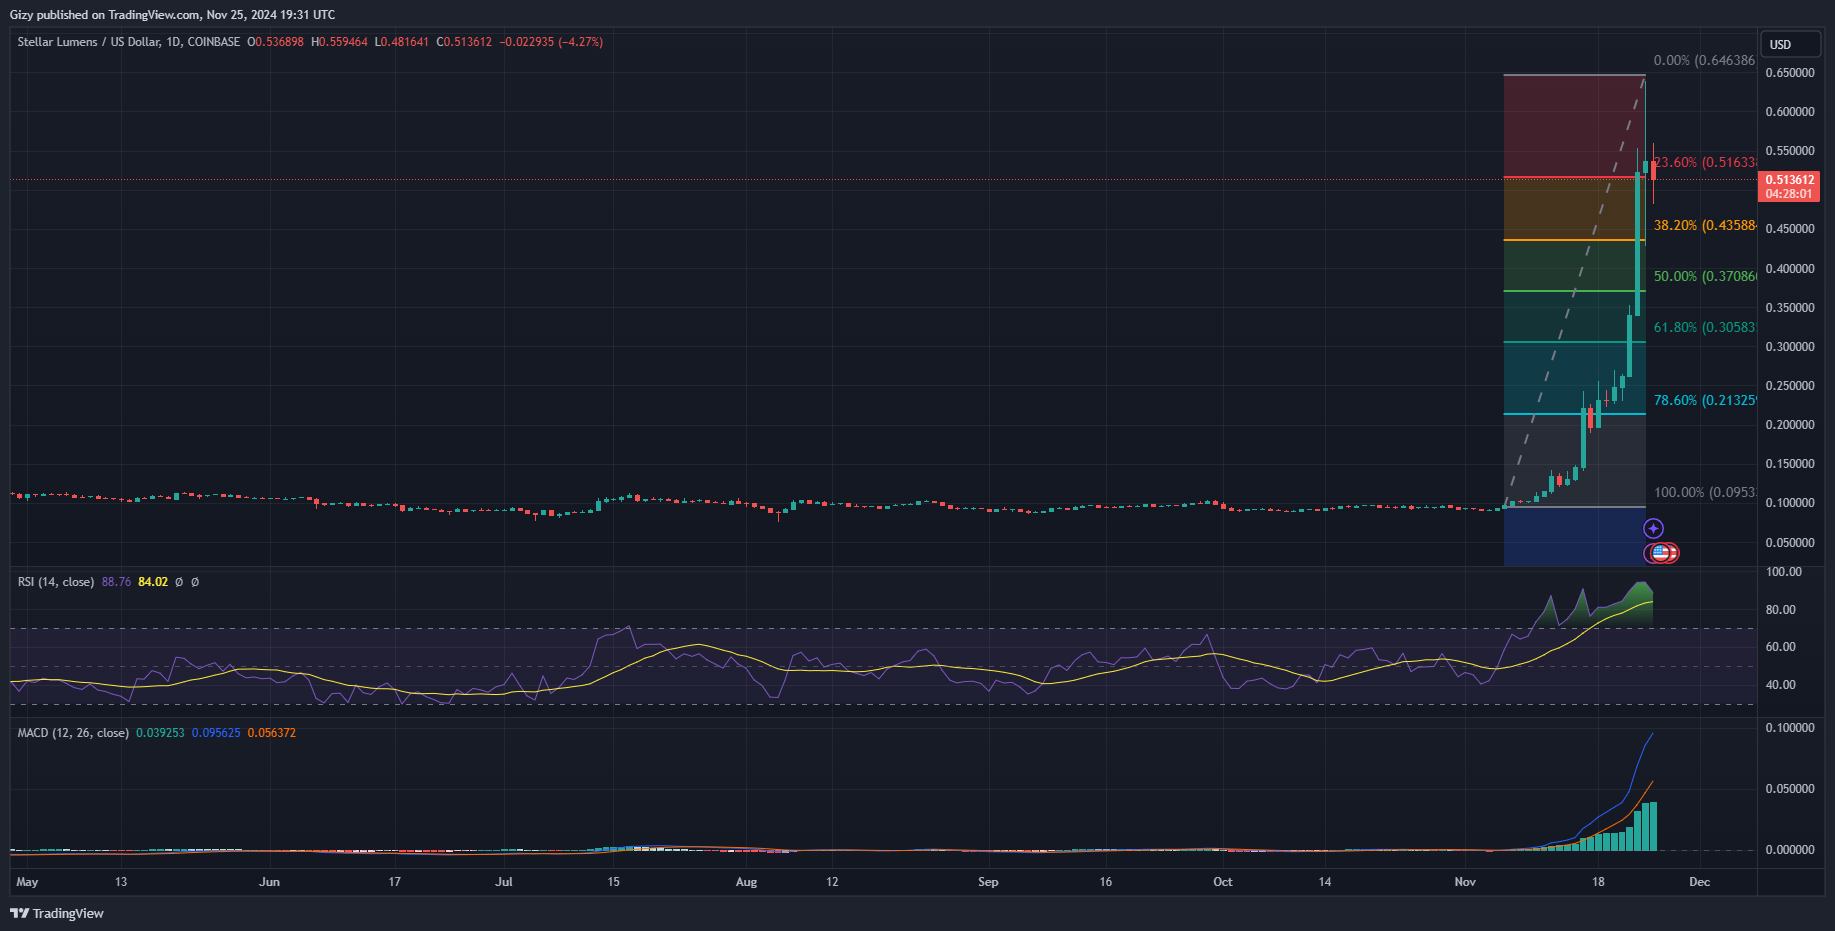
The last three days of the previous week were among the most bullish for Stellar Lumens. It continued its trend of high volatility after almost two months of flat trading. It opened trading at $0.26 on Friday and peaked at $0.34, representing an almost 30% increase.

Saturday came with further increases. It broke the $0.50 barrier but faced massive rejections at $0.55. Nonetheless, it registered gains exceeding 53%. XLM attempted the $0.65 barrier but failed to break, resulting in an enormous decline. However, the altcoin is struggling to maintain its momentum.
It started the current intraday session at $0.53, surged to a high of $0.55, but retraced, and is now trading at $0.50. Currently down by over 6%, the asset is gearing up for further decline as indicators flip bearish.
The relative strength index surged to a high of 94 during the previous intraday session. Following the most recent price declines, it is plummeting and may dip further as it remains overbought. The selloffs are ongoing, and the Fibonacci retracement level hints at critical levels to watch.
One such is the 38% level at $0.43. Currently trading below the 23% fib mark, the chances of a decline to this level increase. The constant pressure on the $0.50 support fosters this claim.
TIA/USD
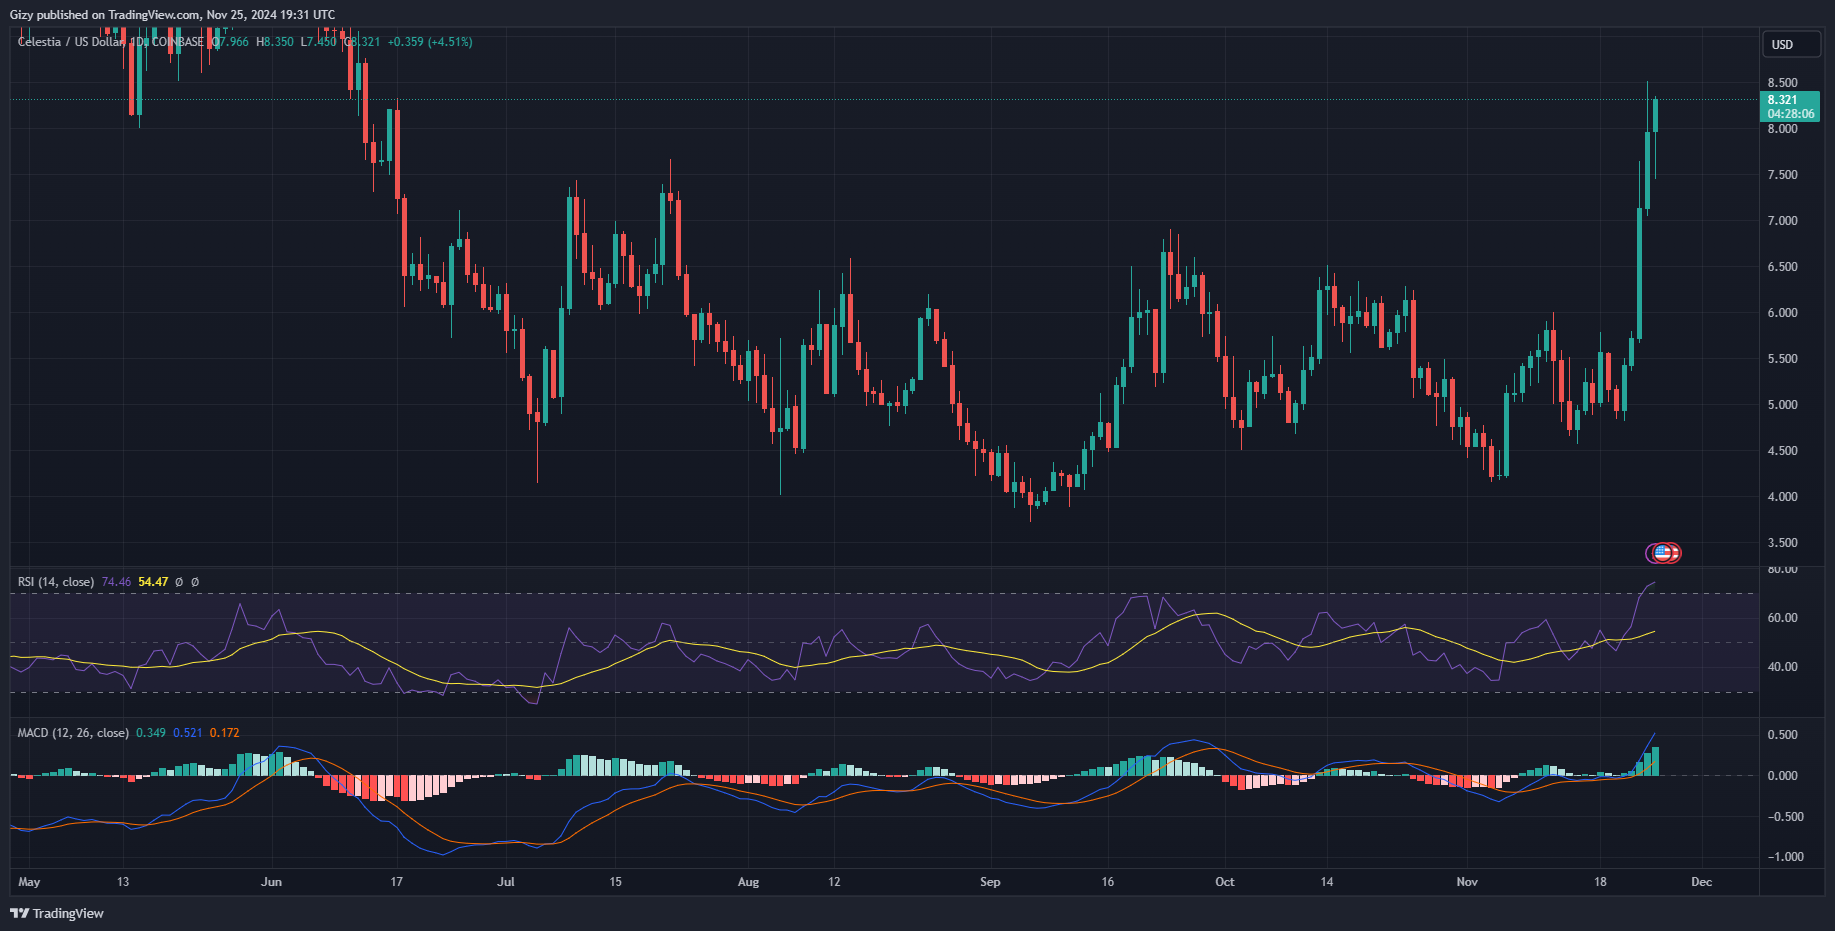
Celestia has been on the uptrend since Thursday. It started trading the day at $4.93, surged to a high of $5.50, and closed with gains exceeding 9%. Saturday started with the asset at $5.72, breaking its three-month high at $7. It continued upwards, hitting a high of $7.64, but retraced and closed with gains exceeding 24%.

It continued upward on Sunday, breaking above $8 and hitting $8.50. The surge is ongoing, and TIA eyes another attempt at the $8.50 barrier. It recovered from a dip to $7.50, up by almost 3%.
The relative strength index broke above 70 on the last day of the previous week and is at 73 at the time of writing. TIA is overbought, which may be a sign of impending declines. However, other assets maintain surges above 70. It remains to be seen if this may play out in this case.
If the bulls sustain the ongoing bullish trend, the asset may edge closer to $10. However, a change in sentiment may send TIA as low as $7.
