BTC is currently leading market recovery as it gradually recovers the levels it lost last week. The hike is gradual and altcoins are following this trend.
Due to the general improvements in the crypto market, the global cryptocurrency market cap rose by over 4% in the last 24 hours. The bulls embrace the latest change as a reward for the losses they incurred last week.
Fundamentals are silent in response to the growing trend. There has been no news that could trigger the ongoing hike. It means that volumes were behind the last price changes. Will it continue throughout the week?
Top Four Cryptocurrencies
BTC/USD
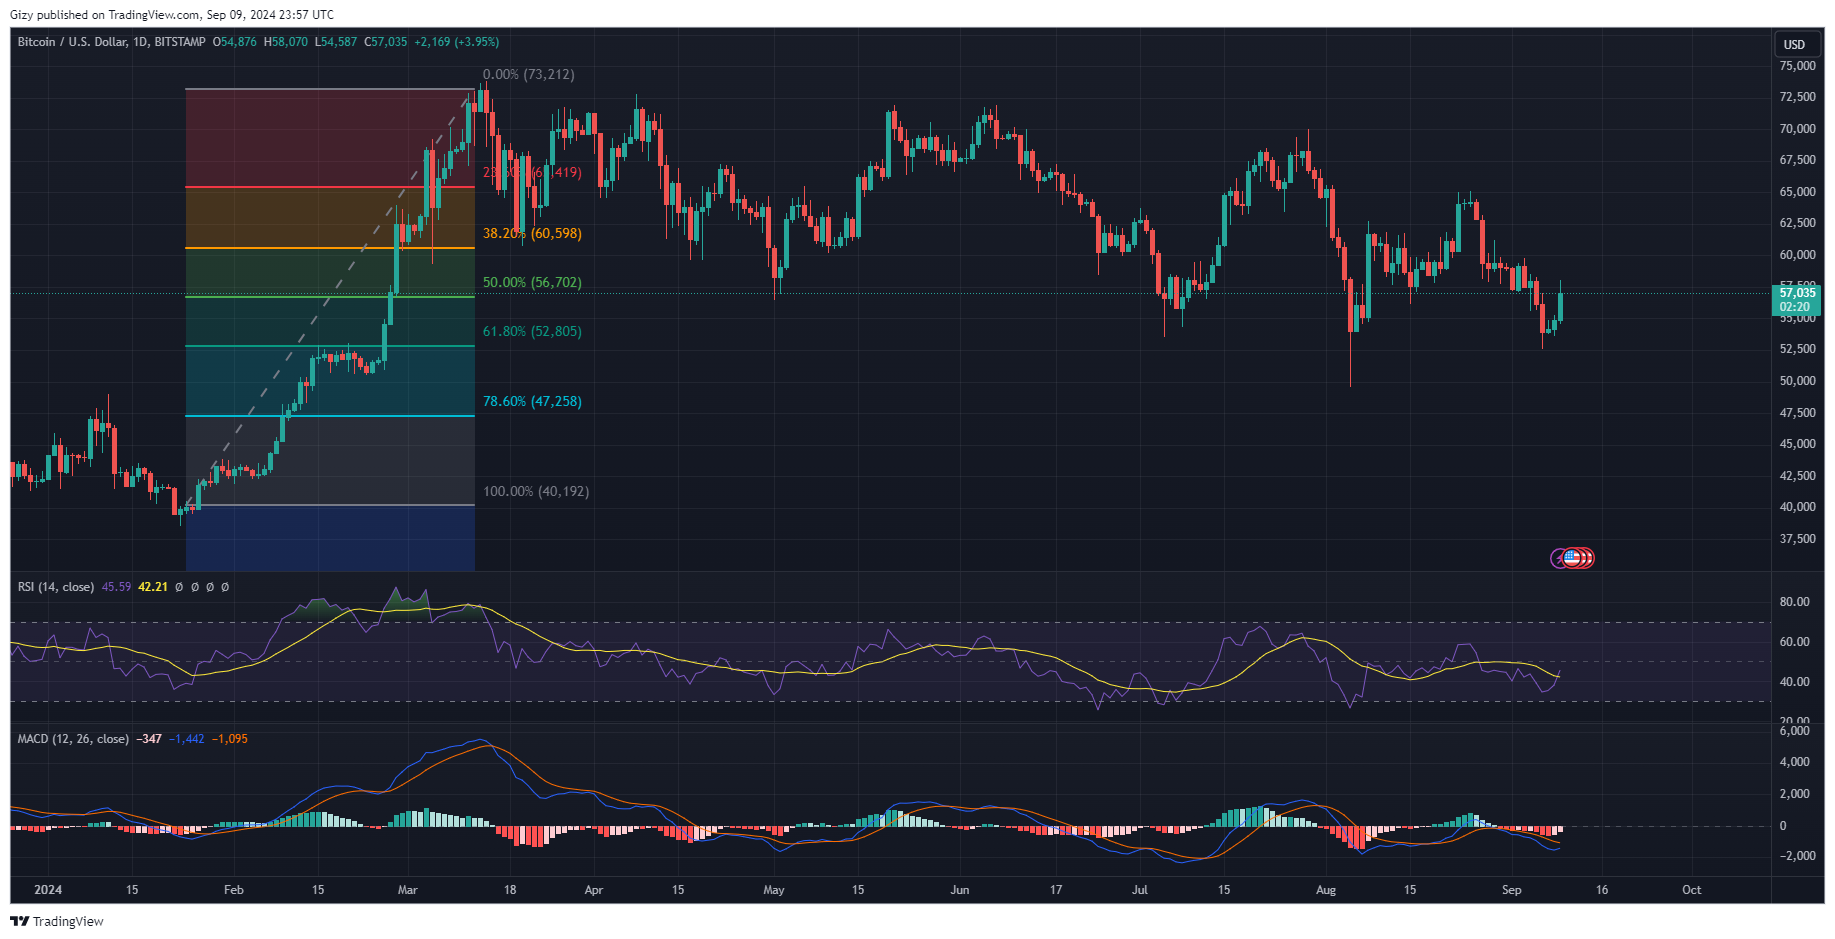
The apex coin kicked off the day, trading at $54,876, and retraced to $54k, leading many to believe the downtrend would continue. However, it rebounded and continued upwards, flipping $55k and $56k. The hike continued, and BTC is trading at $57,500.

The latest surge continues the asset’s bid at recovery following a massive decline on Friday. It retraced to $52k but, rebounded and closed with losses of almost 4%. It has since registered small increase over the last two days.
The latest hike halted as Bitcoin attempted to reclaim its pivot point at $58k. It lost momentum and is exchanging close to the mark. Nonetheless, indicators are looking positive and point to the uptrend’s continuation.
At the time of writing, MACD is printing buy signals. The 12-day EMA is on an uptrend in response to trading actions in the last three days. The change from its downward trajectory shows an ongoing bullish convergence, which may reflect on prices as it unfolds.
It is worth noting that bitcoin has also registered a notable increase in trading volume over the last 24 hours. Volume soared by over 120%, and the relative strength index points to a bulk of it coming from bullish traders. The metric surged in response.
Both indicators point to a huge chance that the surge will continue. BTC will reclaim its PP at $58k and attempt $60k before the week runs out.
ETH/USD
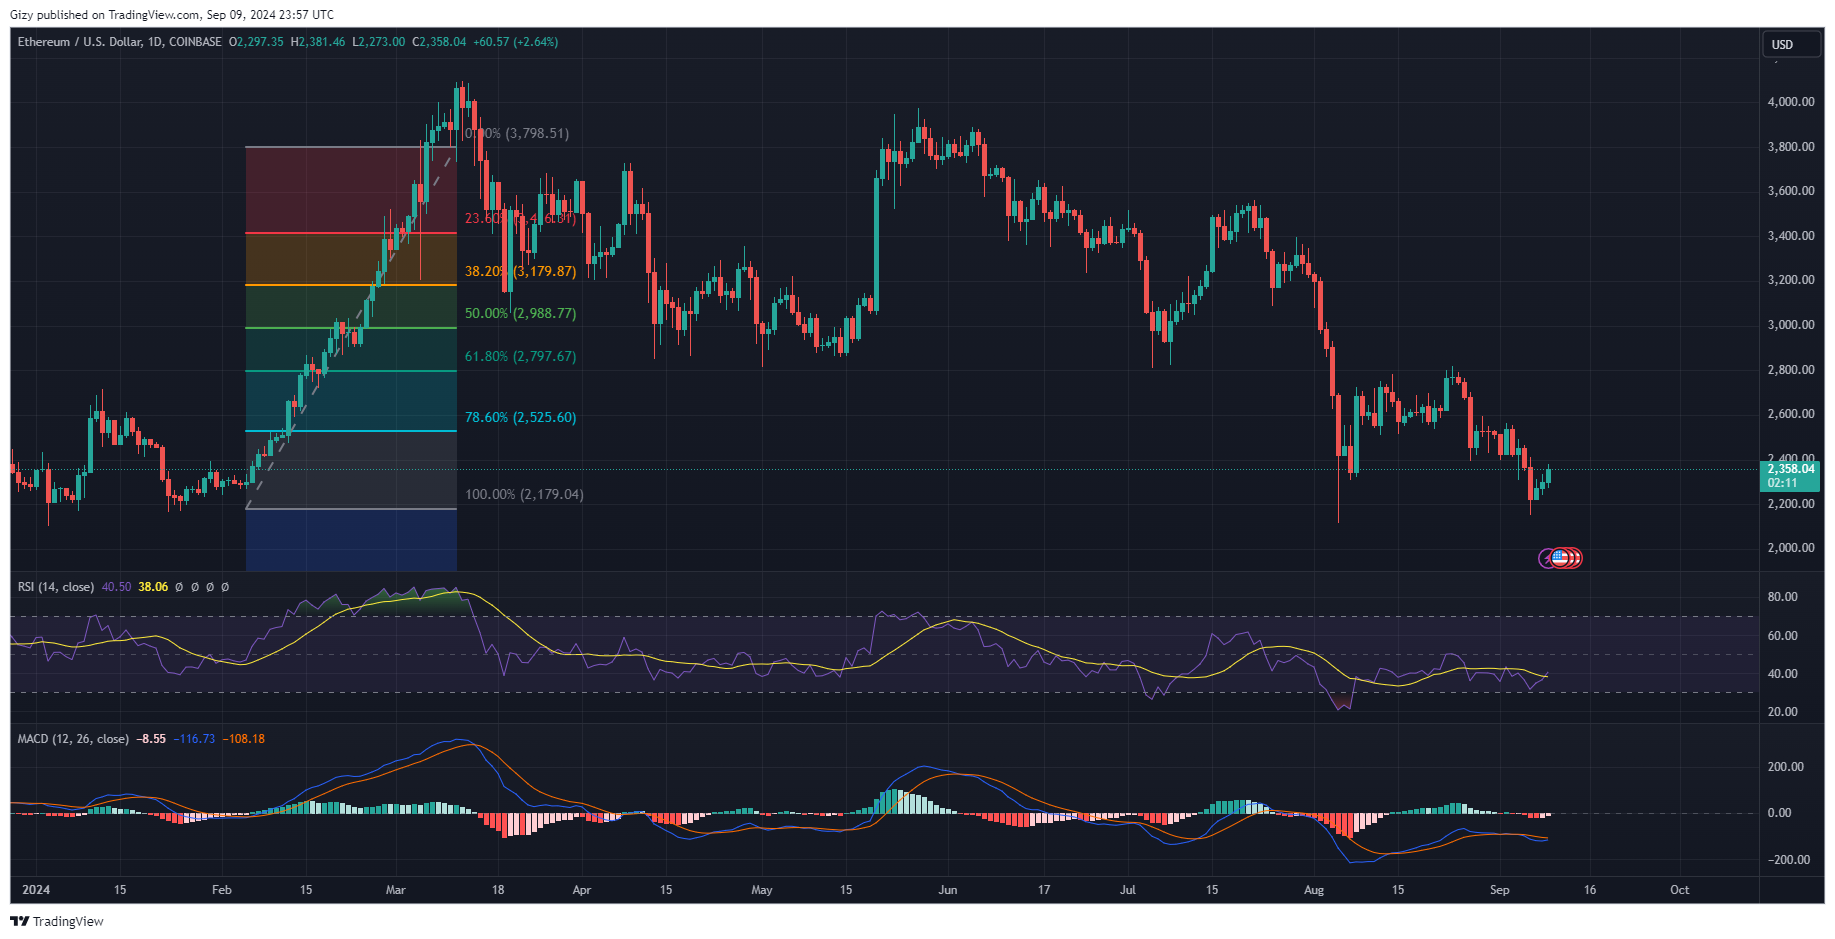
Ethereum is up 2% after a failed attempt at $2,400. It started the day on a bearish note as a drop to $2,273 threw many in panic as they anticipated another decline to $2,200. However, it rebounded and when reclaimed $2,300, peaking at $2,381.

The latest price movement is in line with the bulls’ ongoing recovery attempt. It started after Friday’s massive decline, retracing from $2,367 to a low of $2,150. Although it saw a small hike, it closed with losses exceeding 6%.
The moving average convergence divergence has since flipped bullish in response to the small gains the asset has had over the last two days. The 12-day EMA is on the uptrend and will intercept the 26-day EMA in the coming days. The histogram suggests that a full interception may happen this week, reflecting on prices.
RSI is also on the rise as the bulls are making up. Trading volume is up by over 60% on the last 24 hours with most of it coming from buying actions. The metric surged by 4 points from the previous day.
If trading conditions remain the same, ETH may reclaim $2,400 and retest its fourteen-day high at $2,570. Nonetheless, this does not eliminate the risk of a drop to $2,200.
FTM/USD
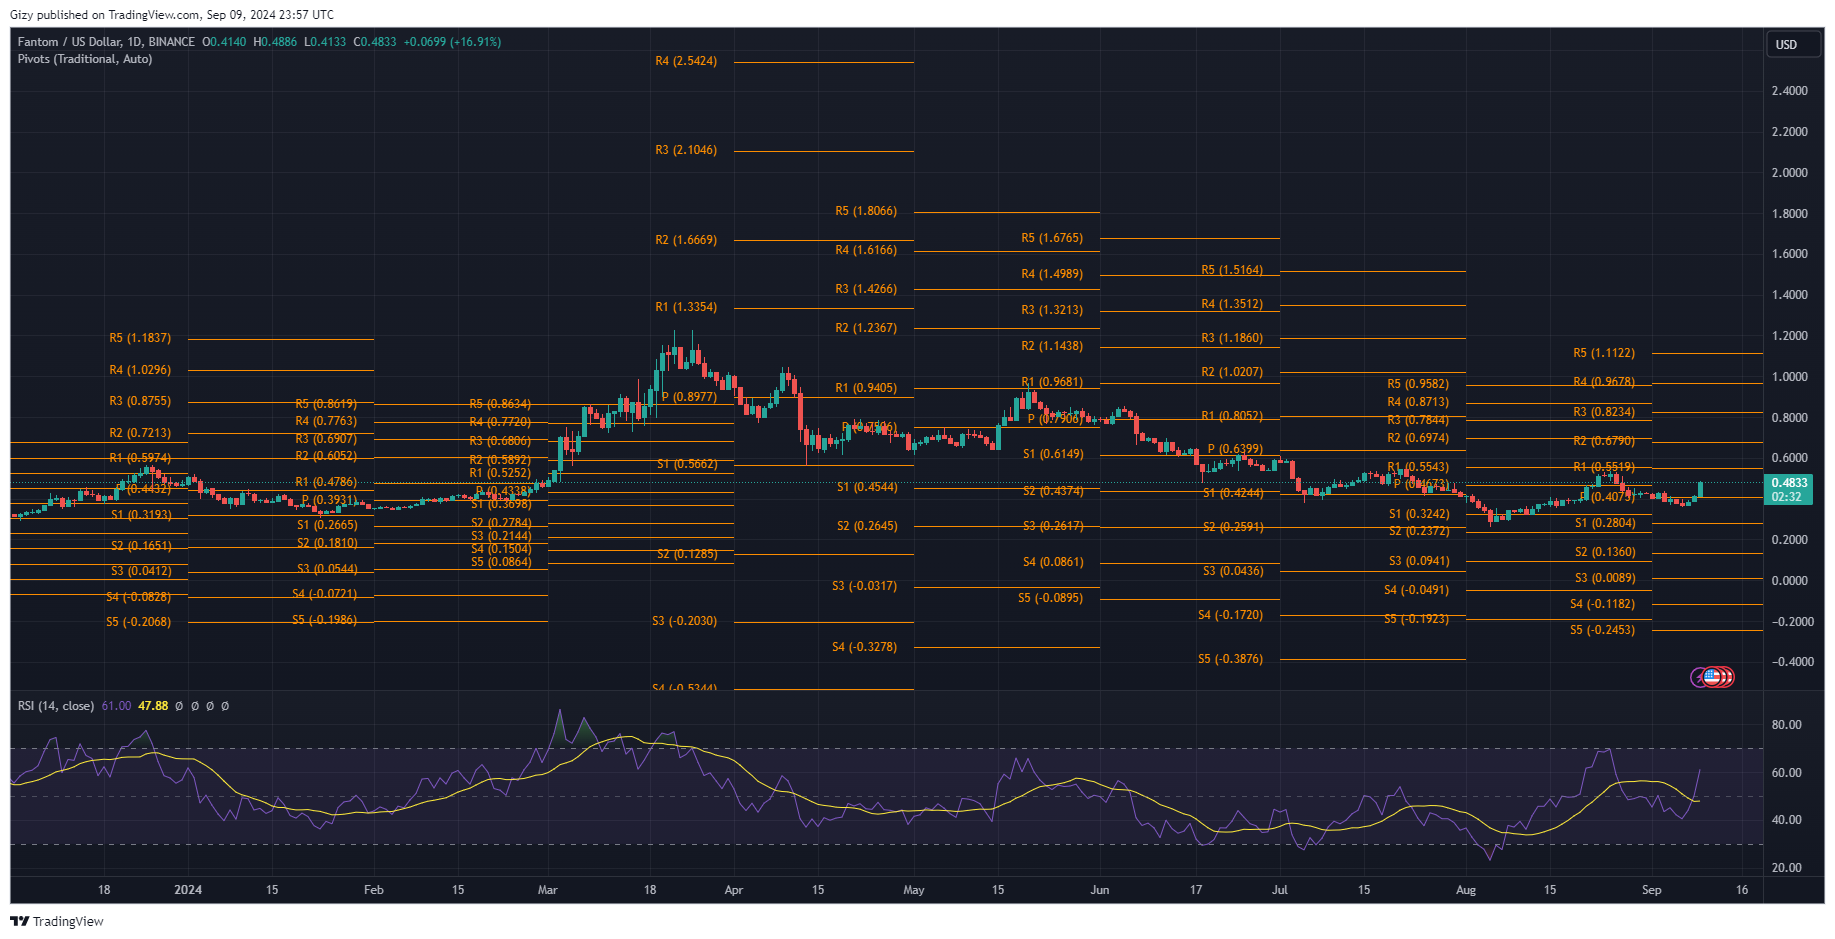
Fantom is seeing one of its biggest surges in the last l24 hours. It started trading at $0.41 and experienced a massive increase in buying pressure, resulting in it flipping its fourteen-day high at $0.45. The hike continued until it faced small rejections at $0.48, ending its bid at $0.50.

FTM is up by over 17%, continuing the previous day’s gains that saw it recover the $0.40 support. The latest surge marks the third consecutive day of notable increases since Friday’s decline. Indicators are also bullish in response, indicating the trend’s continuation.
The altcoin surged above its pivot point during the previous intraday, sealing the bullish round. The latest surge sees it edge closer to first pivot resistance at $0.55. Although far from the current price, MACD suggests an increased chance of retesting this mark in the coming days.
It shows an ongoing bullish divergence as the 12-day EMA completes the interception and maintains the climb. RSI is also seeing an upward trajectory, surging from 59 to 61.
Fantom must break $0.50 to achieve its bid of flipping $0.55. However, breaking this critical level does not guarantee an immediate flip as the previous price movement showed the asset seeing notable selling congestion around $0.53. The same trend may repeat, with the price hovering around this mark this week.
Nonetheless, FTM must experience a small correction that will allow the bulls to build momentum around $0.50 in anticipation of the next flip.
HNT/USD
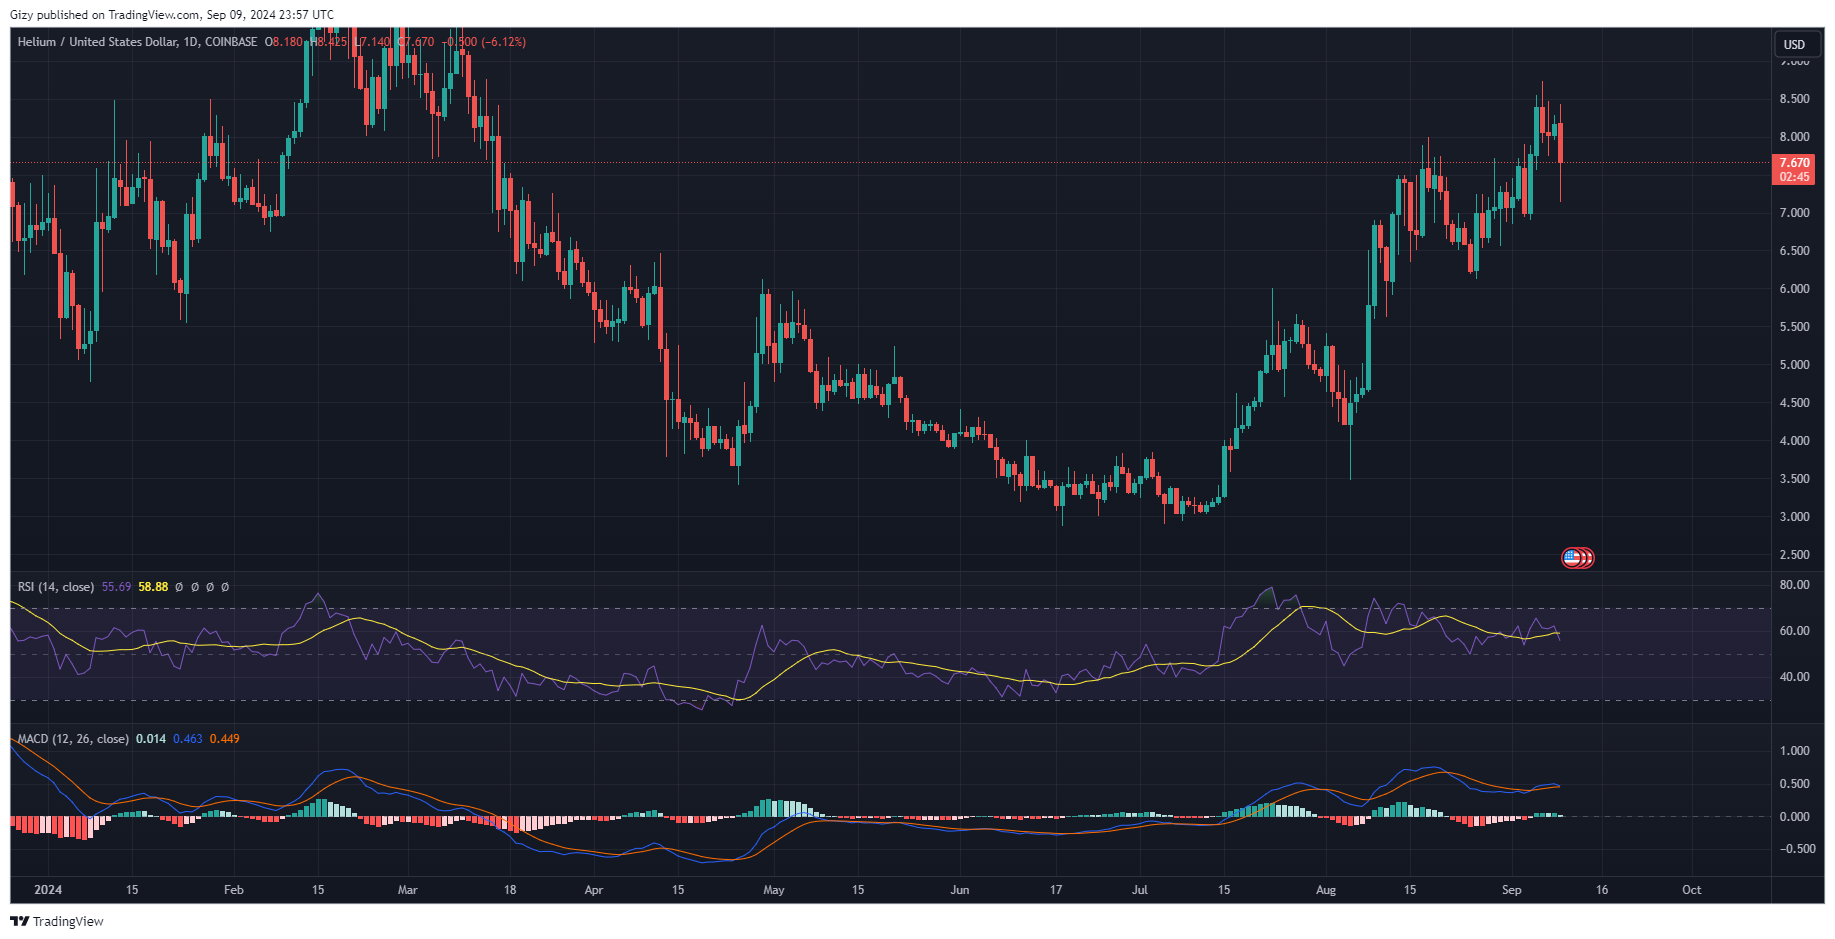
Helium is off to a bad start as it registered notable price declines over the last 24 hours. It started trading at $8.18 and was en route to $8.50 but experienced massive rejections at $8.42, resulting in a notable decline. It retraced to a low of $7.14 but rebounded and is exchanging at $7.72.

The most recent dip comes after three days of price moving within a channel. The struggle started after the coin peaked at $8.72 on Friday and retraced to end the day with losses exceeding 4%. Nonetheless, HNT gained over 13% last week.
Currently down by over 5%, previous price movement suggests that the decline may continue. The 1-week chart shows a new price trend. The asset experienced notable downtrends after two weeks of uptrends.
The same pattern may unfold this week as HNT registered notable increases over the last two weeks, gaining a total of 29%. A reversal is imminent based on this pattern.
The one-day chart supports the assertion, as indicators are bearish at the time of writing. MACD is printing sell signals, as the 12-day EMA is on the decline and close to intercepting the 26-day EMA in an ongoing negative convergence. RSI also dropped to 56 as selling pressure mounts.
The Fibonacci retracement level shows key marks to watch. Previous price movements suggest small demand concentration at the 23% fib level at $7.36. The coin may rebound off the mark or retest $7. Nonetheless, the one-week trend also showed a rare three-week surge.
HNT may retest teh $8.5 resistance this week if it sees a trend reversal in the coming days.
