
HYPE is currently grappling with significant selling pressure that threatens to worsen in the coming days.
A closer look at the chart indicates that HYPE has been on the decline since last week. However, current price action shows that it is yet to experience a buyback. The asset fell by over 4% on Monday following a sudden spike in selling pressure. As a result, indicators on the 1-day chart are flipping negative.
A sweep through the top 100 largest cryptocurrencies reveals diverse trends affecting different cryptocurrencies. While some had significant declines last week, others surged. Some of the top gainers were XMR, IP, and POL, which gained a whopping 35%, 34%, and 27%, respectively.
Nonetheless, the global cryptocurrency market cap registered no significant value change over the last seven days. It printed a doji on the 1-week chart after retracing from its highest valuation in 7 weeks.
However, the market is off to a rocky start as it experienced another slight selloff. Monday may not be the perfect start to the week as many may anticipate. Worse still, it may set a bearish tone for the remaining six days.
In either case, the week promises even more volatility than the previous one. The market will react to fresh economic data releases, with CPI the most anticipated. Let’s look at some cryptocurrencies to watch over the next six days.
BTC/USD
Bitcoin recently retraced to $90k after failing to hold $91k. However, it rebounded and has broken above its previous high. It peaked at $92,400 a few hours ago.
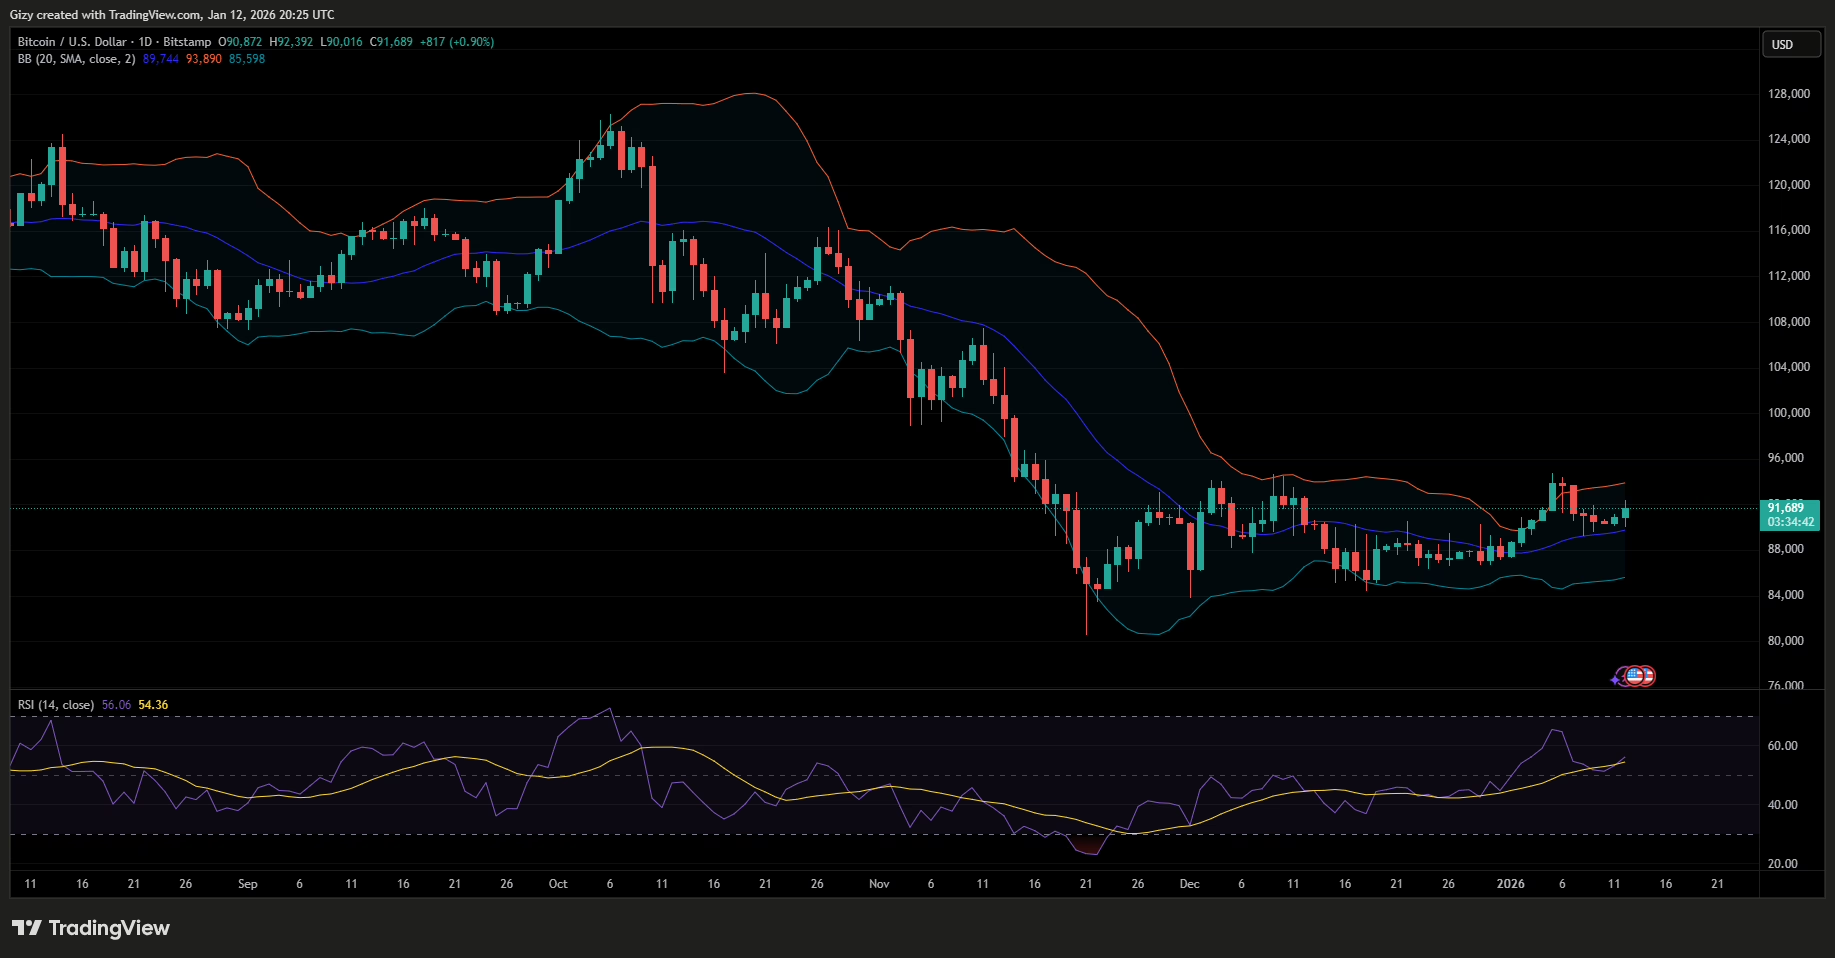
The apex coin is experiencing slight corrections at the time of writing. It remains to be seen if the downtrend will continue. Nonetheless, indicators are flipping positive, with the relative strength index surging above its six-day high.
Aside from RSI, the bollinger bands are yet to confirm the uptrend. It is worth noting that the asset broke above the bands last week but retraced afterward. Typically, a drop to the lower band would have followed. However, the apex coin bounced off the middle band. The current uptick would see prices trend farther from the mark.
If the BTC maintains trading above the SMA through Tuesday and Thursday, it would confirm that investors are becoming increasingly bullish. It could also mean another attempt at $95k within the next six days.
However, if it loses the mark, BTC may retrace to $86k in the coming days.
HYPE/USD
HYPE surged to a high of $25.3 a few hours ago but retraced afterward. It fell to $23.1 before rebounding, helping the asset trim some of its losses.
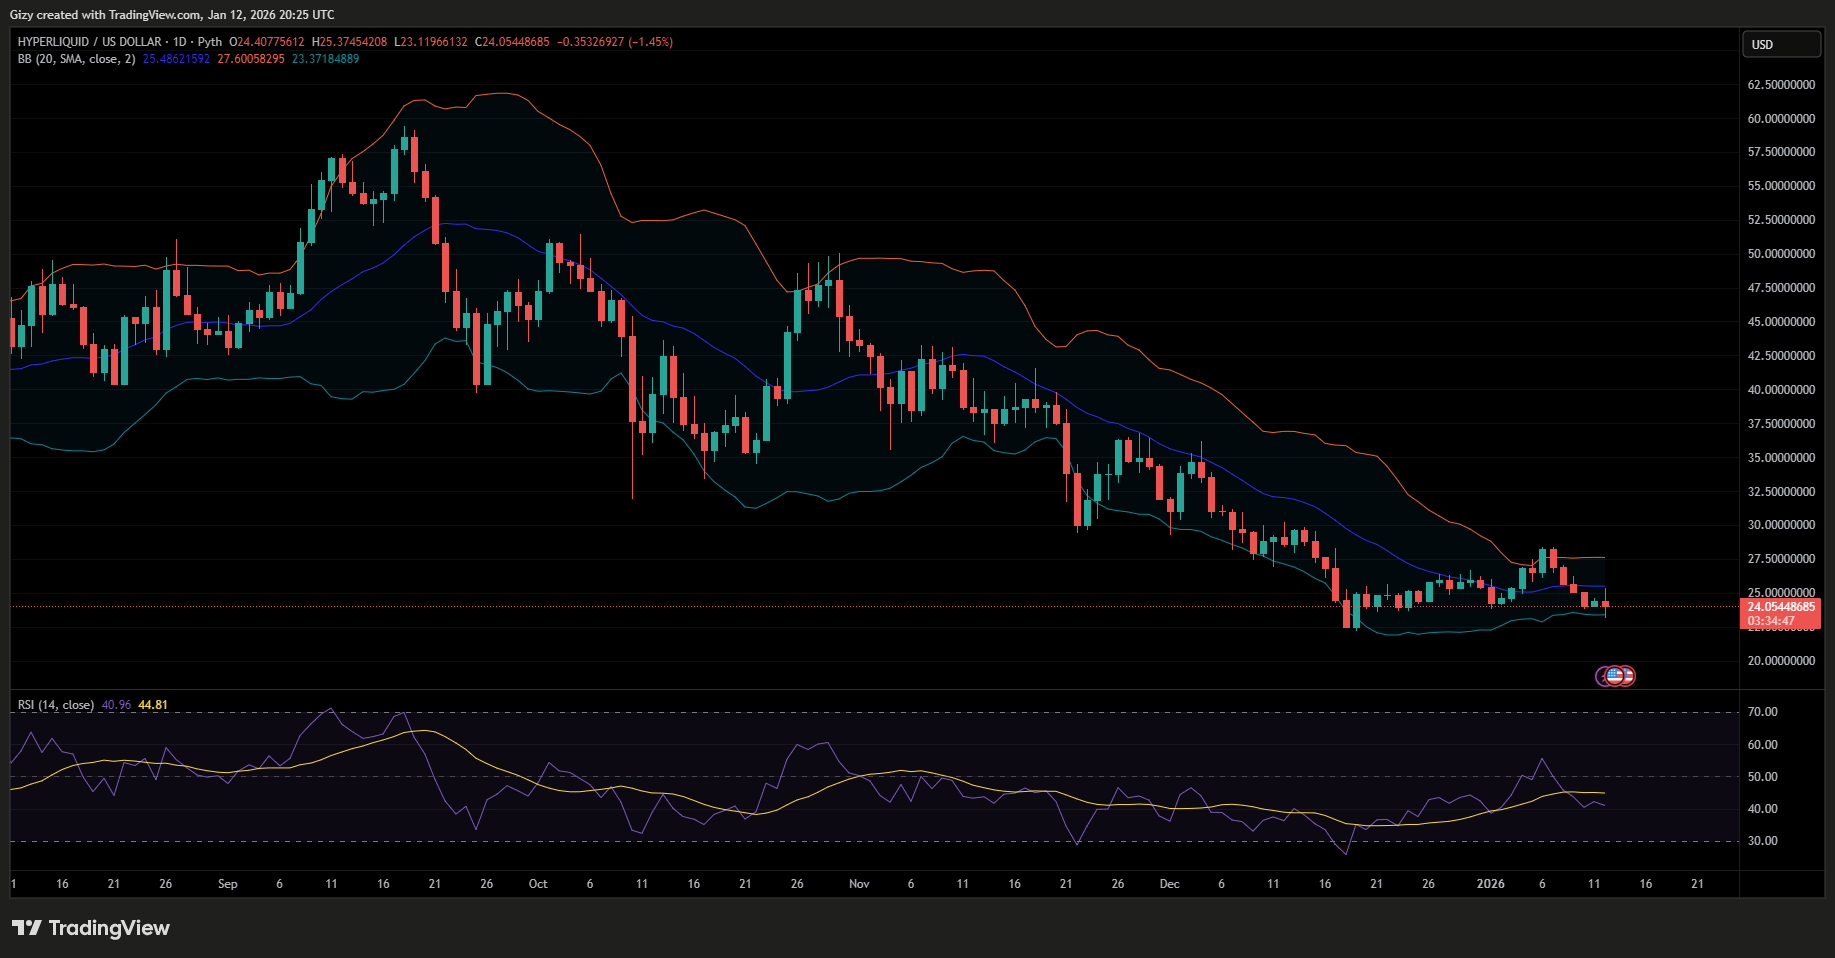
However, it is trading down almost 3% at the time of writing, and there has been no significant change in indicators. One such is RSI, which is trending downward amid the pullback.
Additionally, the moving average convergence divergence raises concerns about how prices may perform in the coming days. A closer look at the metric shows a nearly complete negative crossover, which generally signals further decline. Completing the interception could confirm further downtrends ahead.
Previous price movement points to notable demand concentration at $22.1. HYPE will test the barrier within the next six days if the downtrend persists, and losing the mark could send it below $20 in the coming days.
However, the impending data releases may offer momentary relief. It remains to be seen if they’ll be enough to confirm a trend reversal.
UNI/USD
UNI is trading down by almost 2% at the time of writing, having rebounded from a low of $5.27. The 1-day chart shows a sudden change in upward momentum, leading to a price decline.
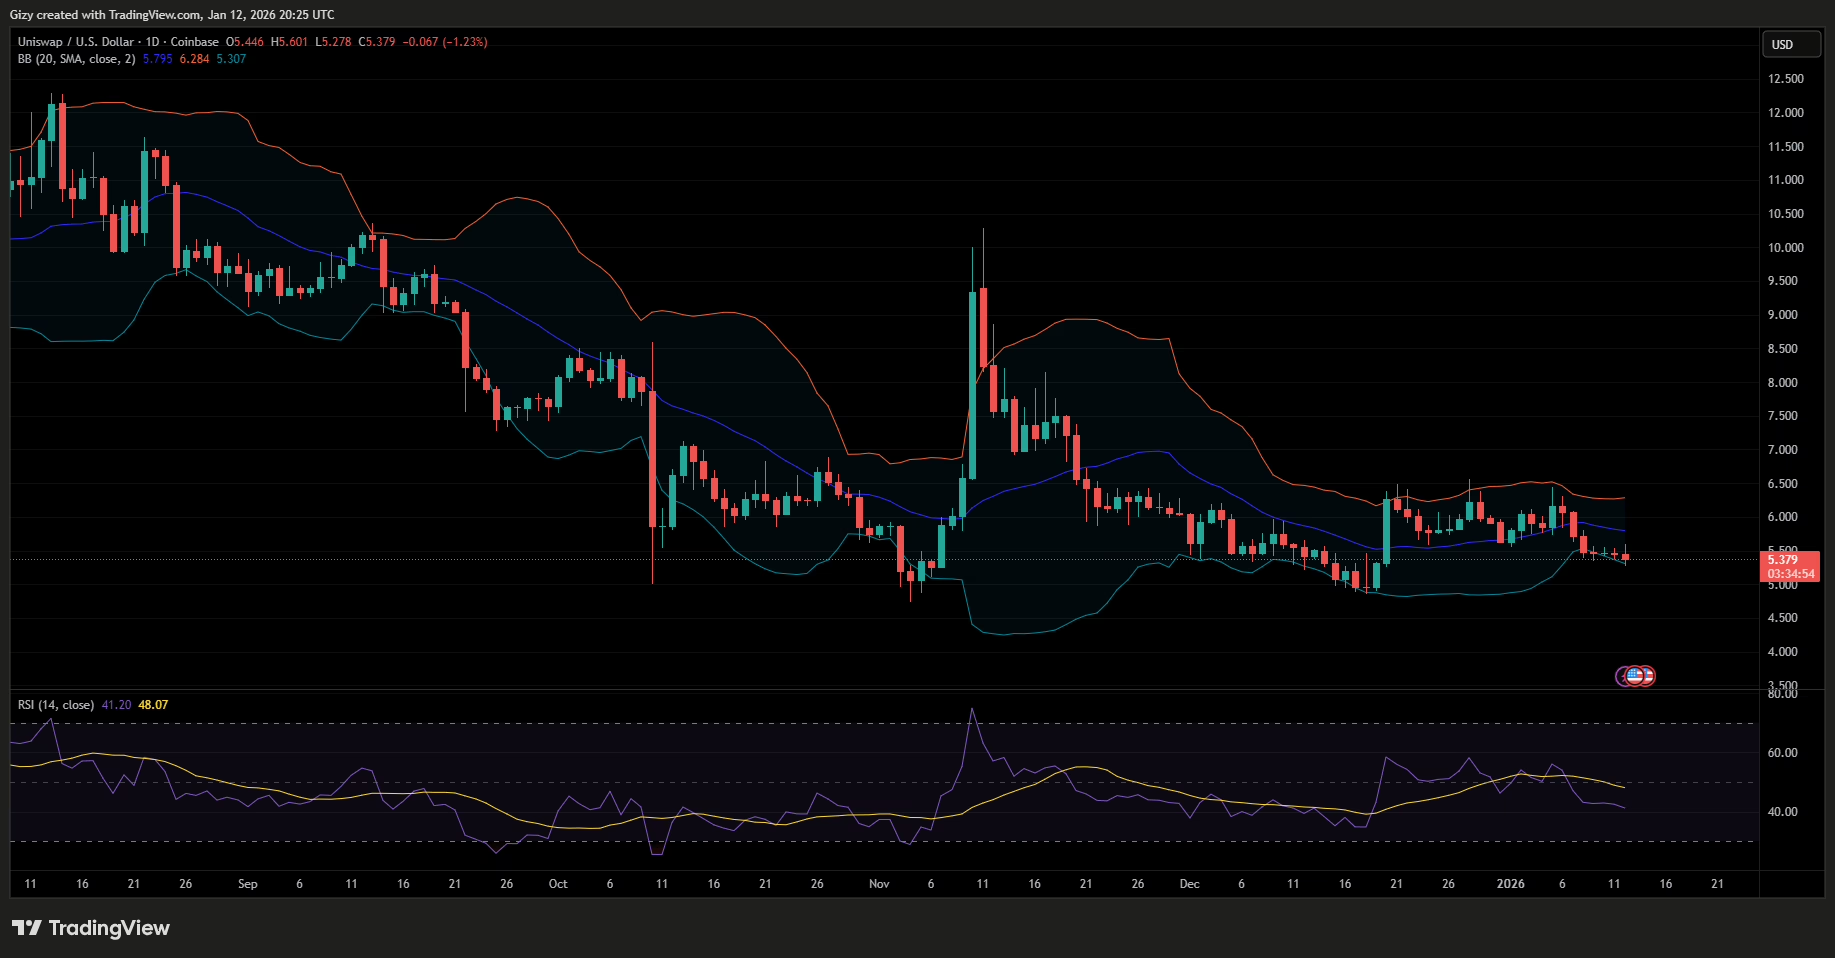
Monday’s price action shows the asset has yet to break out of the prevailing trend from the previous week, when it lost almost 7%. Additionally, current price movements have pushed indicators even lower.
For example, MACD displayed a bearish divergence a few days ago. It has since continued its downward trend, indicating a strong bearish presence. Aside from the moving average convergence divergence, RSI is also declining. If the selling pressure persists, UNI could retest $5.
However, the bollinger bands offer a glimmer of hope. UNI recently slipped below it but has since rebounded. If the traditional trend of trend reversal after breaking out of the bands holds, the asset will surge. Its next price target would be the $5.90.
SUI/USD
Last Monday, SUI surged from $1.65 to $1.95, gaining over 12%. While it surged even higher on Tuesday, it retraced afterward. Nonetheless, it experienced significant selling pressure over the next five days.
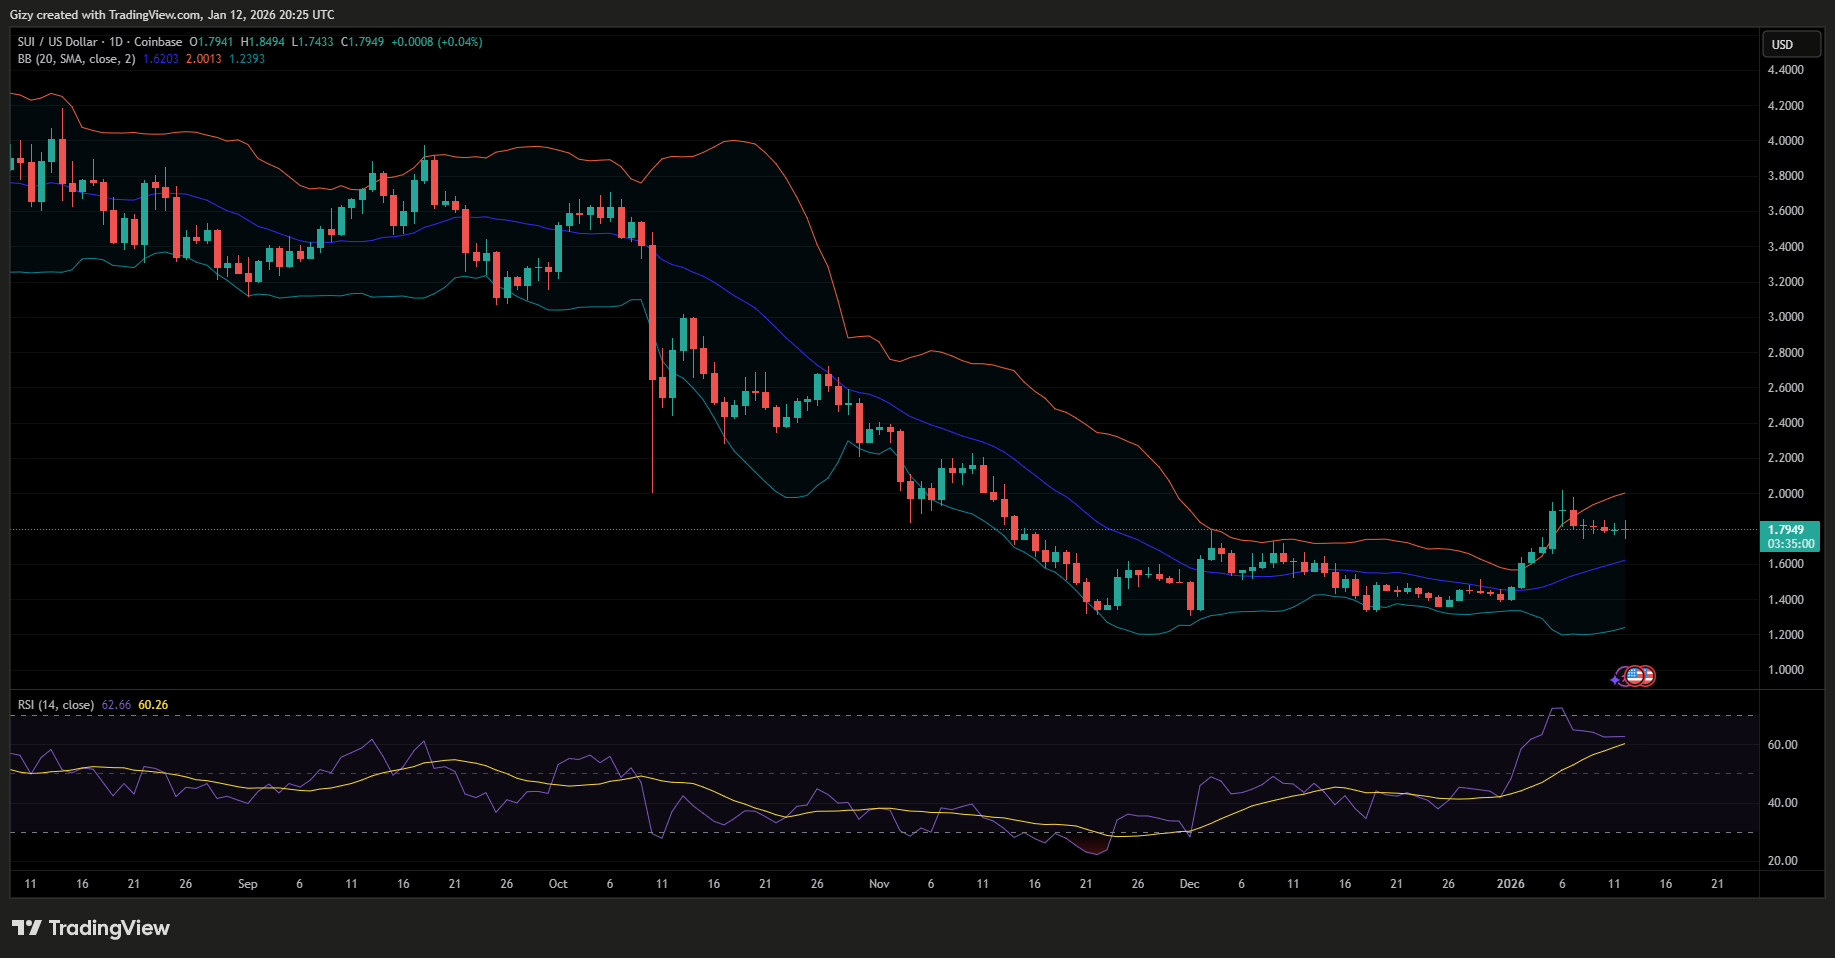
The current week is starting differently. Like HYPE, SUI is grappling with notable selling pressure at the time of writing. It is down almost 2%, following its recent rebound.
A closer look at the chart shows that the asset held on to its seven-day support. However, the bollinger bands suggest that the demand concentration at the barrier may not be sufficient to keep prices up. It is worth noting that the altcoin broke above the bands last week.
Based on the BB, SUI may continue downward over the next six days. Its next price target may be the middle band at $1.65. Nonetheless, the moving average convergence divergence shows a narrowing gap between the 12- and 26-EMA.
The 1-day chart shows that if the bulls fail to stage buybacks at the bollinger’s SMA, prices may drop to $1.55, the next key level.
MYX/USD
The 1-day chart shows that MYX suffered significant losses last week, as it traded mostly in a downtrend. It had one of its biggest declines last Monday but pulled back on Sunday. However, it closed the week down by almost 5%. The asset registered its first red after four greens on the 1-week chart.
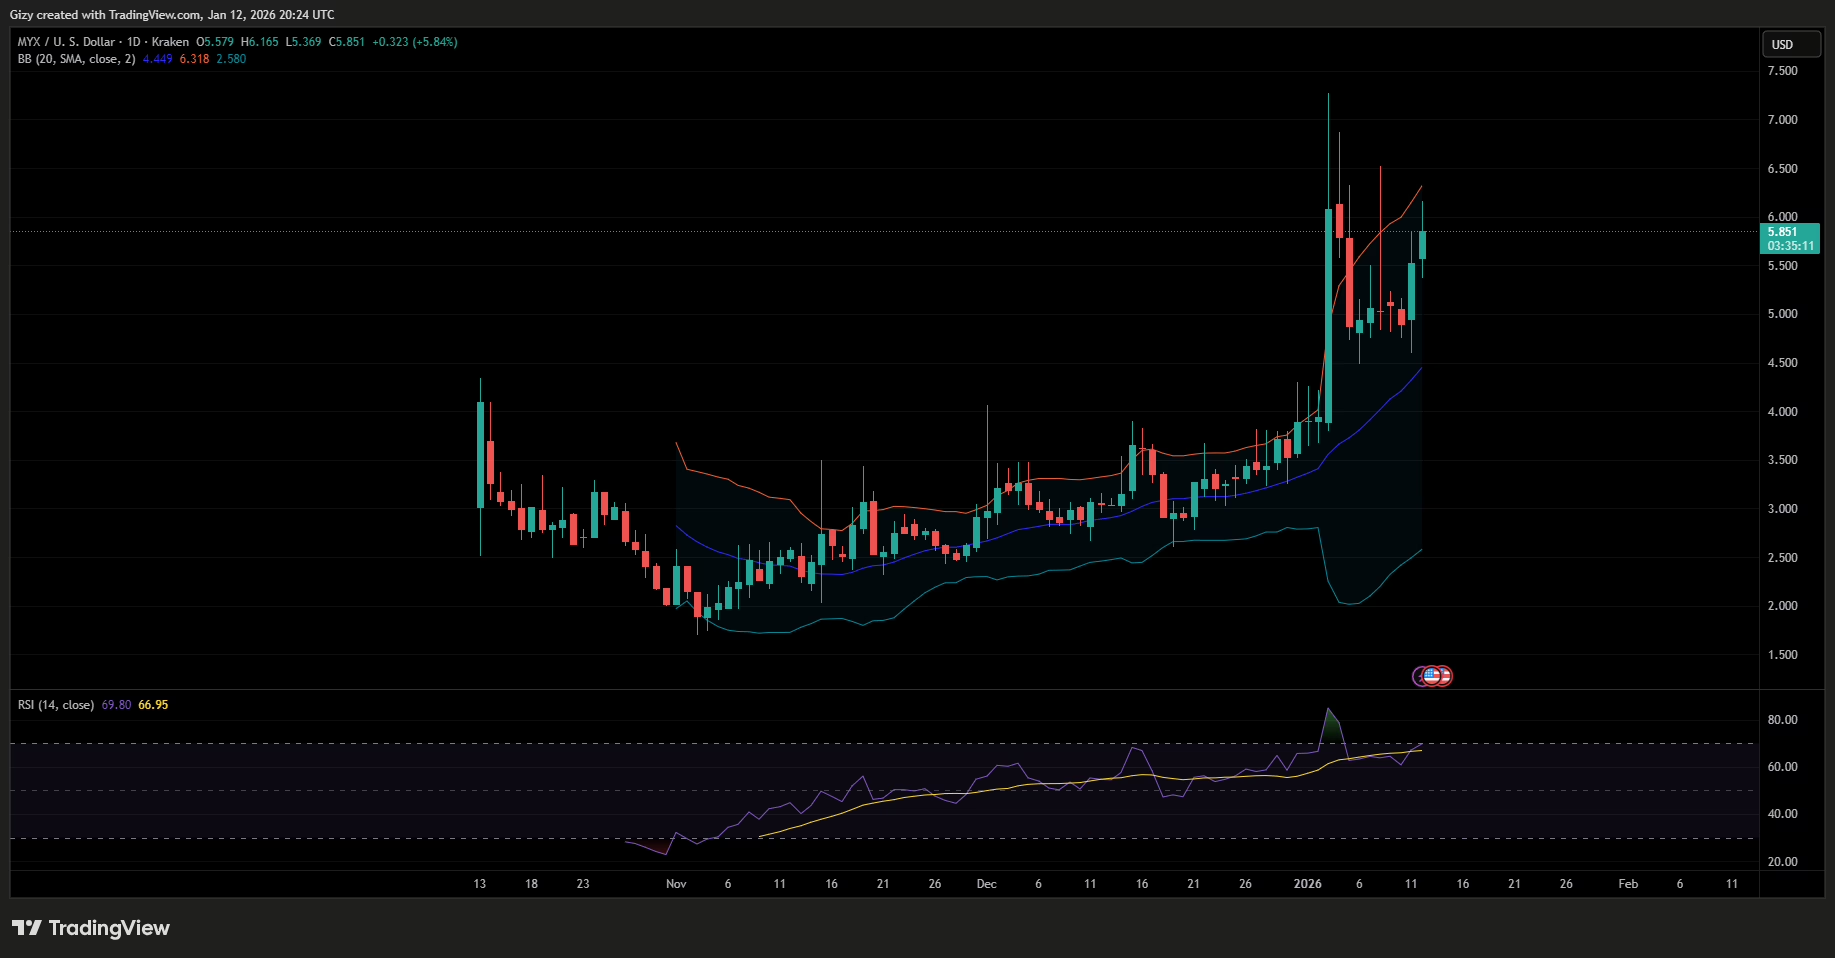
The new week kicked off with notable increases, continuing the previous day’s uptrend. Nonetheless, like HYPE, it retraced after testing a key level, but is trading up by over 5%.
A closer look at the 1-day reveals a trend that will play out in the coming days. The asset has been trading above the middle band for almost 3 months. It recently broke above the upper band and dropped close to the SMA. It then rebounded, continuing the trend.
MYX may break above the bollinger bands again in the coming days. However, it would retrace and find support near the middle bands.


