
Sui experienced another significant selloff at the time of writing. It currently trades over 2% below its opening price.
A red close on Sunday will mark the asset’s fourth consecutive day of notable losses. The latest downtrend started on Thursday when it shed over 4%. The release of key economic data and the bearish statement from US Federal Reserve governors were responsible for the decline.
However, the asset has since failed to shake off the sentiment. Nonetheless, the spike in selling pressure since then is not peculiar to SUI. The fear-and-greed index has retraced significantly over the last four days as liquidity leaves the crypto market.
Over the last four days, the asset has lost more than 11%. Additionally, it recently slipped to its 28-day low. It trades at $0.83 at the time of writing. A closer look at the 1-day chart suggests the bulls must defend the current price level after failing to hold above $0.87.
The latest downtrend comes on the back of the altcoin registering notable improvement onchain. One report on Mar 25 noted that the Sui platform was seeing a sharp increase in user activity, driven by new accounts.
Such a rise means the project is attracting new investments. However, current price action shows they had no positive effect on prices.
With fundamentals failing to trigger a buyback, indicators suggest that the latest 2% will signal an even greater downtrend in the coming days.
Pivot Point Standard Plots Sui Decline
The pivot point standard shows that between Mar 10 and 19, Sui traded between the PP and R1. However, it later lost the pivot point and has since struggled to regain it. Following repeated failure to flip this critical mark, it has since trended downward.
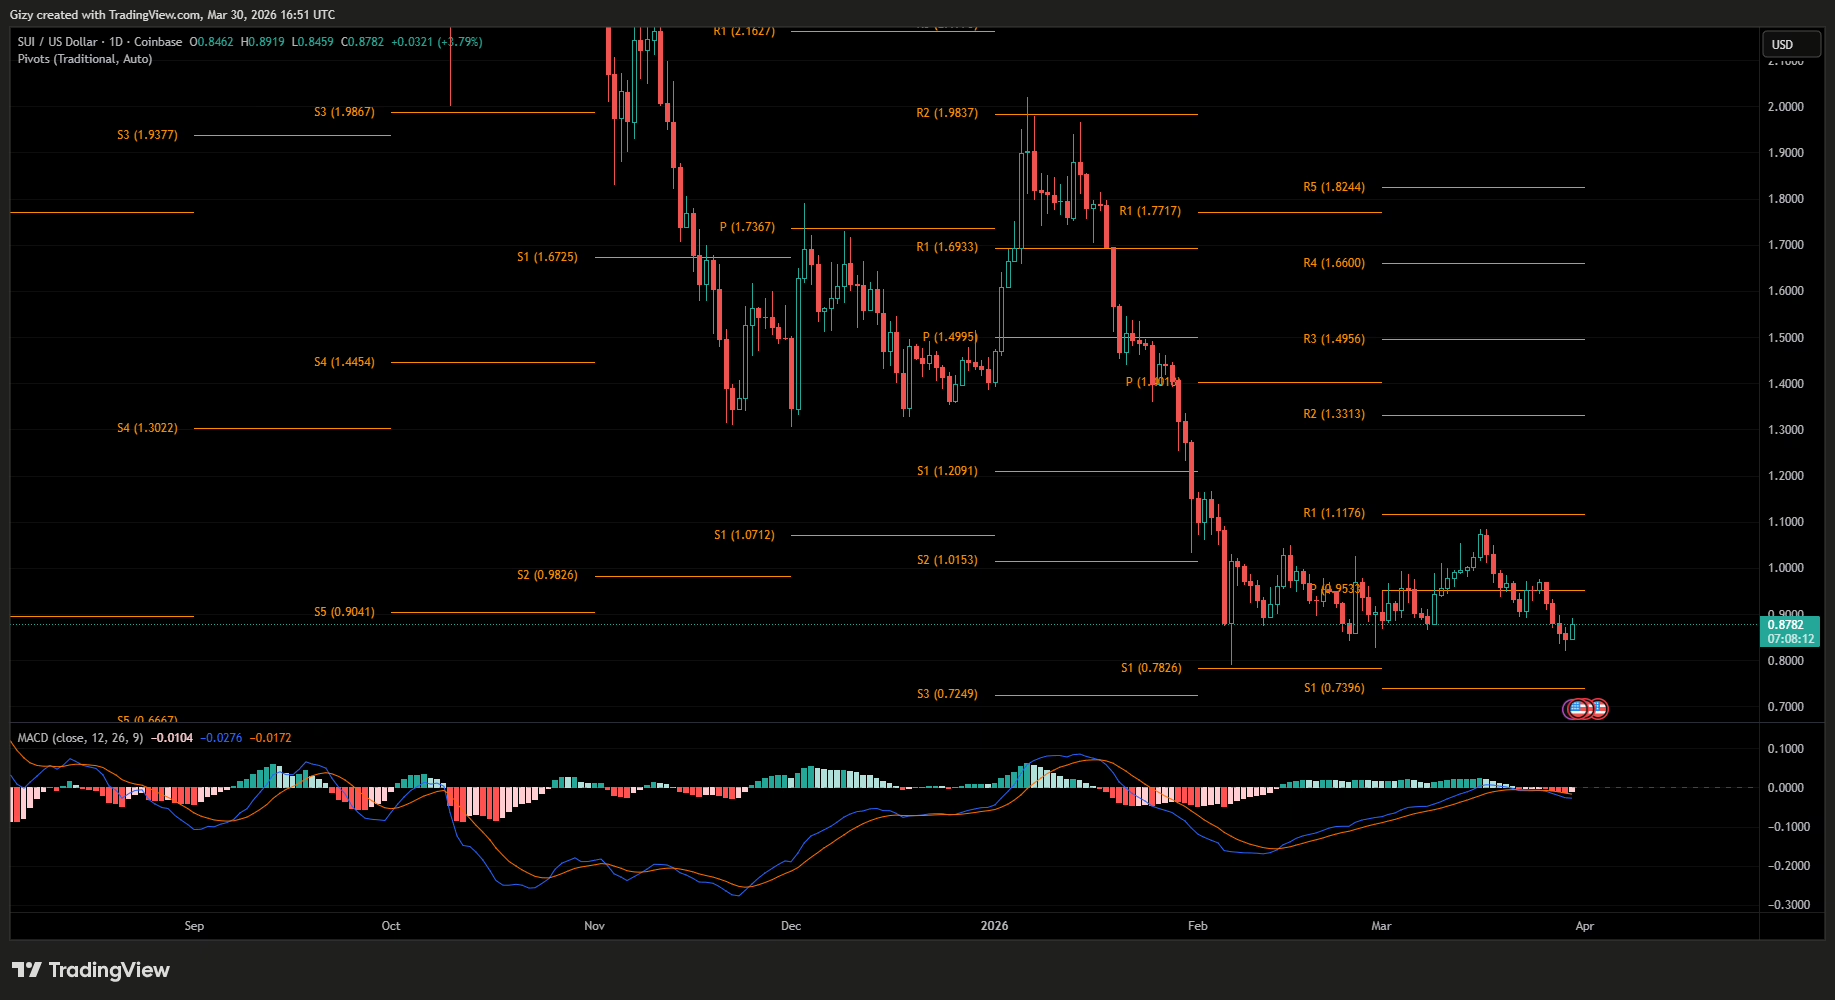
Sui may continue downward until it retests the first pivot support at $0.73. Its latest drop below the $0.86 support increases the likelihood of a surge slip.
The moving average convergence divergence pushes the target even lower. It had a negative crossover a few days ago. Interestingly, since October, the asset has shed an average of over 30% after each such divergence.
SUI has shed more than 11% in the last four days. It may retrace by another 19%. This will mean a slip to $0.68 in the coming days.
Nonetheless, other metrics place the low higher. For example, the asset is yet to fill the FVG it created in February. Recall that it retraced to a low of $0.79 on Feb 6 and quickly rebounded. It created a fair-value gap that may be filled in the coming days.
Regardless of the targets these indicators set, they all agree that Sui will likely retrace further in the coming days. In summary, they predict rebound around $0.79 and $0.68.
The only positive metric at the time of writing is the bollinger bands. It shows that the altcoin is due for recovery after it broke below the lower band on Friday and has been trending below it since. However, this does not tip the scales in favor of the bulls. It only suggests a short-term recovery before the decline continues in the coming days.


