Sui is currently experiencing its strongest upward trend this week. It has since erased the earlier losses and is edging closer to its previous highs.
The asset trades at $0.97, almost 6% higher than its opening price. Although it shows signs of slowing, it is currently trading above Tuesday’s high after slight rejections.
Sui continues the uptick that started on Thursday, buoyed by positive fundamentals. In hindsight, it has gained almost 8% in the last 48 hours. The latest change in price direction followed five days of consistent decline during which it lost over 12%.
Nonetheless, the bulls will look to continue the uptrend. However, questions remain about how high it will go in the coming days.
Sui Broke Out
The chart below shows that Sui has been declining since Jan 14. A closer look at the image indicates that this is the first time since the downtrend started that it is registering a two-day uptrend. Investors are taking the latest development as a sign of more to come.
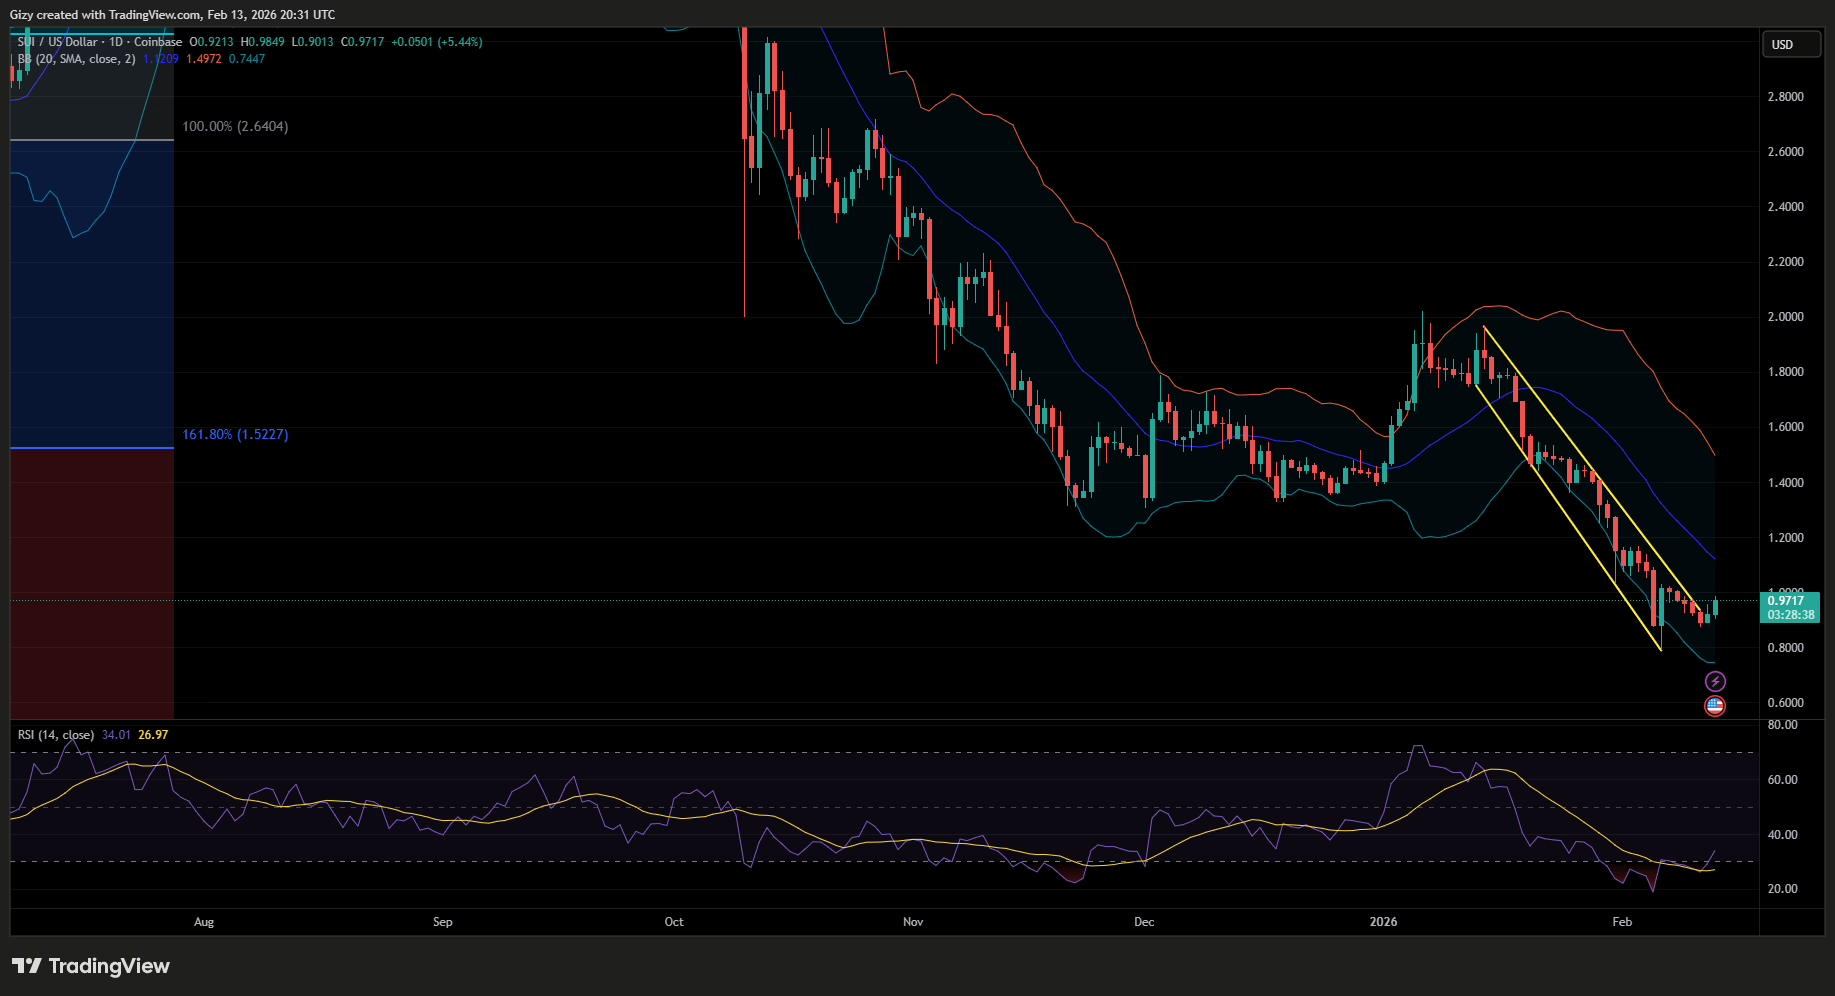
They may be right, as the chart reveals another important event. The coin followed the same downward path but broke out on Thursday and sealed it with another surge on Friday.
Aside from price movement, indicators are also flipping positive. For example, the relative strength index is back above 30, after spending several days below it. Previous movements show massive buying pressure following the slip below 30; the coming day may not be different. The two-day increase may be a sign of more to come.
Additionally, the moving average convergence divergence prints a near-complete bullish crossover, increasing the likelihood of further price surges.
With indicators and price movements supporting further uptrends, the question of how high Sui will go remains.
The bollinger bands offer a little insight into its next price target. Since rebounding off the lower band, it’s expected to retest the middle band. It means the asset will test $1.12 and $1.20 if the latter flips.
Bitcoin Cash Positive Crossover
Aside from Sui, Bitcoin also flashed green signals a few hours ago. The most prominent is the MACD one. A closer look shows that the 12 EMA intercepted the 26 EMA from below. With the divergence in full gear, a further uptrend is almost assured.
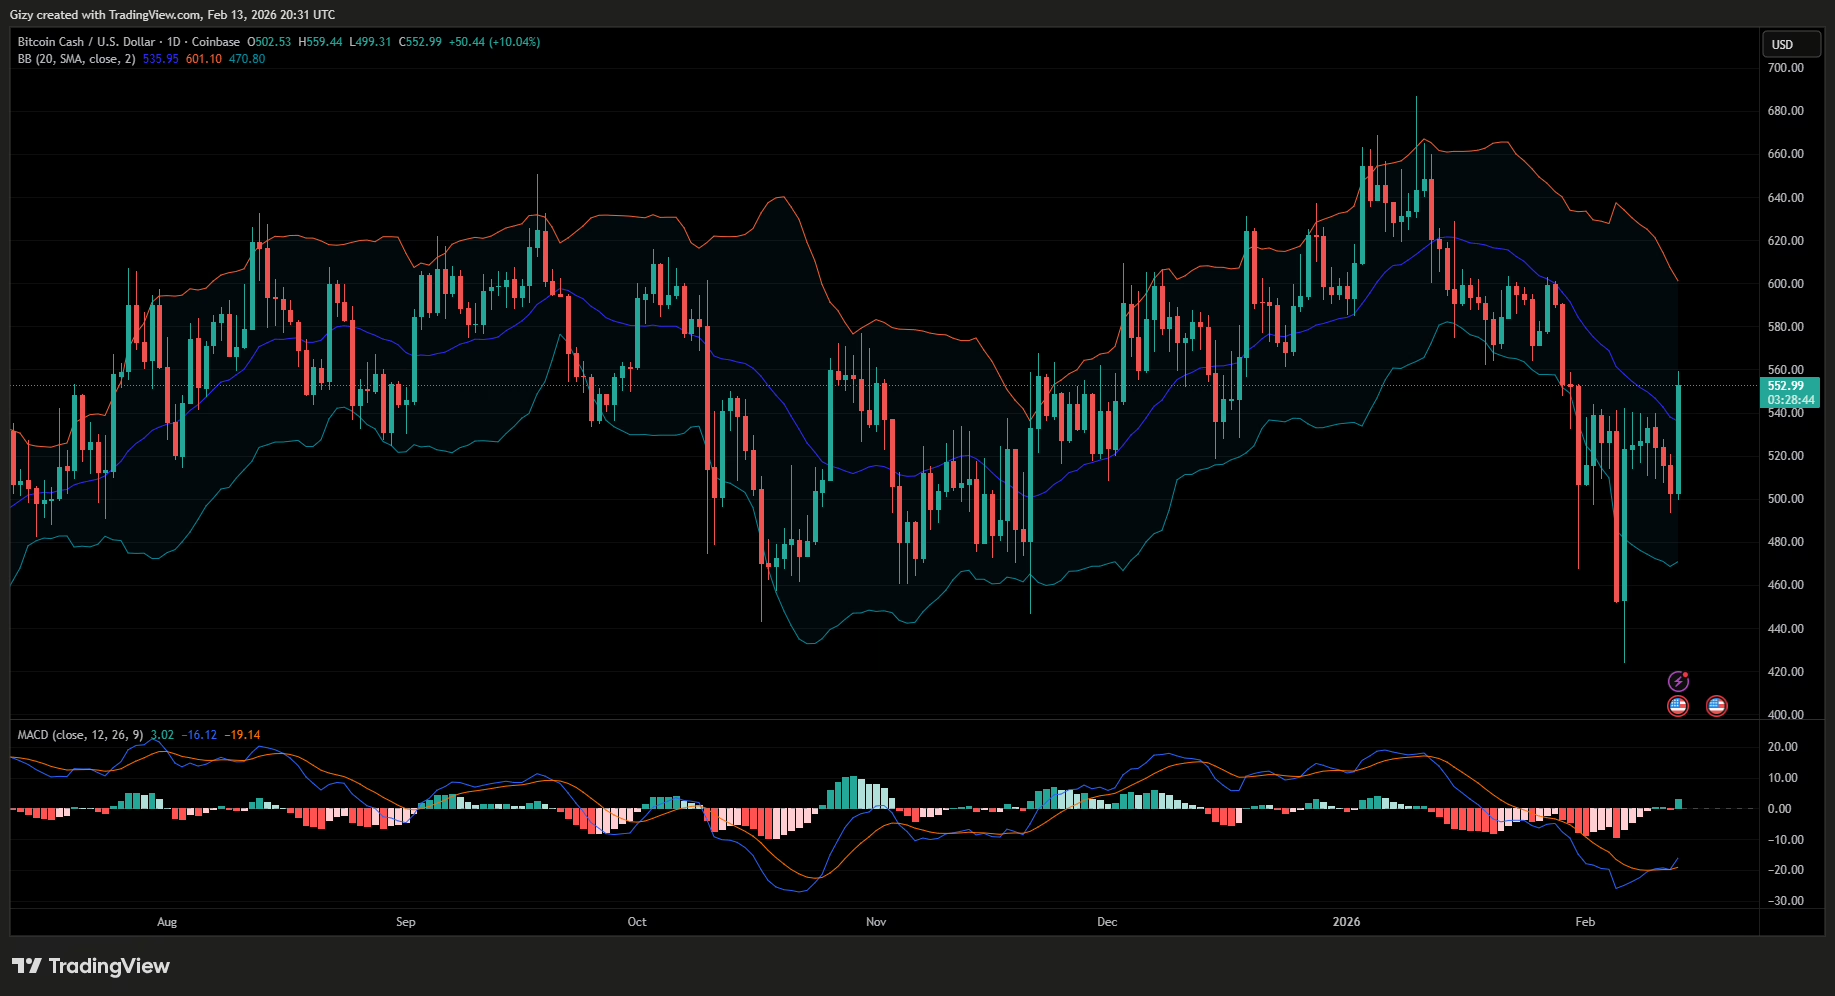
With regards to prices, BCH is edging closer to being the top gainer on Friday. It opened the day at $502 and surged to a high of $559. Although slightly lower than its high, it trades 11% higher than its opening price.
A closer look at the chart above shows that since Feb 1, the altcoin has failed to break above $542. During its latest hike, it rose above its fourteen-day high. While the sudden hike heightens fears of a reversal, the MACD suggests the pullback will be subtle and short-lived.
Additionally, there is a higher chance the bulls will defend $540 after struggling to flip it over in the last 14 days. If they sustain trading above this key mark, BCH will retest $600 next week.
The bollinger bands suggest an increased likelihood of this, as Bitcoin Cash is currently trading above the middle band. Since flipping the SMA, it will look to retest the upper band slightly above $600.
Get Trending Crypto News as It Happens. Follow CoinTab News on X (Twitter) Now


