Solana has been rangebound for most of the last thirty days. It saw reduced volatility at some point, but resumed significant price movement days later.
Trading actions during the first four days of March convinced it that the consolidation would end. It saw its biggest surge on Mar 4, surging from $84 to $90. However, the uptrend ended, and the altcoin retraced over the next few days.
The ensuing four-day downtrend has since ended, and Solana resumed its uptrend on Monday. The first signs of trouble appeared during the previous intraday session when it saw a correction after a sharp hike.
SOL prints a red candle at the time of writing. The bulls are struggling to continue the surge on Wednesday. As a result, the fear of significant declines looms. The worries are reaching a new level as CPI reports approach.
The latest correction is no surprise, as a previous outlook noted on the 4-hour chart, the bollinger bands suggest a significant decline. It predicted a slip to $82 if the bulls fail to defend the $84 support.
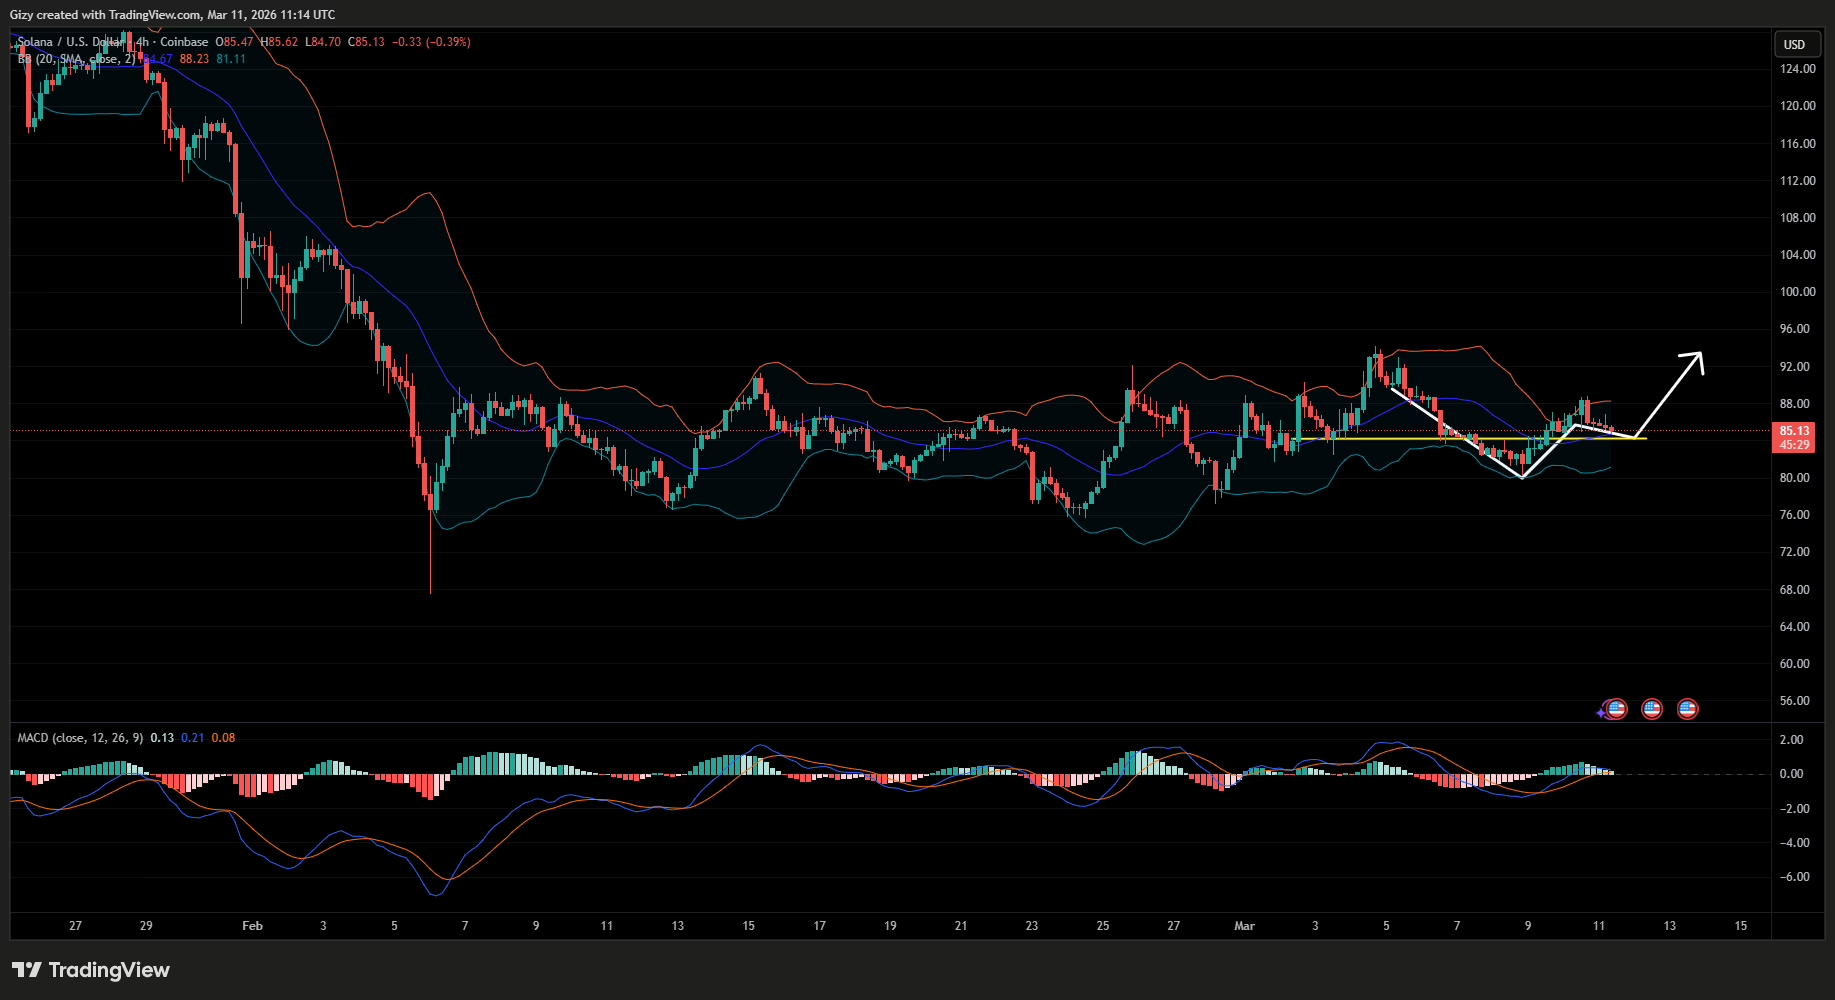
There’s more to it. On the same scale, the asset prints a bullish pattern. A closer look at the chart above shows that the four-day decline last week and recovery on Monday formed a V-bottom. In some cases, the asset may experience a brief decline before resuming its upward trend.
In those instances, it would rebound at the neckline. Prices are currently retracing and may retest $84 (the current neckline). If the bulls resume buying at this level, Solana will surge higher. The chart suggests an impending attempt at $92.
However, such a rebound hinges on the economic releases scheduled for Wednesday. If they come out negative, and the price slips below $82, it breaks out of the pattern.
Solana Must Hold $82
Previous price movement shows several declines ending at $84. However, a slip below $82 is also likely. In cases where buybacks failed at this key mark, a drop below $80 was inevitable. If the expected reports come in negative, a slip below $78 may take place in the coming days.
Aside from fundamentals, the moving average convergence divergence is flipping negative on the 4-hour chart. It is close to completing its bearish crossover, which raises concern given that the last one led to a 13% correction.
Before the latest divergence, the last prominent one led to a 10% decline followed by a rebound. The impending crossover may lead to a 10% drop, bringing the price to $76 if fundamentals come out negative.
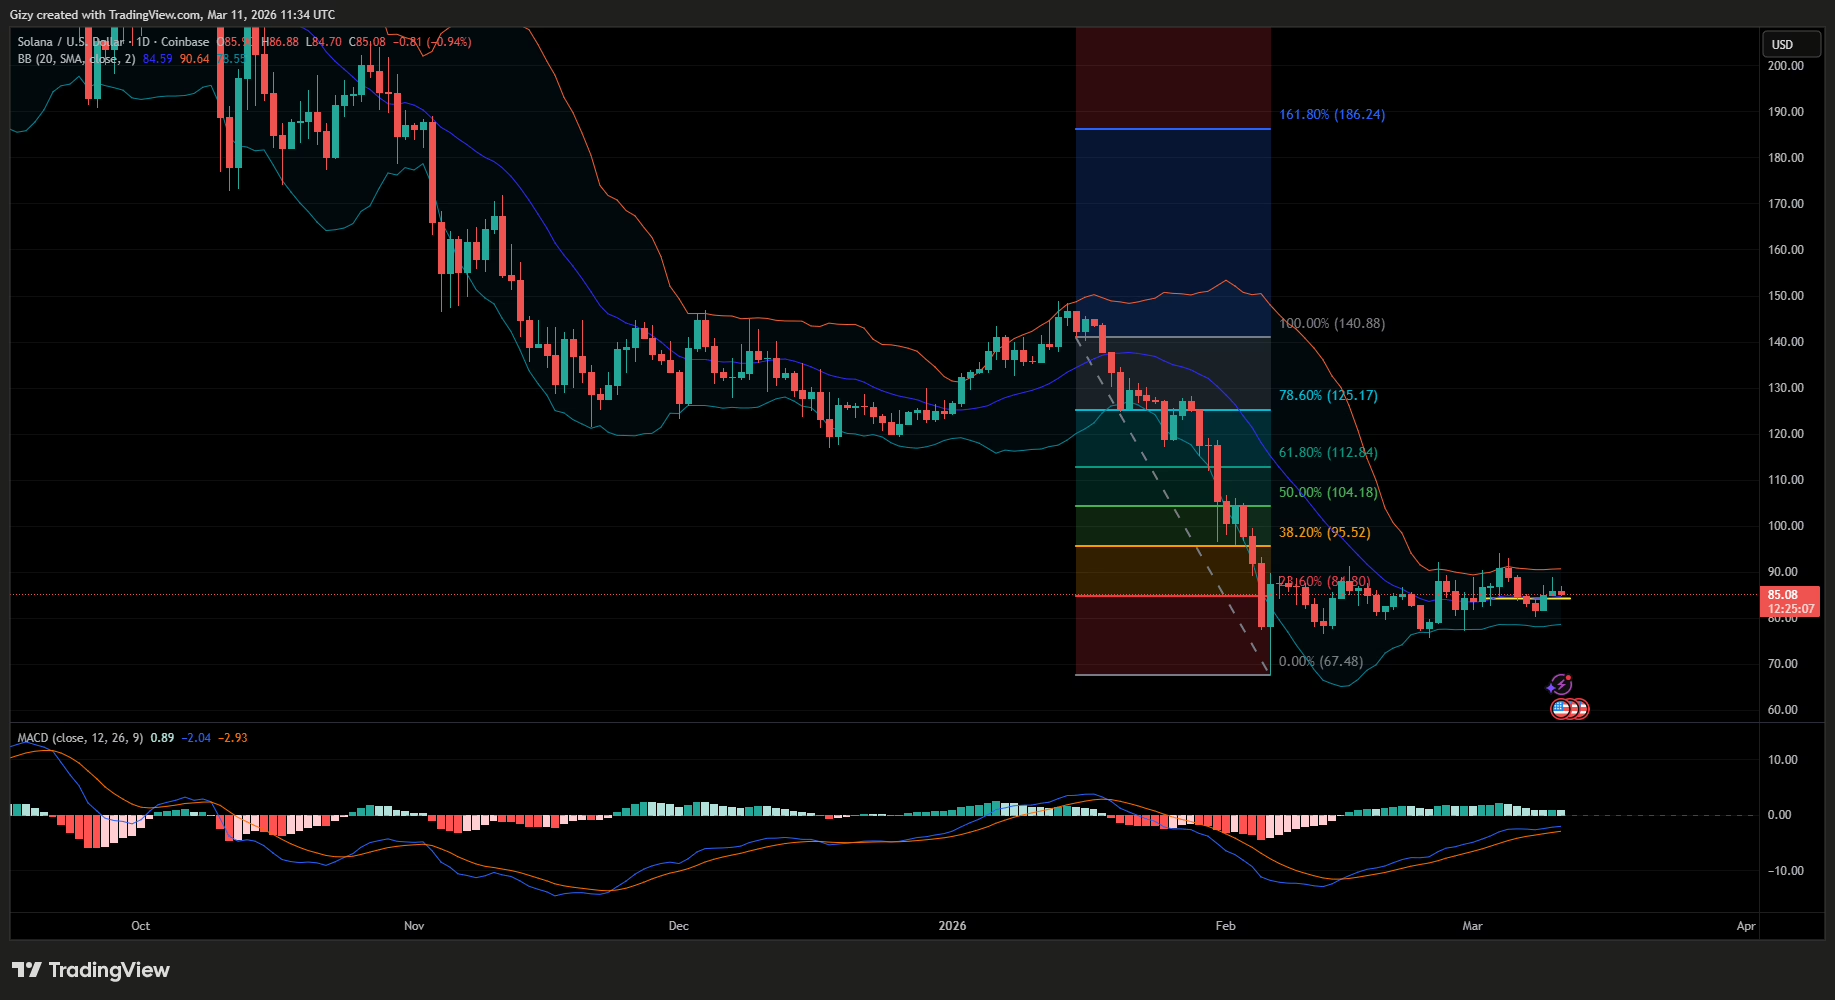
On the 1-day, MACD’s histogram has printed the same bars over the last three days. It suggests that although buying pressure increased two days ago, the bulls are yet to fully seize control 0f market. Nonetheless, they are also showing signs of exhaustion, and SOL prints a red candle.
The Fibonacci retracement levels show that Solana has remained within the 38% and 0% levels. It is currently trading above the 23% fib level but is struggling to sustain momentum. If it has downward momentum spikes, it would slip back below this level, increasing the chances of further declines.
The bollinger bands indicate that a drop to $77 will follow such a slip.
Get Trending Crypto News as It Happens. Follow CoinTab News on X (Twitter) Now


