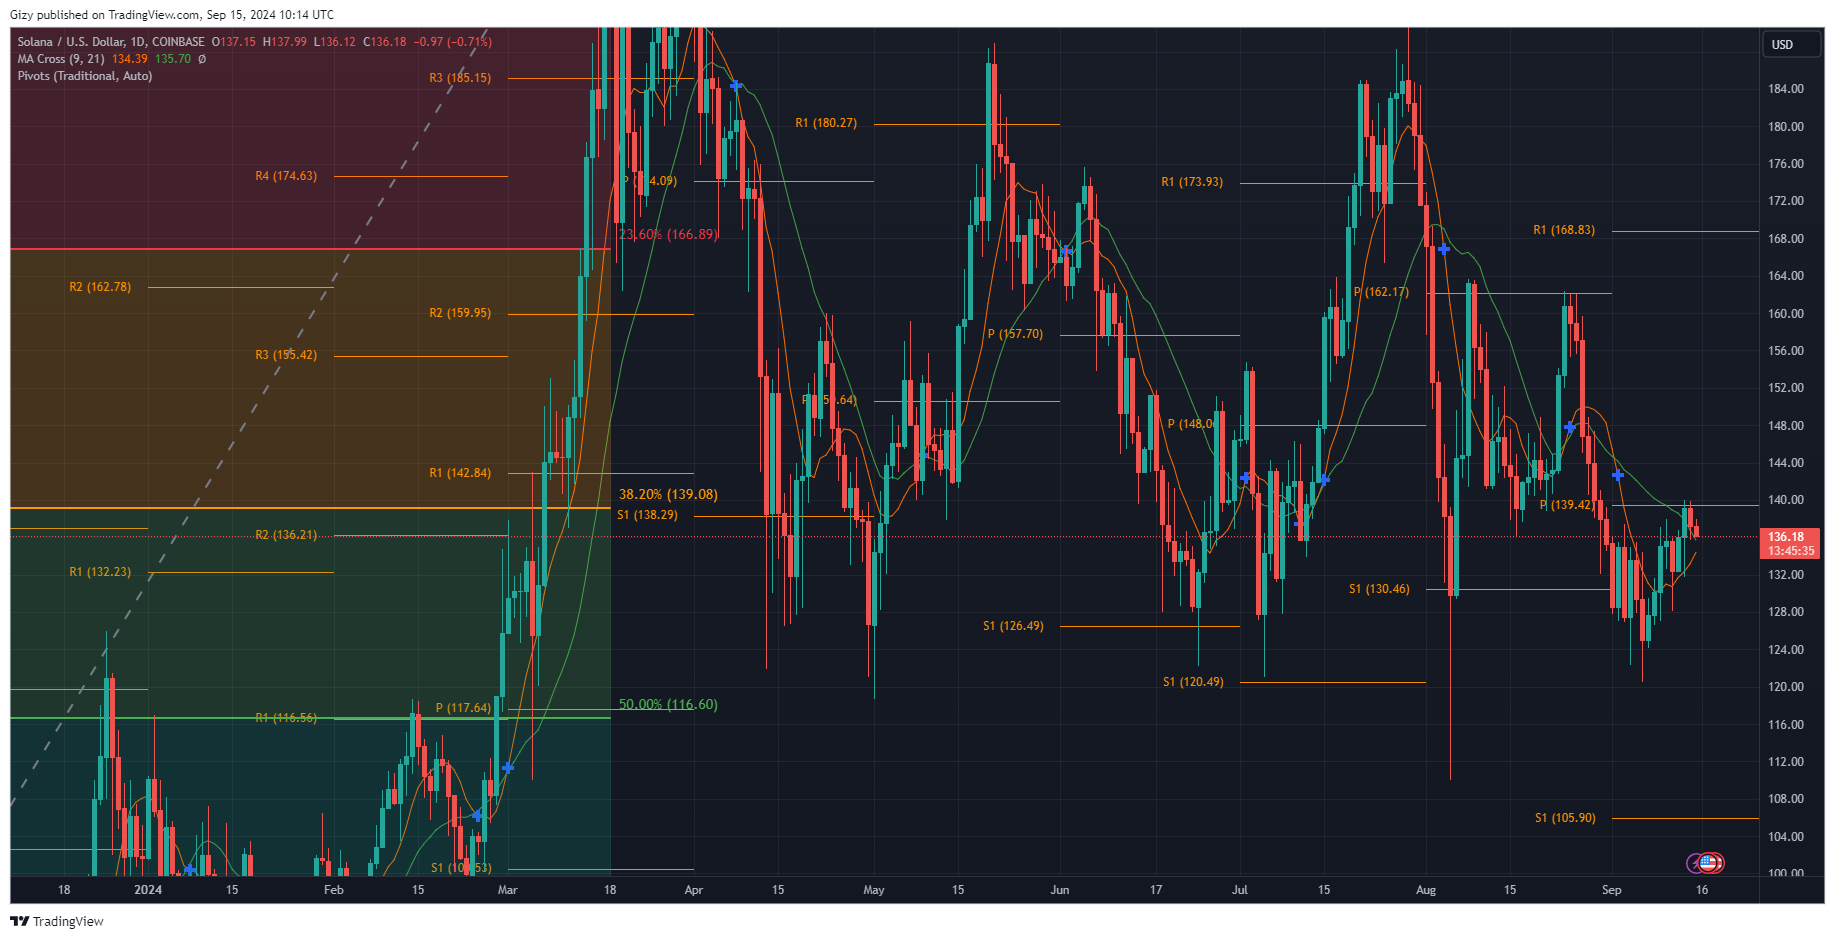
Solana started September 12 at $132 and experienced a significant increase in buying volume that shot prices up. It peaked at $136 and is currently up by over 3% in the last 24 hours.
The latest peak continues a trend that started on the first day of the current month. The altcoin has not climbed above $140 since the start of the present thirty-day session. Many traders are astounded that the asset failed to break short-term resistance despite the slight market improvement.
Nonetheless, the latest increase is due to a positive fundamental affecting a token within the Solana ecosystem. Kraken recently announced that it will list POPCAT in the coming weeks. In response, the memecoin surged by over 20%.
Why Solana is yet to Break Above $140
SOL has yet to break out for several reasons. The most glaring is a drop in investors’ interest. The memecoin frenzy is gradually coming to an end, and the activities on the Solana Network have significantly reduced.
One indicator of this assertion is a drop in Pump.fun volume. Data from DappRadar shows that it dropped by over 70% over the past month. Additionally, the number of transactions significantly dropped during the same period. Estimates suggest a 30% decline.
Data from Dune Analytics shows a sharp decline in the daily transactions on the Solana network. Between August 13 and September 10, they dropped from around 20,460 to 1,778.
Other metrics point to the continual drop in network activity. Data from DefiLlama stated that as of September 10, the total value locked in Solana had decreased by over 13% from $5.48 billion on August 25 to $4.77 billion.
Trading volume has significantly dropped as developers and traders have reduced interaction with the ecosystem.
The most recent trend proves several analysts right about unsustainable previous surges. The consistent rejections around $138 also indicate the continual selling congestion.
Solana is Due For a Breakout
Solana’s price movement suggests that it is due for a breakout. An indication of this is its consistent retest of the $140 resistance. It tested this critical level more than twice in the last three days.
The candle is also thinning as the asset is gradually losing momentum. For example, it retraced to a low of $131 and retested the highlighted mark. It prints a red candle with a shorter body as the bulls fail to continue the surge.
Nonetheless, indicators are pointing at the continuation of the uptrend. One such is the moving average convergence divergence. The metric is printing buy signals. It had a bullish divergence a few days ago.
The 12-day EMA is still on the uptrend, increasing the chances that the SOL may resume its uptrend.
The moving averages agree with this assertion. Solana may be in for more price increases as the 50-day MA is on the uptrend and will intercept the 200-day MA, signifying a Golden Cross.
With both bullish indicators pointing to an impending flip of the highlighted level, the chances of this happening are at their peak.
In the Coming Days
The altcoin will look to resume the uptrends following the current day’s decline. The bulls must keep prices above $130 as a slip puts SOL at risk of dropping below $120 as the 50% Fibonacci retracement level is around $116.

Nonetheless, breaking the $140 resistance may guarantee a retest of $160. It remains to be seen how price will play in the coming weeks.
However, the market is anticipating a huge swing as the long-awaited FOMC meeting will take place on the 18th of this month. The outcome may accelerate the uptrend or drive the price to further lows.
Nonetheless, Solana’s POPCAT is struggling to maintain the uptrend after a week filled with several milestones. For example, it is up by over 20% over the last six days.
