
Solana edged closer to $130 at the start of the week but saw in momentum shift on Monday, causing it to lose all its gains. It also ended with no significant price change.
The coin retraced further over the next few days, shedding almost 4% and retesting the $120 barrier. Nonetheless, the downtrend ended on Thursday, with a nearly 2% hike, and continued the next day.
The slight increase over the last 40 hours revived confidence in a higher close by 2025. It remains to be seen if the bulls will sustain the current momentum into the coming week. However, the likelihood of such action is low, as there is no strong incentive to trigger a massive run.
The US economic calendar for the next week shows no strong fundamentals for the next seven days. Nonetheless, investors are fixated on the Fed’s minutes, which may set the tone for the coming year.
Away from fundamentals, the 1-day chart depicts SOL locked in a rangebound trend. The pattern began last Thursday, when SOL failed to decisively flip $129, and repeated the same action the next day. Monday’s price movement reaffirmed the selling congestion at the mark.
The asset retraced below $120, but subsequent price action confirmed significant demand concentration at that level.
The liquidation heatmap also presents a reduced likelihood of a breakout from the range-bound movement. To the top, there are several clusters of liquidations. However, some of the largest are around $126 and $129. The bears will undoubtedly defend these marks, keeping prices below them.
Nonetheless, the chance of a significant downtrend below the $120-$119 barrier is almost not feasible as there’s an even stronger long liquidation cluster around it. In comparison, the bulls will lose over $37 million if the support level breaks, while the bears will lose an average of $23 million if either resistance level breaks.
Solana Descending Triangle
While Solana remained rangebound over the last seven days, a bigger trend is unfolding. It has traded within a falling triangle over the last 30 days. Price action this week saw the asset maintain the trend.
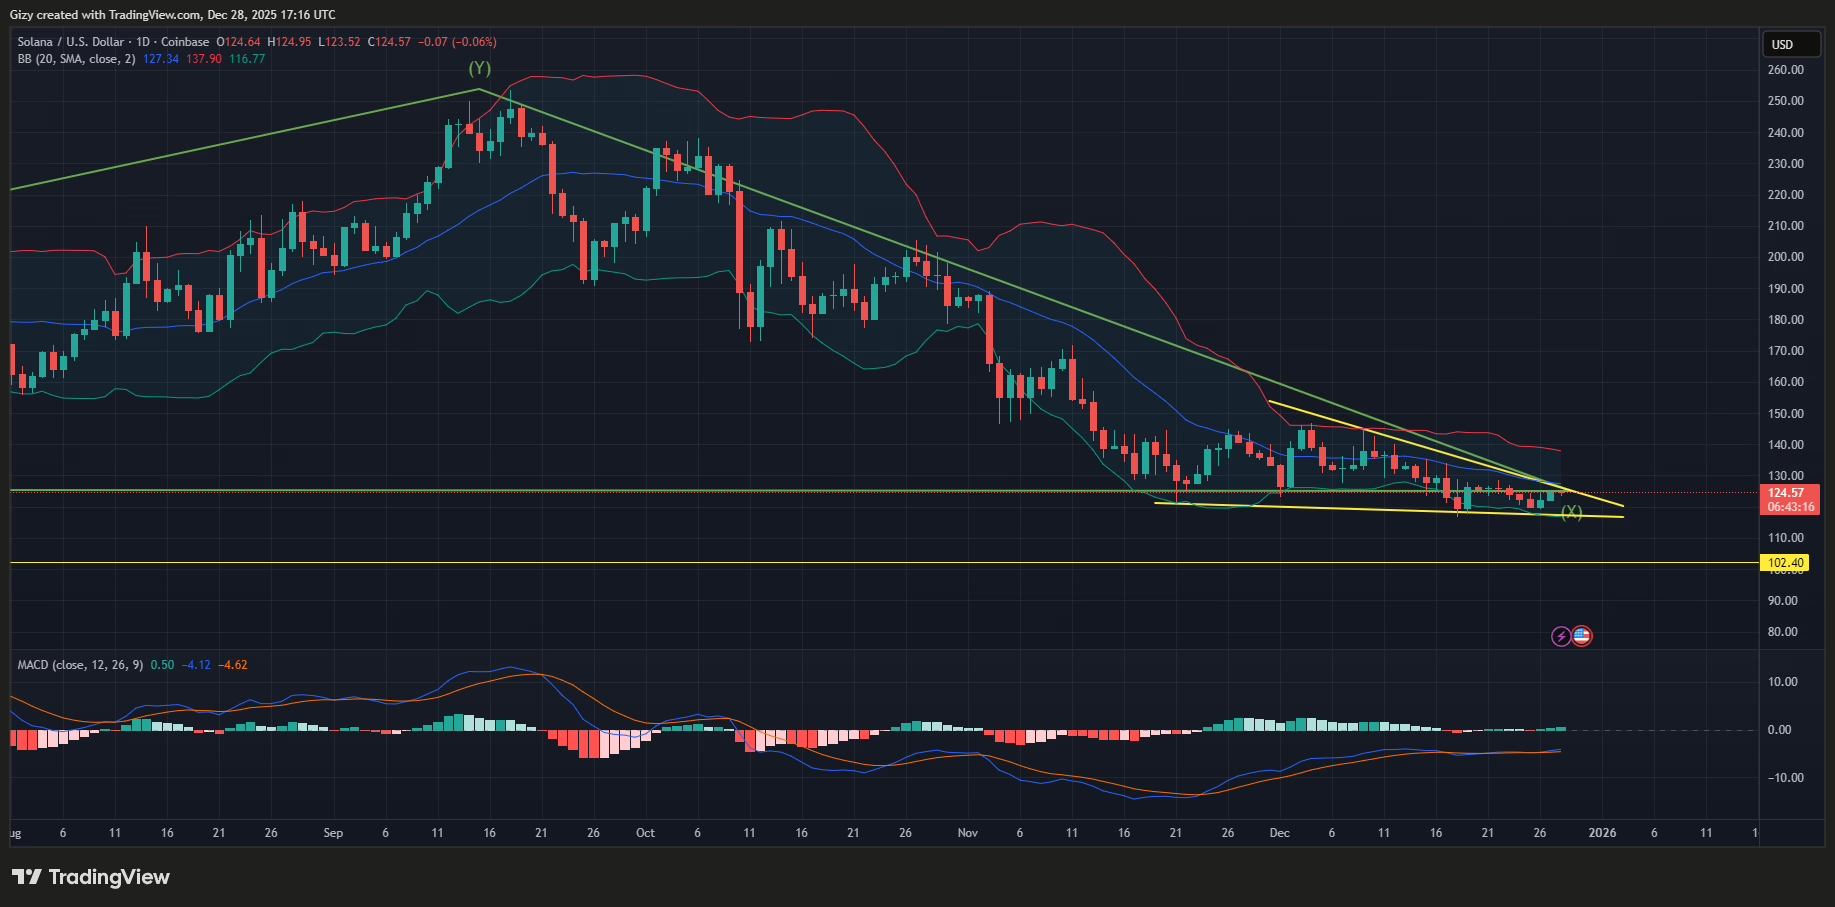
Nonetheless, a closer look at the chart indicates that a breakout is imminent. It is worth noting that at the start of the descending trend in November, SOL experienced significant volatility. However, the asset gradually became less volatile, leading to a narrowing in its trading channel.
When the trading channel tightens, as seen in the chart above, the asset will break out in the coming days. In this case, if the bulls sustain the current uptrend, the altcoin will break above the chart pattern within the next 48 hours.
A breakout to the top is more likely as it typically follows a descending triangle. However, the reverse happened on different occasions. If the coin fails to surge, it may break below the pattern next week.
The moving average convergence divergence on the 1-day chart recently had a positive crossover a few days ago. Its recent readings suggest that the asset may surge higher in the coming days. MACD’s readings align with those from the bollinger band, which hints at the asset continuing upwards following its rebound from the lower band.
In a nutshell, next week will reveal the next price action for January, depending on which direction SOL breaks out. Nonetheless, volatility may increase over the next seven days. If that happens, chart patterns and indicators are currently positive, indicating a high likelihood of a surge.
SOL’s Double Top
The 1-day chart shows that the altcoin has slightly bullish prospects. However, the same does not hold for the 1-week timeframe.
A close at the current price will see Solana post another red candle on the 1-week scale, marking its fourth consecutive week of decline. A closer look at price action shows the asset registered an average loss of 2% during this period.

Zooming out, another chart pattern becomes more visible. Looking at September 2024, the altcoin had a massive uptrend that ended in January, after a brief pause a few weeks earlier. The coin ended the upward trend after peaking at $295.
Solana continued its downtrend but rebounded in April. It entered another significant uptrend afterward, but met resistance in September. Although not exactly at equal tops, the just-explained movement is a double-top pattern.
The double top is a bearish pattern that signals further decline. What seals the downtrend is when the asset breaks below the neckline (the support). In this case, the asset has broken support several times. However, it closed the week above it.
The candle representing the current week shows that the asset is trading slightly below the barrier. A close at the current price may seal the massive downtrend that follows the chart pattern. It would mean that Solana may struggle to surge in January.
Solana Could Experience a Tough Start To 2026
Trading action next week will dictate price actions at the start of January. In either case, a bearish performance during the first month of 2026 is almost inevitable.
Nonetheless, the altcoin may see a slow start to the month as investors slowly return to the market following the holidays. Volatility may pick up during the second week, and the downward price movement may resume.
A look at previous price action when SOL broke the neckline gives a brief glimpse into what may happen in the coming days. The asset retraced below $100 in April, then rebounded to $95. A repeat may happen in January. After breaking below the $120 barrier, the 1-week chart shows no strong demand concentrated level above $100.
All eyes are fixed on the close of the current week and how prices will perform in the coming one, as they hold the key to subsequent price action.


