ETH dropped to $3753 a few hours ago but rebounded and is now trading at its opening price. It may be heading for another close.
Data from CoinMarketCap shows that ETH is seeing a more than 3% decline in trading volume. The coin is currently grappling with less volatility due to the drop in volume.
The crypto market is experiencing the same trend as the altcoin market. Buying and selling declined by over 7% in the last 24 hours. The drop in trading volume is reflecting on the global cryptocurrency market cap, causing it to decline slightly.
A closer look at the data on TradingView indicates that the market is yet to register any significant increase since the week started. It is surprising, as there are several news reports of massive adoptions of cryptocurrency by institutions.
FORM is the biggest gainer in the last 24 hours; it rebounded from a low of $3.28 and surged to a high of $3.86. Its current price suggests that it was up by 12%. XDC follows with gains exceeding 5%.
Assets in the top 10 barely moved since the week started. They are grappling with notable selling pressure as investors flip bearish. It’s worth noting that the fear and greed index is at 63. Although the same as the previous day, it remains lower than the previous week’s reading.
BTC/USD
On Monday, BTC opened at $119,491 and pushed closer to $120k but faced notable rejection at $119,856. It saw a slight decline and closed the day with no significant price change.
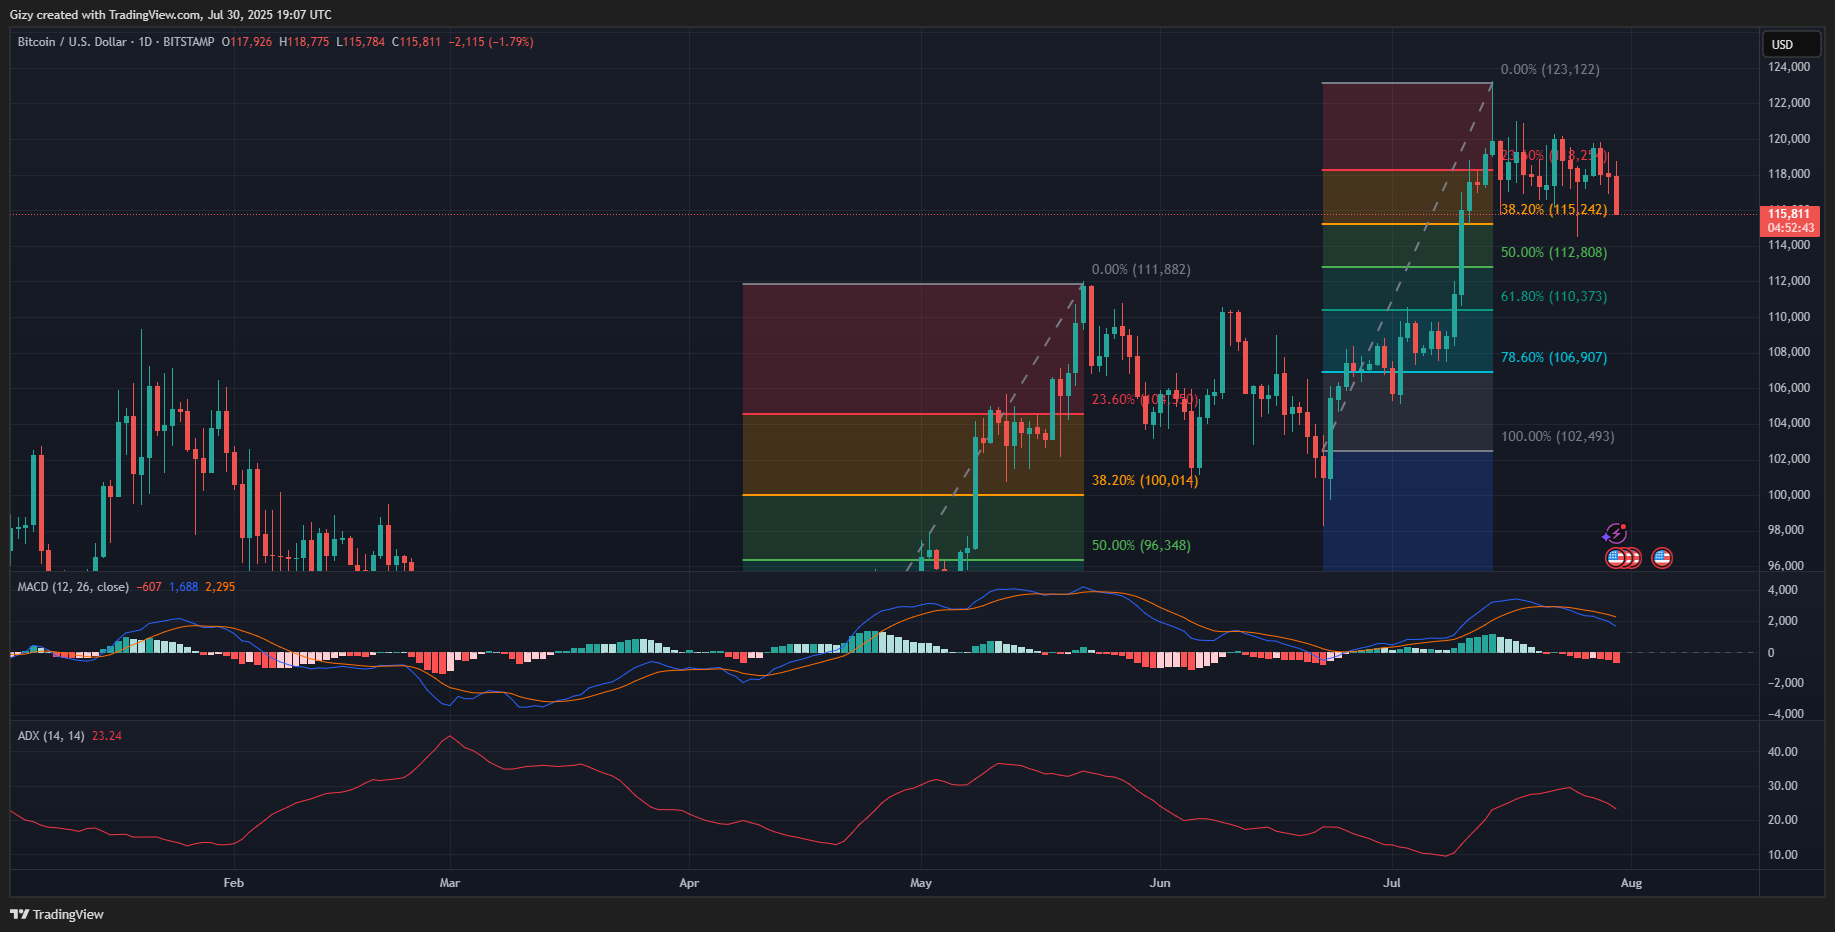
Bitcoin retraced to a low of $116,952 from $118k the following day and reached a peak of $119,297. The coin faced notable selling pressure, dropping and closing the day lower than its opening price.
BTC is printing one of its longest candles since the start of the week. It dropped to a low of $115,832. It is grappling with reduced buying pressure around $117,800.
Data from CoinMarketCap sheds more light on the reason for the apex coin’s failure to break out. Trading volume since the week started is significantly low. It dropped by over 7% in the last 24 hours.
Indicators on the 1-day chart print sell signals at the time of writing. The moving average convergence divergence shows the 12 EMA and 26 EMA on a downtrend, following the bearish interception last week.
While RSI is relatively stable, the average directional index suggests a massive bear presence as the indicator continues downward.
Nonetheless, the Fibonacci retracement levels indicate that the asset is trading closer to the 23% level. Prices support this claim as the $117k becomes a mark with notable demand concentration.
ETH/USD
A few hours ago, selling pressure increased, causing it to drop to $3,676. There is no sign of halting as the price continues to fall and it edges closer to the previous day’s low.
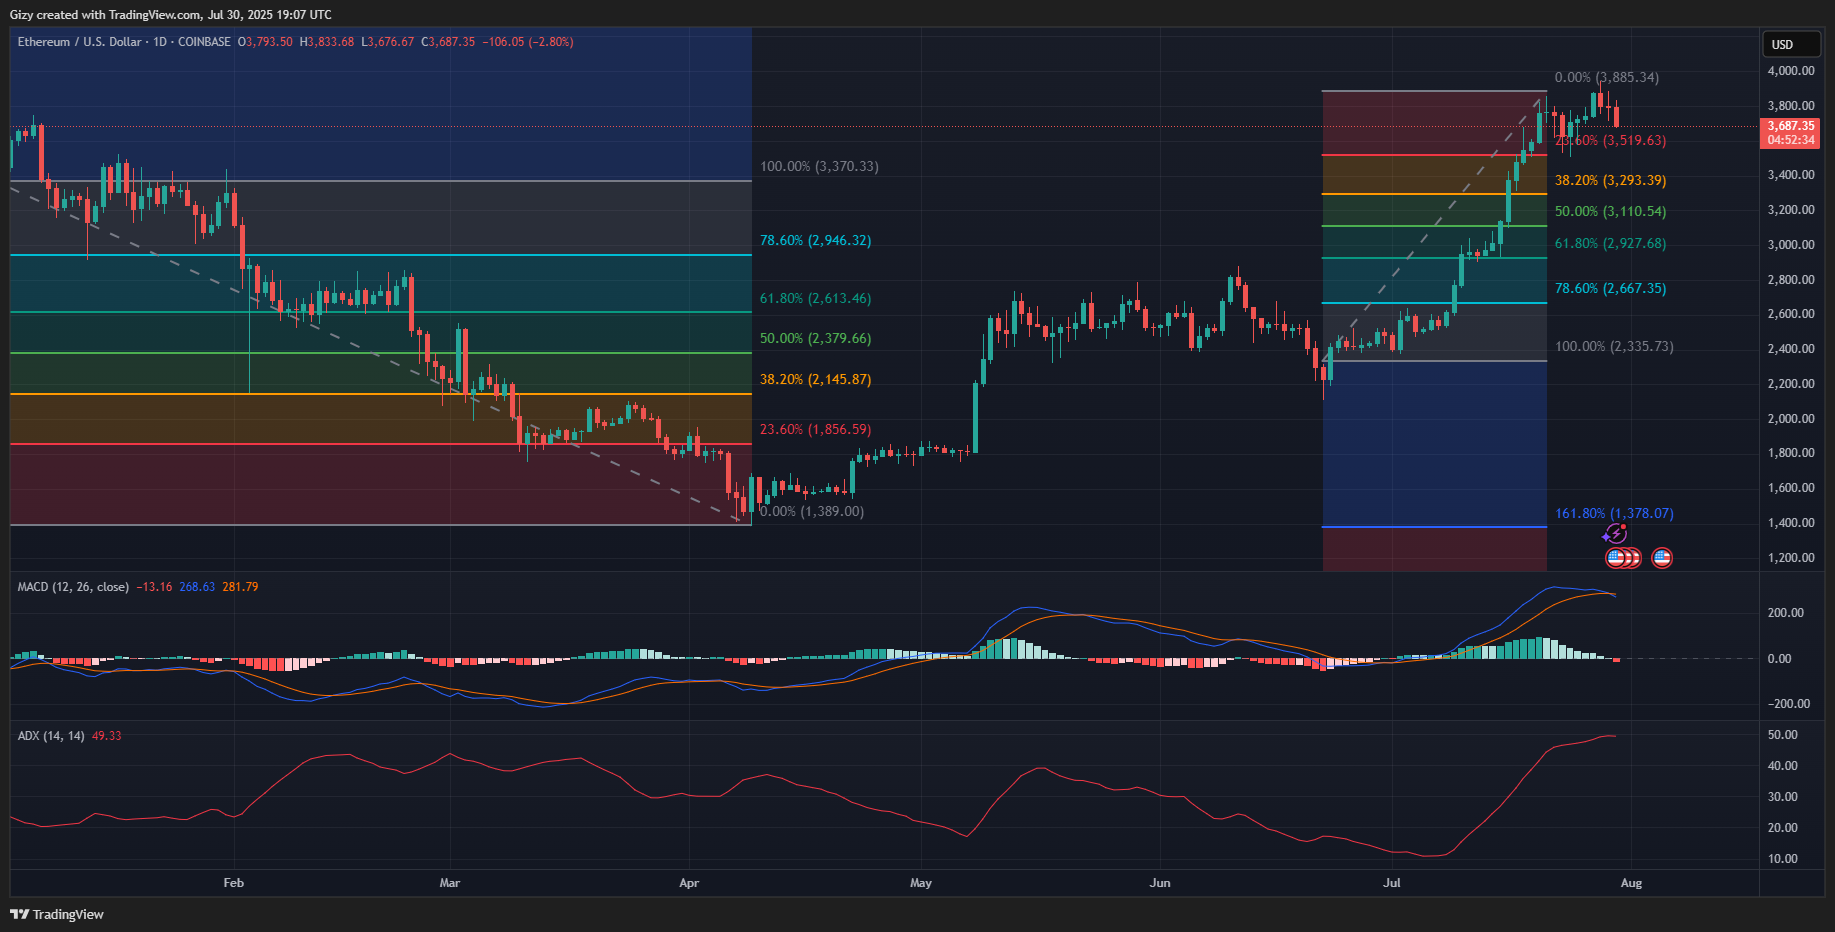
However, the coin printed a doji on Tuesday and saw reduced trading action. It peaked at $3,886 and retraced back to $3,715 before it finally closed with prices slightly lower than its opening price.
Nonetheless, ETH faced notable selling pressure on Monday, when it opened trade at $3,873, the coin pushed closer to $3,900 but faced a decline as it retraced back and ended the day at $3,799.
Ethereum just had a massive bearish event. MACD’s 12 EMA intercepted the 26 EMA in a bearish divergence. The phenomenon typically marks the end of an uptrend. However, the current price suggests that the altcoin is starting a downtrend.
Nonetheless, the average directional index is on the rise amid trading actions in the last three days that saw ETH lose over 2%. The relative strength index indicates a gradual increase in selling pressure, although it has declined slightly.
XRP/USD
XRP faced notable selling pressure, recording a 4% loss on Monday. The coin started trading at $3.24, peaking at $3.331 but retraced back and hit a low of $3.107 before it finally closed trading at $3.132.
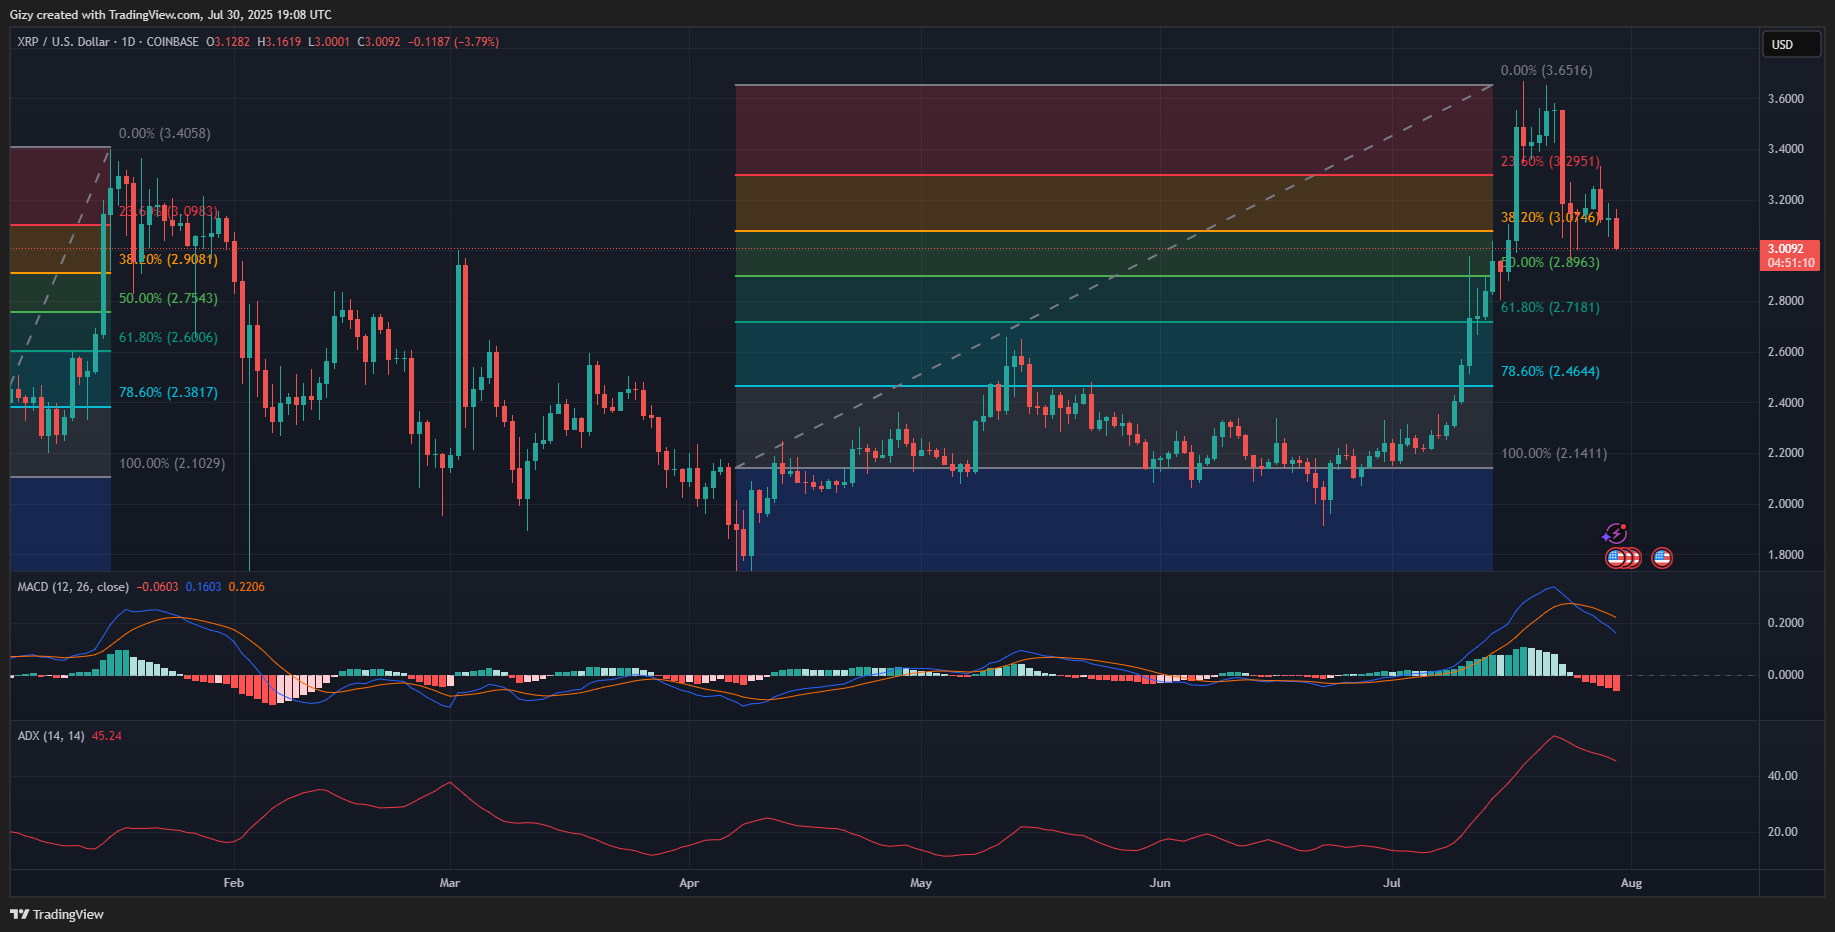
However, Tuesday came with the coin printing a doji as it had no significant price change. Nonetheless, it saw a slight increase as it hit a high of $3.18. The coin closed at $3.127.
The selling pressure continues in the last few hours. The coin is currently facing a low of $ 3,040.4, trying to regain momentum by pushing to meet the previous day’s high, but hasn’t quite succeeded in hitting that price.
Indicators are yet to display a different signal after they flipped bearish last week. MACD is on the downtrend as the 12 EMA and 26 EMA sank lower. The histogram associated with the mark prints a longer red bar in response to the growing gap between the two EMAs.
ADX points to further declines as the indicator continues its downward movement. Nonetheless, RSI shows a slight attempt by the bulls to halt the downtrend.
BNB/USD
BNB is facing a massive downside movement in price this week, as the selling pressure continues. In the past hours, a 2% loss is noted as the price dropped to a low of $769 but is currently trading at $783. Today’s trade opened at $805, peaking at $811 before retracing and dropping to its current price.
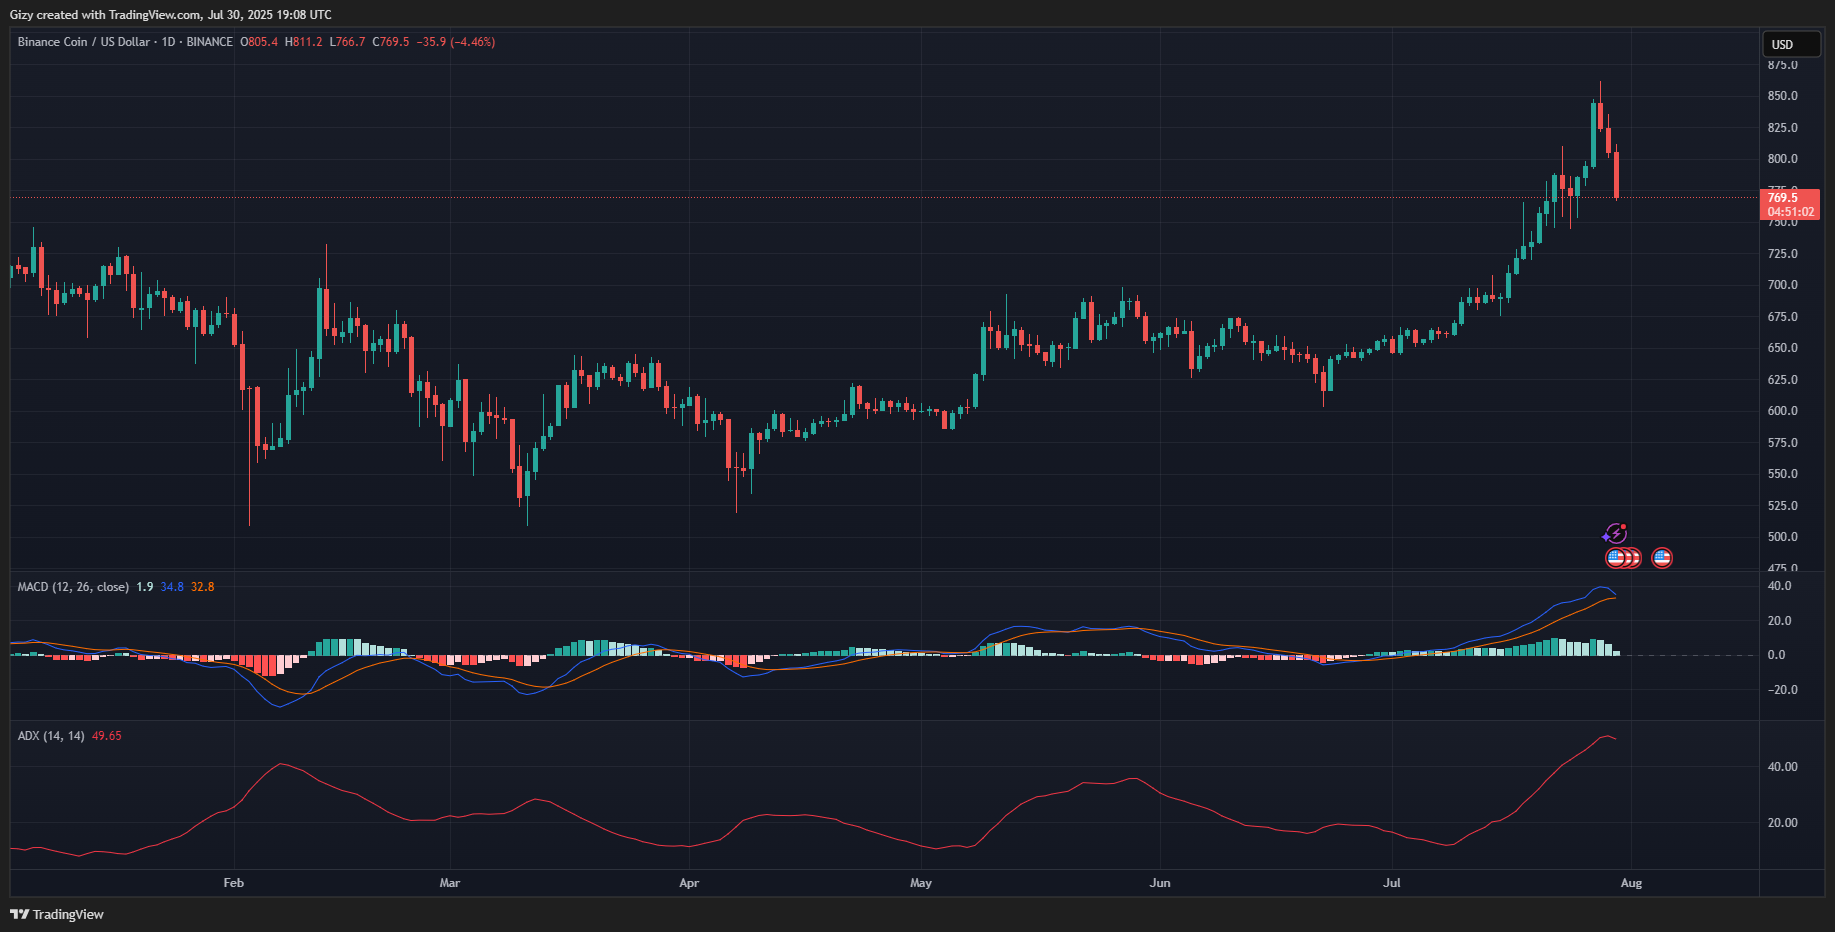
Nonetheless, the coin peaked at $835 on Tuesday, after its opening trade started at $824. However, the price continues to drop as the selling pressure mounts, resulting in a low of $800 before finally closing at $805.
BNB started the week with an opening price of $844, as seen on Monday. The coin also suffered a 2% loss as its closing price was $823 despite reaching a peak of $861. It retraced and faced a low of $821, causing a downtrend.
The moving average convergence divergence prints sell signals at the time of writing. The 12 EMA is on the downtrend and edges close to intercepting the 26 EMA. Completing the convergence may herald the start of a downhill movement.
The average directional index raises concerns about its next price action. The metric halted its uptrend on Monday and is in a downtrend at the time of writing.
SOL/USD
Like ETH, SOL is edging closer to registering its third day of consecutive declines. Altcoin lost over 4% during this period.
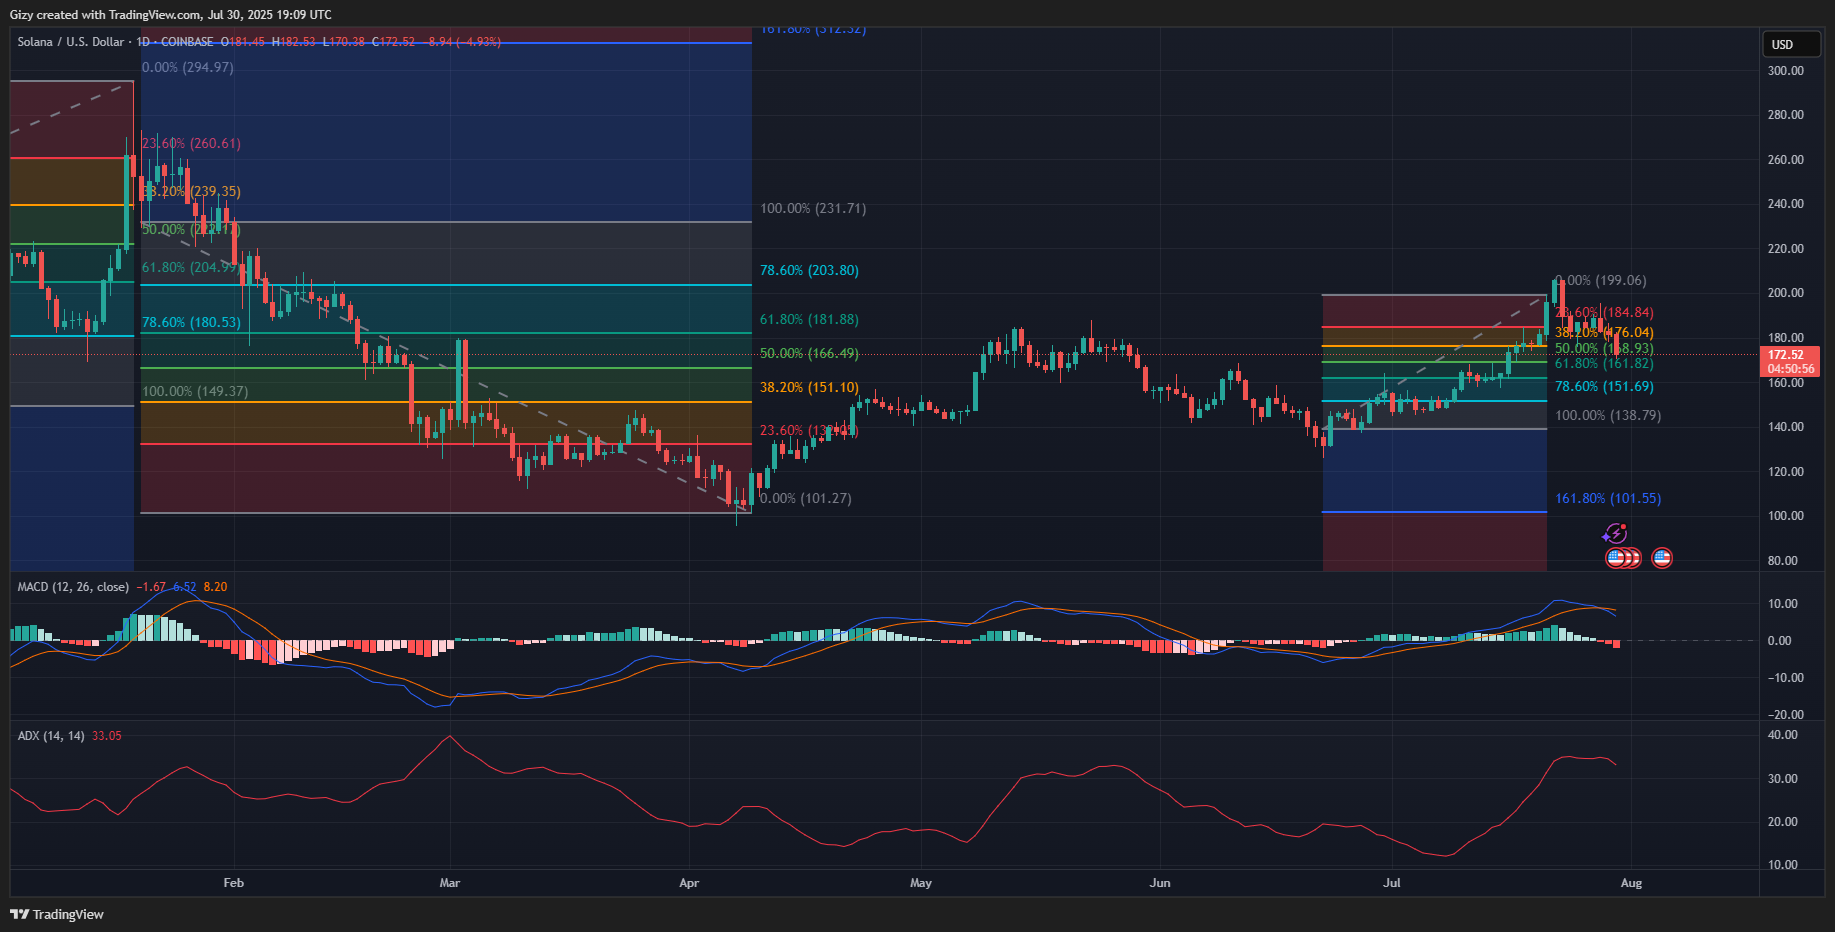
Nonetheless, indicators remain negative. MACD remains prints sell signals following its bearish divergence last week. The ADX is seeing a similar movement, arching downward after days of trending parallel.