
XRP rebounded after four days of consistent decline. It prints its longest green candle this week as the bulls rallied.
XRP is not isolated in the turnarounds; it joins the rest of the market as buybacks resume. Friday marked another bearish day for the cryptocurrency industry, as it experienced massive selling pressure. Price action mimicked those of the previous week.
It is worth noting that bearish fundamentals caused the massive declines. Threats of further bearish trade policies prompted traders to panic, resulting in a significant selloff. An examination of the entire week’s action reveals that the sector grappled with massive negative sentiment.
The fear and greed index plummeted in response. However, the slight shift in price trajectory in the last 24 hours shows that investors are shrugging off the bearish news. Trading volume increased by over 12% in the last 24 hours.
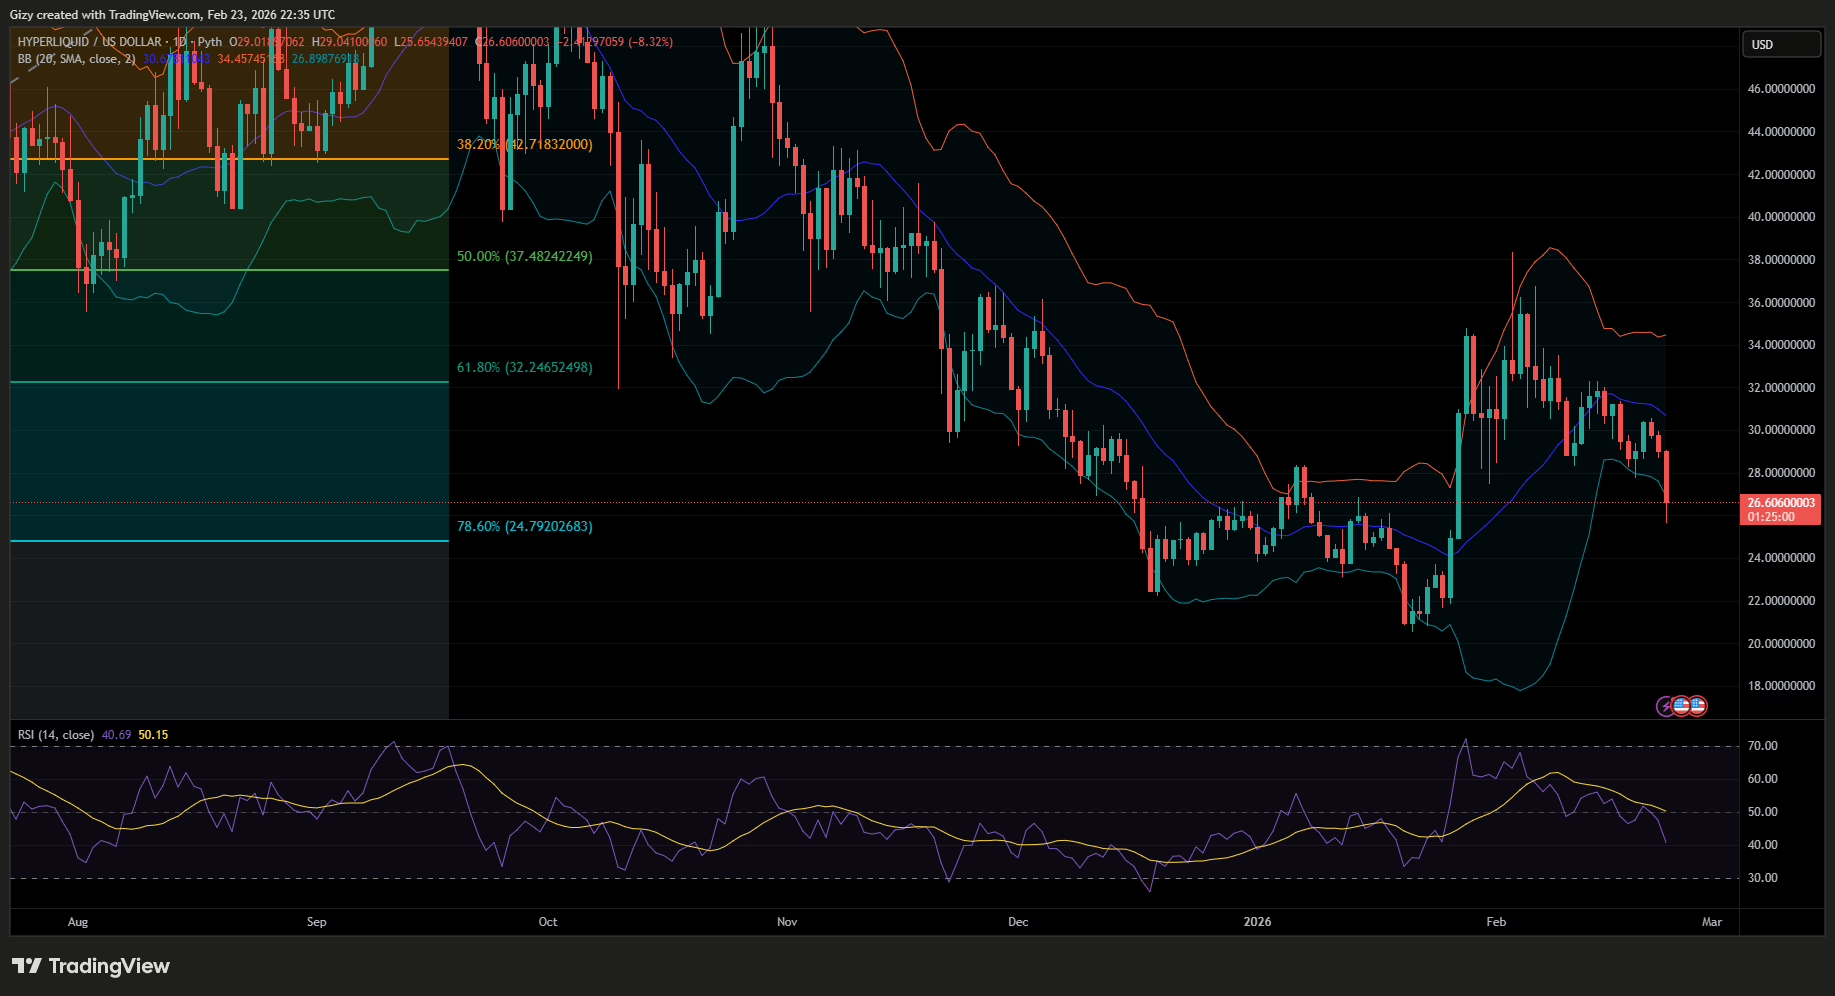
Assets like Hyperliquid and Cronos are among the gainers over the last 24 hours. CRO surged from $0.099 to a high of $0.109. It is by more than 7% amid slight retracement. HYPE continued upward after its recovery.
Assets in the top 10 are seeing similar inflow and will look to reclaim lost levels. Let’s see how they performed in the last five days.
BTC/USD
Bitcoin retraced to a low of $103,127 a few hours ago as selling action resumed following the previous day’s trend. It rebounded and is currently trading at $104,897 at the time of writing.
The current day marks its first green in the last five days as it grappled with massive selling congestion. Its sluggish start to the week worsened the next day as the apex coin failed to break above $108k. It has since been on the decline amid several attempts at buybacks.
Onchain data shows that the asset is seeing healthy buying pressure at the time of writing. Data from CryptoQuant reveals more traders are moving assets from exchanges, more than those sent into the platform. The trend caused a slight decline in exchange reserves.
Indicators are flipping bullish in response to the latest rebound. The relative strength index halted its descent, rising from 50 to 52 as buying pressure grew. Its readings reflect the accumulation and distribution chart, indicating that the bulls are absorbing the excess supply.
However, the moving average convergence divergence is yet to react to the latest improvement as it continues its downtrend. This is the same reading as the average directional index.
ETH/USD
Ethereum is seeing a similar trend as XRP. It is experiencing notable increases for the first time in three days. It had its most significant decline on Friday, dipping from $2,649 to $2,531. The largest altcoin closed with losses of almost 4% amid attempts at buyback.
The one-week chart suggests that ETH may end the session with no significant increases. It was on the uptrend during the first half of the seven-day session, hitting a high of $2,789. However, it trades slightly lower than it did at the start of the week.
ETH rebounded from a low of $2,476 a few hours ago and is now trading at its opening price. The ongoing buyback has little or no effect on indicators. The average directional index continues downward, indicating a strong bearish presence.
MACD prints a similar trend. It continues its downtrend as the 12-day EMA dips lower. Nonetheless, RSI halted its decline in response to the slight increase in buying pressure.
Previous price movement shows that the asset rebounded at a critical level. A slip below $2,470 may see ETH retrace to $2,300.
XRP/USD
XRP is one of the top 10’s biggest movers. It marks its first green after three days of consistent declines. The asset lost over 8% during this period, dipping from $2.31 to $2.13. It returned to levels not seen in more than two weeks.
XRP slipped further on Saturday, dropping to a low of $2.08 before rebounding. The altcoin has since recovered and surged past its opening price. It trades at $2.19, more than 2% higher than it started the day.
Nonetheless, some indicators are printing buy signals at the time of writing. The average directional index halted its downtrend a few days ago. It continued its rise in response to the latest surge. The relative strength index is printing the same signal, surging from 37 to 42.
However, MACD has yet to respond to this trend. It continues to decline, displaying additional sell signals.
The one-day chart shows that XRP rebounded off the $2 support. Previous price movements suggest that the asset may retest $2.30 if the bulls sustain the uptrend.
BNB/USD
Recall that a previous analysis hinted that Binance coin will see further declines. It stated that the asset will retrace to as low as $640 if the bulls fail to defend $660. It retraced to a low of $646 a few hours ago but rebounded and is now trading slightly higher than its opening price.
BNB is seeing a spike in buying pressure at the time of writing, as indicated by its current price. It is seeing a significant uptick for the first time in two days. The altcoin retraced by almost 5% during this time. It erased Tuesday’s gain and hinted at a bearish close this week.
RSI is surging in response to the latest change in price trajectory. It increased by 2 points in the last 24 hours. Its readings coincide with those of the accumulation and distribution chart. The metric shows that the bulls are soaking up the supply.
SOL/USD
Solana is experiencing a similar price action as XRP. It recovered from a low of $152 and traded slightly higher than its opening price.
RSI is surging in response to the latest change in price trajectory. It increased by 2 points in the last 24 hours. Its readings coincide with those of the accumulation and distribution chart. The metric shows that the bulls are soaking up the supply.
However, it has yet to erase its previous losses. One of the biggest dips happened on Friday when the asset retraced from $166 and broke the $160 mark. It continued to decline, reaching a low of $155. Solana closed with losses exceeding 6%.
Other metrics are yet to react to the slight increase. The average directional index continues downward, indicating a strong bearish presence. MACD prints a similar trend. It continues its downtrend as the 12-day EMA dips lower.
Get Trending Crypto News as It Happens. Follow CoinTab News on X (Twitter) Now


