
XRP may end the week with notable gains following the slight declines it saw midweek. It retested a key level but failed to flip it a few hours ago.
XRP is seeing notable increases amid a slight decline in traders’ sentiment in the last 24 hours. The crypto fear and greed index saw a noteworthy decrease in value during this period, dropping from 53 to 50.
The metric explains the reason for the halt to the price surge of some crypto assets. Trading volume is 9% lower than the previous day as the market registered a slight drop in liquidity inflow. The global cryptocurrency market cap reflects this trend as it retraced from $3 trillion.
Nonetheless, the last seven days were some of the most bullish for the sector. Most altcoins experienced a price revival. PENGU surged from $0.0050 to $0.00742 on Tuesday. The uptrend continued for most of the week, and the asset may close with gains exceeding 149%.
SUI is one of the top gainers over the highlighted period. It surged to a high of $2.74 from $2.19 on Tuesday. The uptick continues, as it broke above the $3 resistance but then retraced to $3.81. It may end the week with gains exceeding 68%.
Several assets in the top 10 registered a similar price move. Let’s take a closer look at them.
BTC/USD
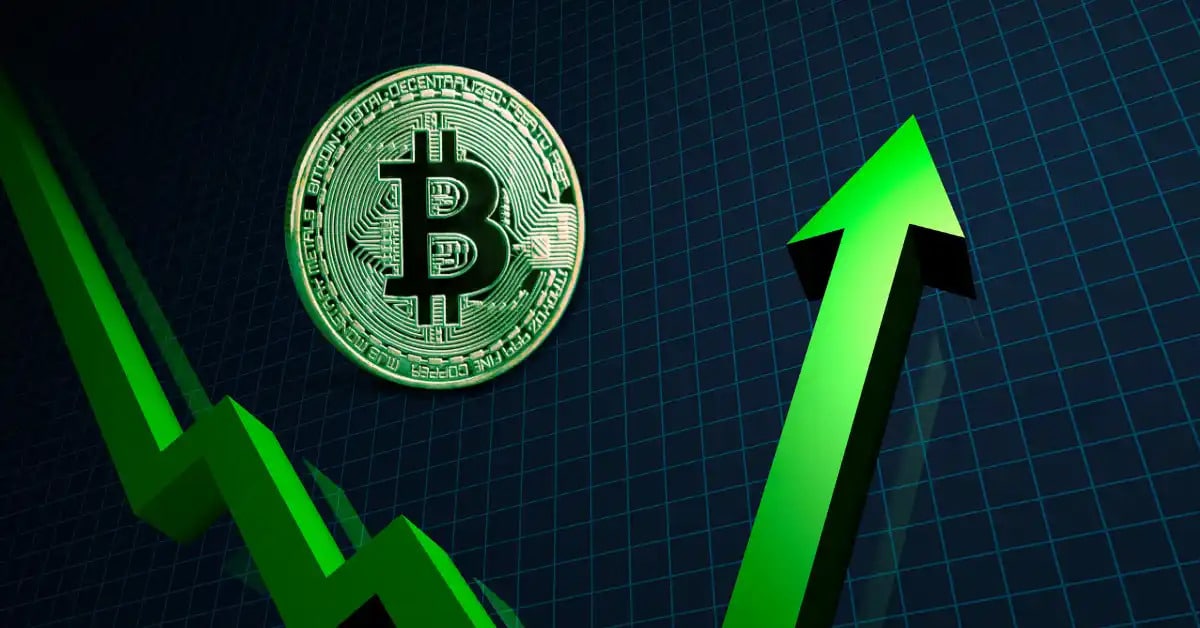
Bitcoin attempted its fourteen-day high on Monday, surging to a high of $88,527. It continued upwards, hitting fresh highs the next day. It broke above $90k for the first time in almost sixty days and continued upward, hitting a high of $93,928.

Trading actions since these two significant events were almost flat, as the apex coin failed to register any notable changes in price afterward. Nonetheless, it peaked at $95,857 on Friday, breaking its two-month high.
The massive increase the asset saw resulted in a more than 10% hike on the one-week scale. It is worth noting that several indicators are almost bearish following price actions over the last seven days.
BTC surged above its bollinger band on Tuesday and remained above it the next day. It trades below the mark at the time of writing. However, this may be in response to the massive buying volume it saw. A surge above the mark signified an impending reversal. This is what is playing out.
The relative strength index shows that BTC was almost overbought a few days ago. The metric surged to a high of 69. Nonetheless, the asset holds the $93k support amid the readings from these metrics.
ETH/USD
Ethereum’s massive surge on Tuesday ended the next day as the bulls failed to continue the uptrend. It surged from $1,538 to peak at $1,778. The one-day chart shows that the asset was unable to break above its fourteen-day high due to notable selling congestion around the mark.

Nonetheless, it closed with gains exceeding 11% and continued upward the next day, finally breaking the highlighted mark. However, ETH failed to hold on to the $1,800 mark during the session. It resumed its trend of low volatility over the next three days.
Trading action at the time of writing shows that the asset is trading close to bollinger upper band. It briefly broke above it a few days ago but returned below it. Its current price indicates that it is holding onto the $1,750 support.
Nonetheless, the relative strength index points to a notable decline in buying pressure. The increase in selling pressure has yet to significantly affect other indicators. However, the moving average convergence divergence hints at halting its uptrend. Its histogram displayed smaller bars in the last two days.
XRP/USD
XRP is experiencing a surge in buying volume, driving prices higher. The RSI rose from 53 to 60 over three days. The most recent reading from the metric is an improvement from its slight decline a few days ago.

The altcoin struggled to maintain its uptrend after Tuesday’s action, which saw it gain over 6%. It surged from $2 to $2.25 but retraced and closed above $2.20. It rose higher on Wednesday, reaching a high of $2.30, but then retraced to its opening price.
XRP has since grappled with reduced trading volume but is recovering at the time of writing. It broke above its bollinger band, slightly declined and trades below it. Nonetheless, MACD shows no signs of an impending reversal as it continues upward. It is worth noting that its histogram prints larger bars at this time.
XRP attempted to reach the 38% fib level but failed to hold it. Previous price movements suggest that the mark is critical as it holds notable demand concentration.
BNB/USD
The one-day chart shows Binance coin grappled with reduced trading volume over the last few days. Its most recent price movement is in contrast with the massive increases it registered during the first two days of the week.

It broke above the $600 resistance on Monday and peaked at its three-week high. However, it failed to stay above the mark, causing it to free-fall and return close to its opening price. Nonetheless, the uptrend continued the next day, with BNB surging higher.
The altcoin broke above $620 for the first time since March. The almost 4% increase ended the next day, with the asset losing more than half of the gains it had accumulated the previous day.
Nonetheless, a closer look at the asset shows it holding onto the $595 support amid a slightly bearish turnaround. However, indicators do not print a similar reading. The moving average convergence divergence hints at halting its uptrend. Its histogram displayed smaller bars in the last two days.
SOL/USD
Solana broke above a critical level on Tuesday after its sluggish start to the week. Like XRP, the asset surged on the second day of the session, rising from $134 to retest the $150 resistance. Although it failed ot break it, the test marked its first attempt in almost two months.

SOL has since trended almost sideways as trading volume dwindled, and the asset sees nearly equal buying and selling volume. Nonetheless, the altcoin held on to the $145 support amid slight declines. It’s worth noting that the MACD is currently negative. The 12-day EMA halted its uptrend, marking the start of a bearish convergence.


