
BNB briefly unseated SOL on the top 10 cryptocurrency market cap ranking. The flip happened as the altcoin saw tremendous price increases over three days.
At the time of writing, it is grappling with significant selling pressure. It prints a doji, reflecting the stagnant state of the crypto market. The global cryptocurrency market holds steady at $3.23 trillion and sees slight changes as several cryptocurrencies remain stable.
Several assets recovered during the last seven days, reclaiming lost levels. PancakeSwap was the top gainer during this period, gaining a whopping 50%. It saw massive increases as trading activity increased due to a recent integration with other blockchains.
The whales were notably busy accumulating more altcoins. Data from Santiment shows them stacking up ten new assets. Fasttoken (FTN) gained the most attention, with Okex token chasing behind. They bought more stablecoins, DAI, and tokens, wrapped ethereum. CAKE got a piece of the buying frenzy.
The announcement of FTX’s beginning payout made waves throughout the market. Investors believed the news might cause the FTX token to surge, leading to whale accumulation.
The crypto market remained relatively calm this week after the massive dips it experienced two weeks ago. Several top cryptocurrencies reclaimed key levels but failed to hold on to them. Let’s examine their performances.
BTC/USD
A look at Bitcoin’s one-day chart indicates that the apex surged but failed to break out of its rangebound movement. It kicked off Monday with a slight bullish trend, breaking above $98k. The next day, a massive retracement took place, causing a dip to the previous levels.
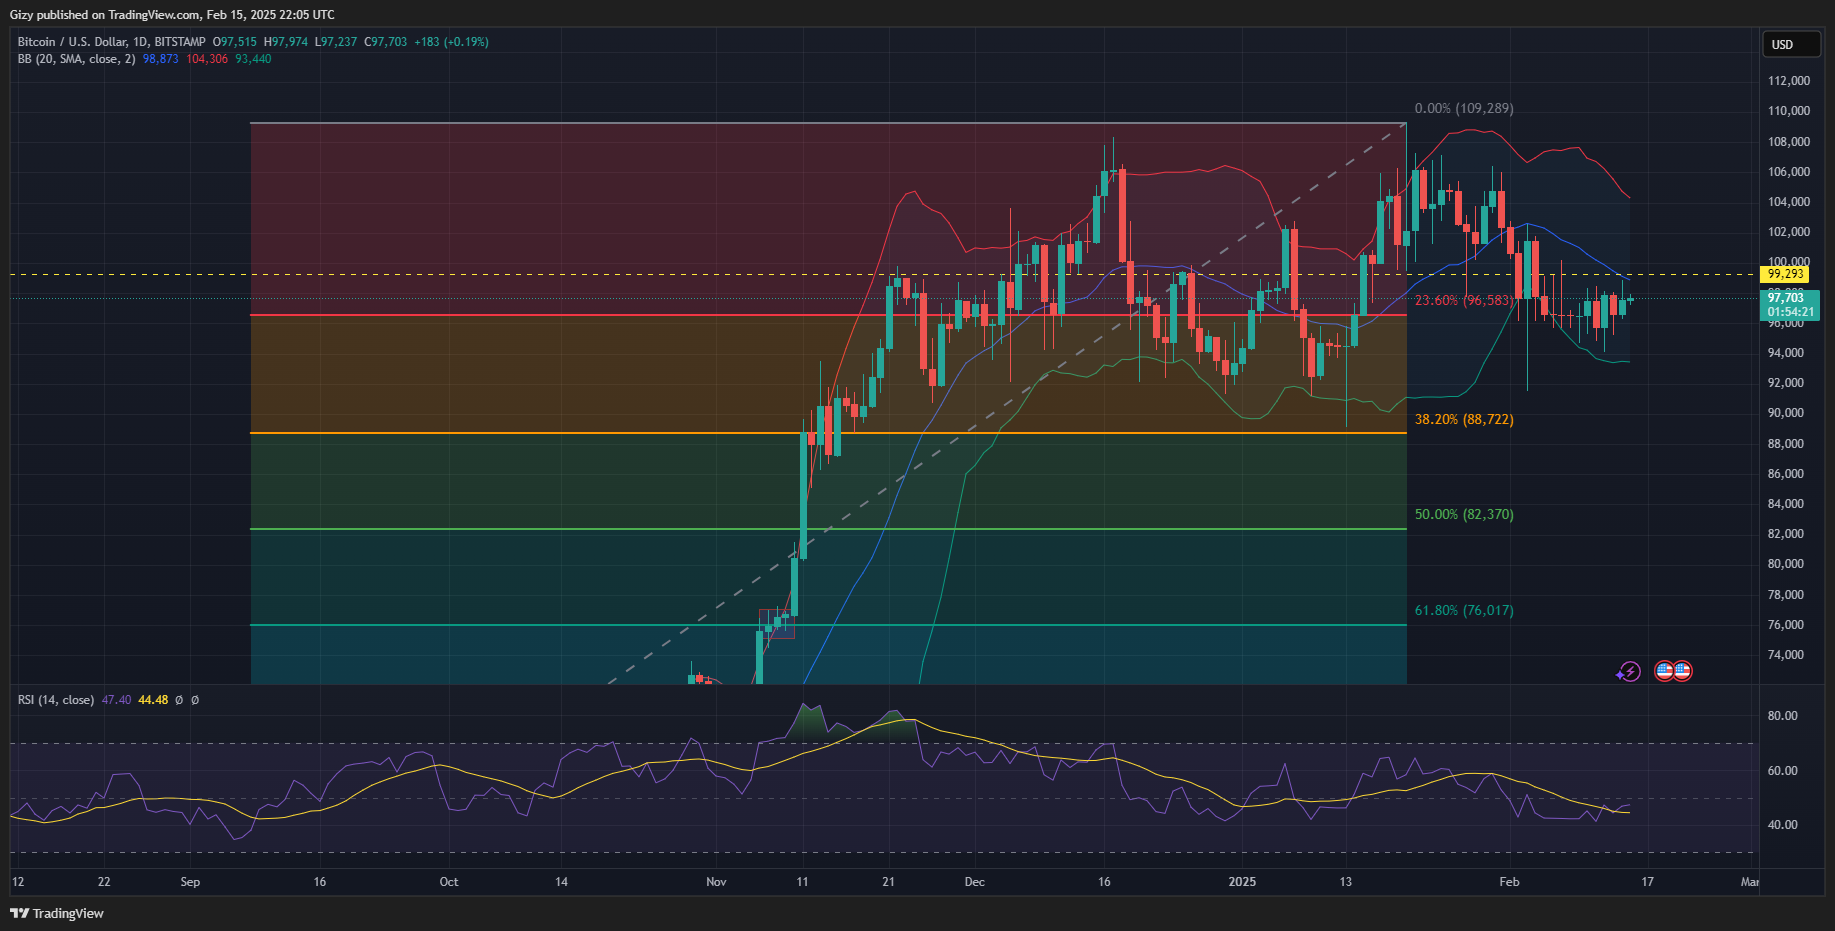
The largest coin continued the back-and-forth as it rebounded from another massive decline to $94k on Wednesday but recovered, gaining over 2%. BTC saw slight price changes over the last 48 hours. However, it failed to break out of its rangebound movement.
The apex coin slightly improvement over the last six days, gaining almost 2% on the weekly scale. Data from CryptoQuant shows the reason for the sluggish price improvement. The asset sees notable selloffs over the last seven days. Exchange reserves are slightly higher than they started the week, with investors moving more assets.
Nonetheless, indicators on the one-day chart are slightly positive as the bears appear exhausted.
ETH/USD
Ethereum is up almost 3% since the week started. Nonetheless, the one-day chart shows the bulls locked within a price range. Prices are relatively stable on this scale as the coin grapples with low trading volume.
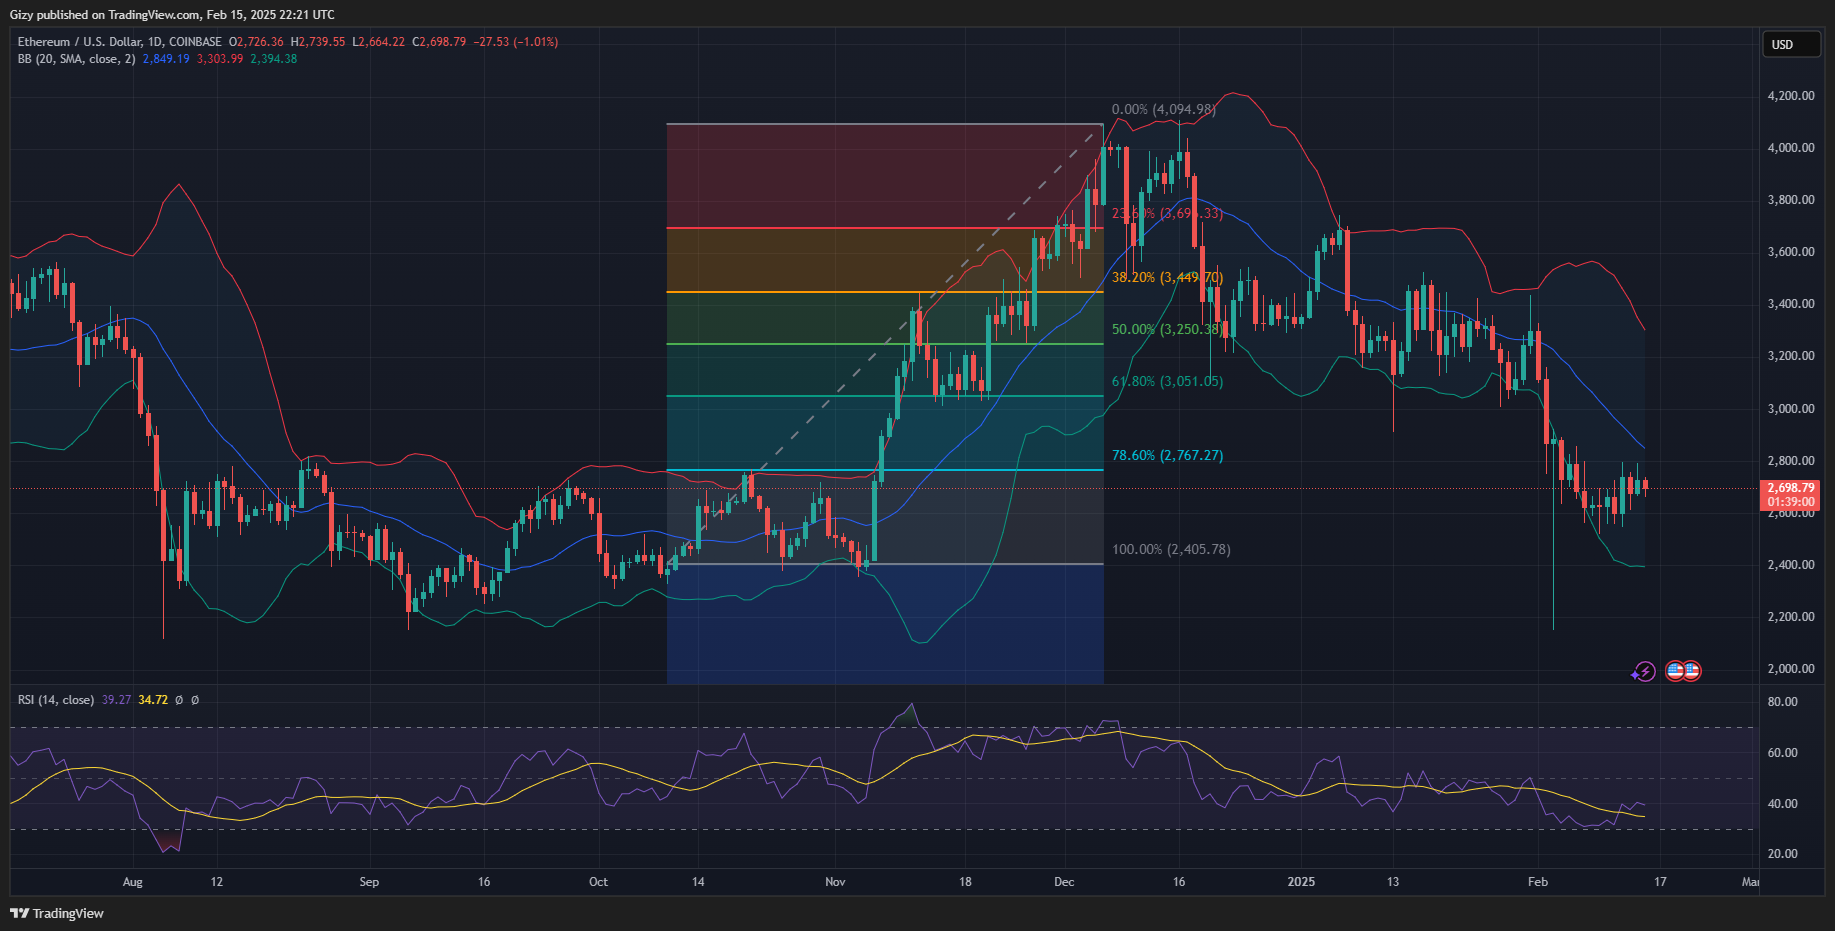
The latest price trend comes amid a significant increase in new addresses. It opened Monday with a notable bullish push, surging from a dip to $2,560 to a green close. It surged higher on Wednesday, opening at $2,602 and retesting $2,800.
The first attempt at the $2.8k barrier failed to yield results. Its next attempt occurred on Friday, with the asset edging closer to the mark. Nonetheless, price actions over the last three days show the asset hitting a new level in its rangebound movement.
The relative strength index indicates a significant increase in buying volume over the last six days. ETH trades closer to bollinger’s middle band.
SOL/USD
Solana price actions over the last six days shows it’s grappling with notable selling pressure. The bulls appear almost powerless against the ongoing bearish trend as the asset registers another red candle on the weekly scale.
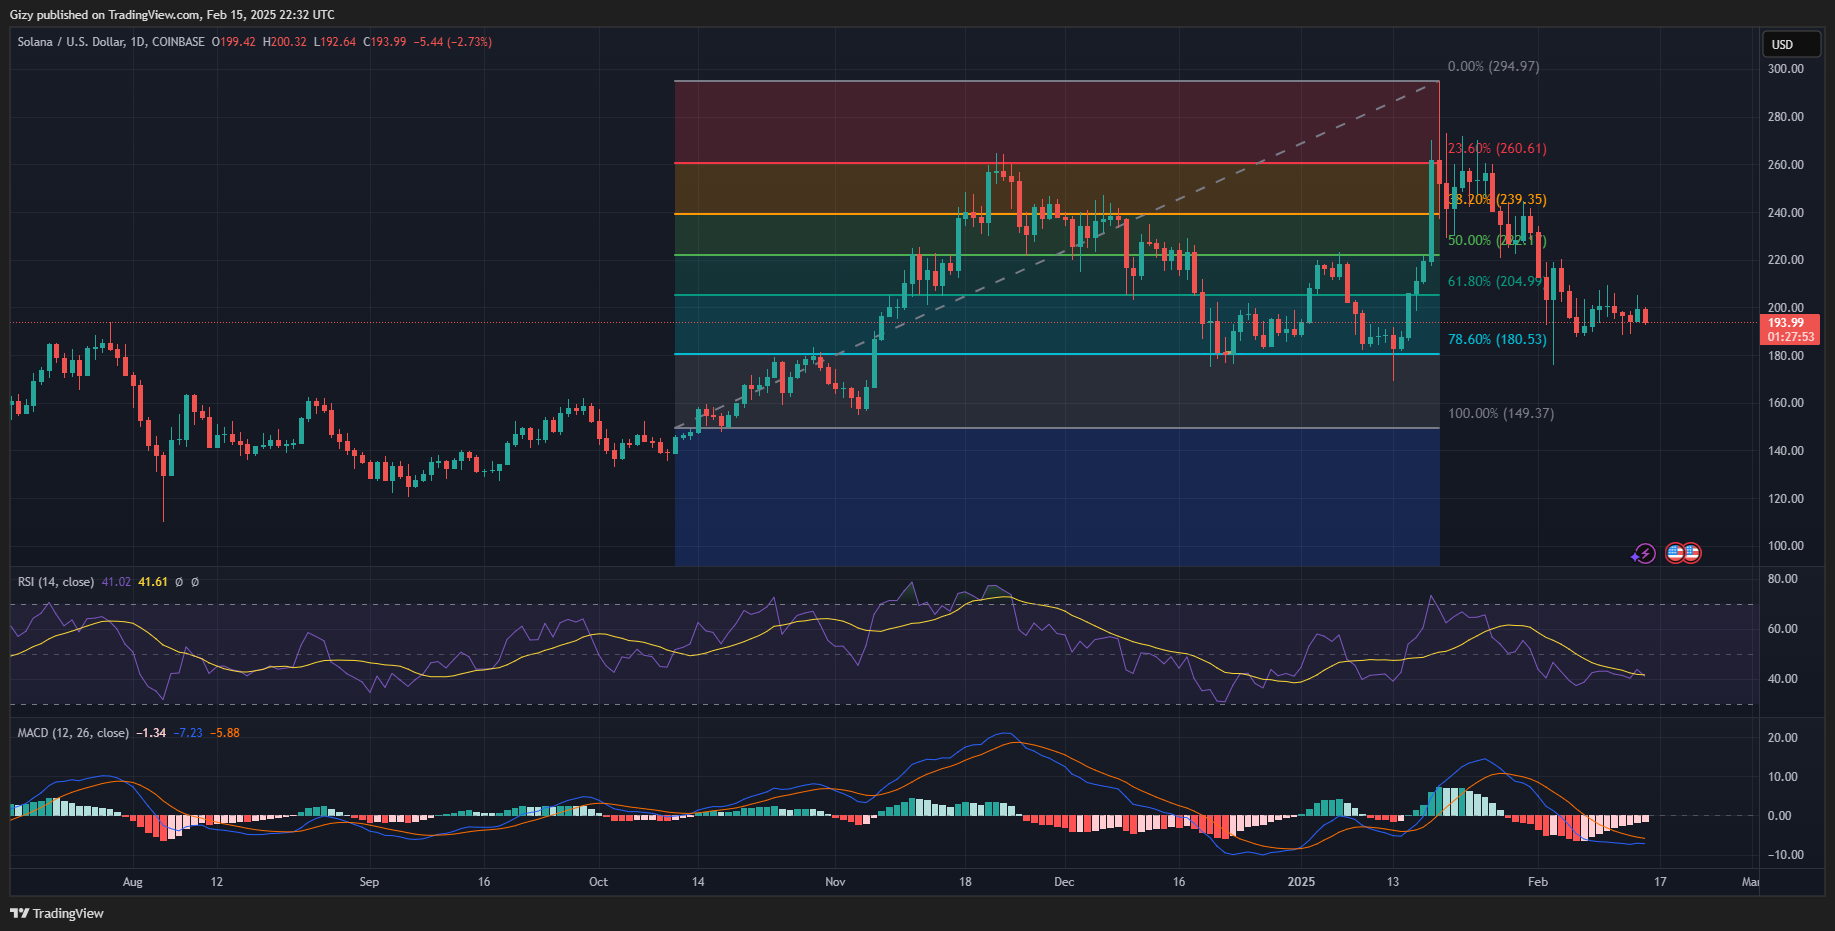
It may close 3% lower than it opened the week. Wednesday and Thursday were some of the most bearish for the altcoin. It opened trading at $197 but slipped to a low of $186. It recovered and repeated the same trend the next day.
RSI slightly dipped as selling pressure mounted. Nonetheless, the moving average convergence sheds a ray of hope among traders. The 12-day EMA is closing the gap between it and the 26-day EMA. The ongoing bullish trend shows an impending price uptrend.
BNB/USD
Binance coin is 7% higher than it opened the week. It had a bullish start to the period under consideration, breaking several key levels.
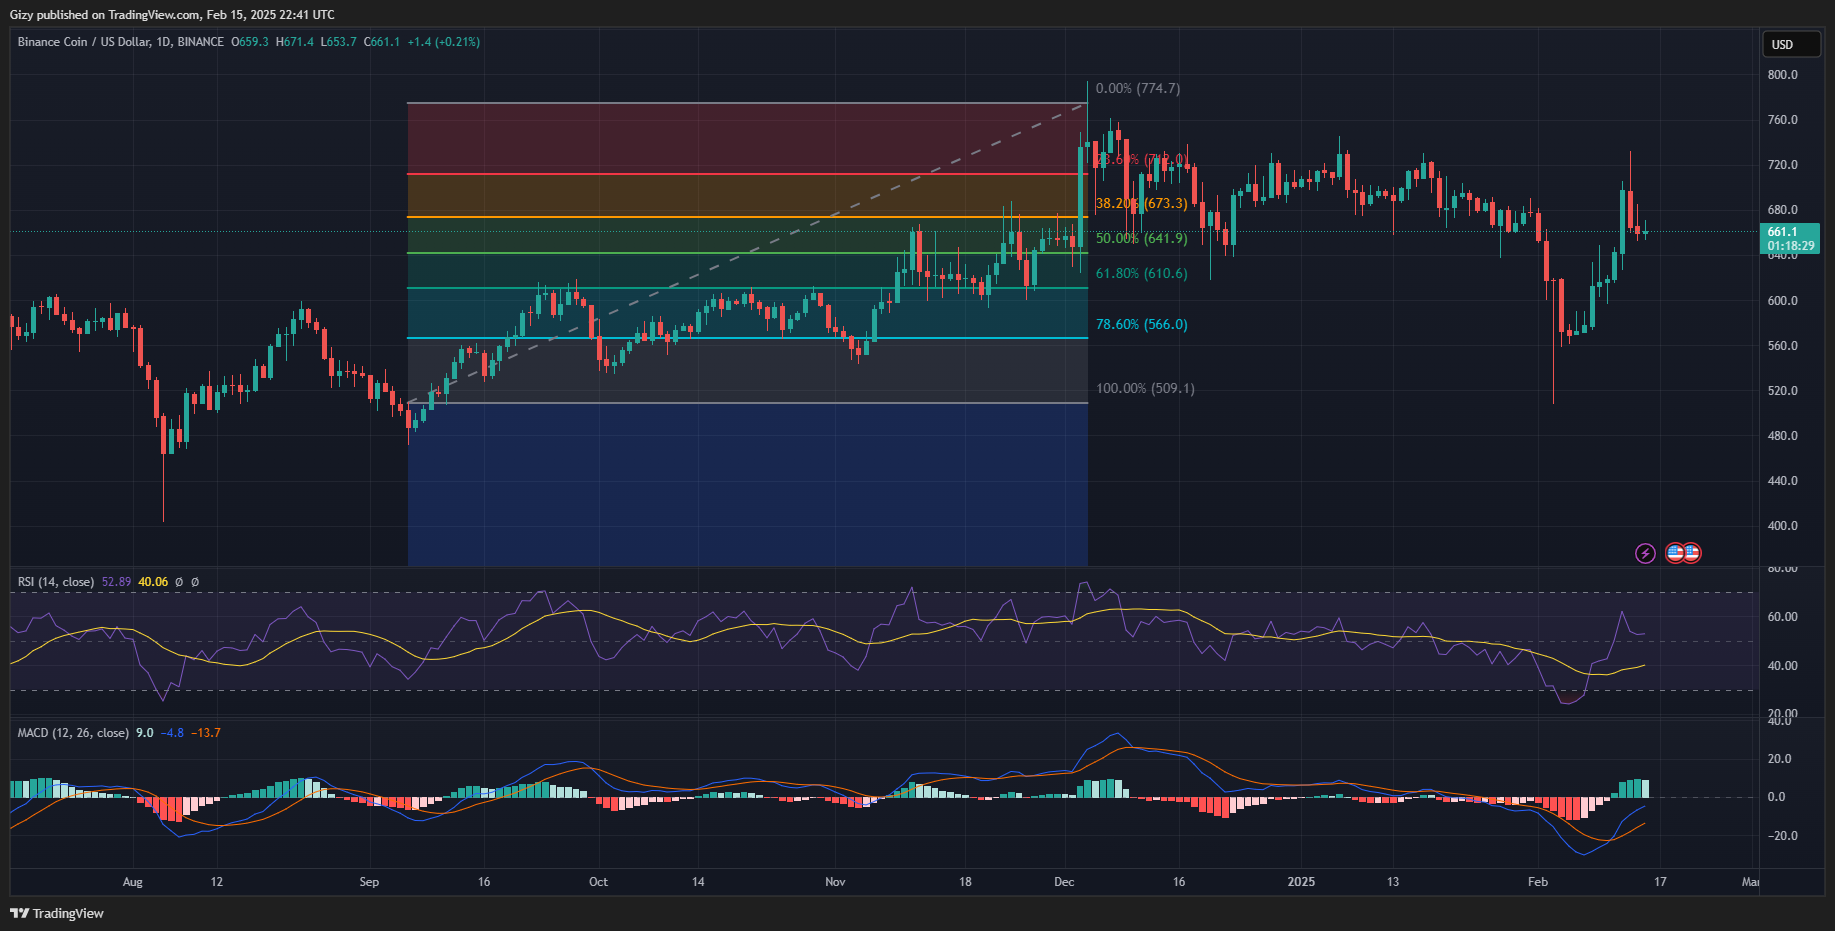
It opened Monday, printing a candle with a small green candle as it recovered from a dip to $596 from $616. The buying pressure increased the next day, resulting in an almost 4% increase.
Wednesday was the most volatile for BNB as it broke a critical level. It opened trading at $641 and shot up, breaking above $700. The altcoin gained over 8% and peaked at $705. Price actions after this massive hike were significantly bearish.
However, indicators remained bullish. A few days ago, the MACD displayed a bullish interception. The 12-day EMA continued upward amid the two-day decline.
DOGE/USD
The one-day chart shows Dogecoin trending in an ascending pattern. As a result of this trend, it trades significantly higher than it opened the week.
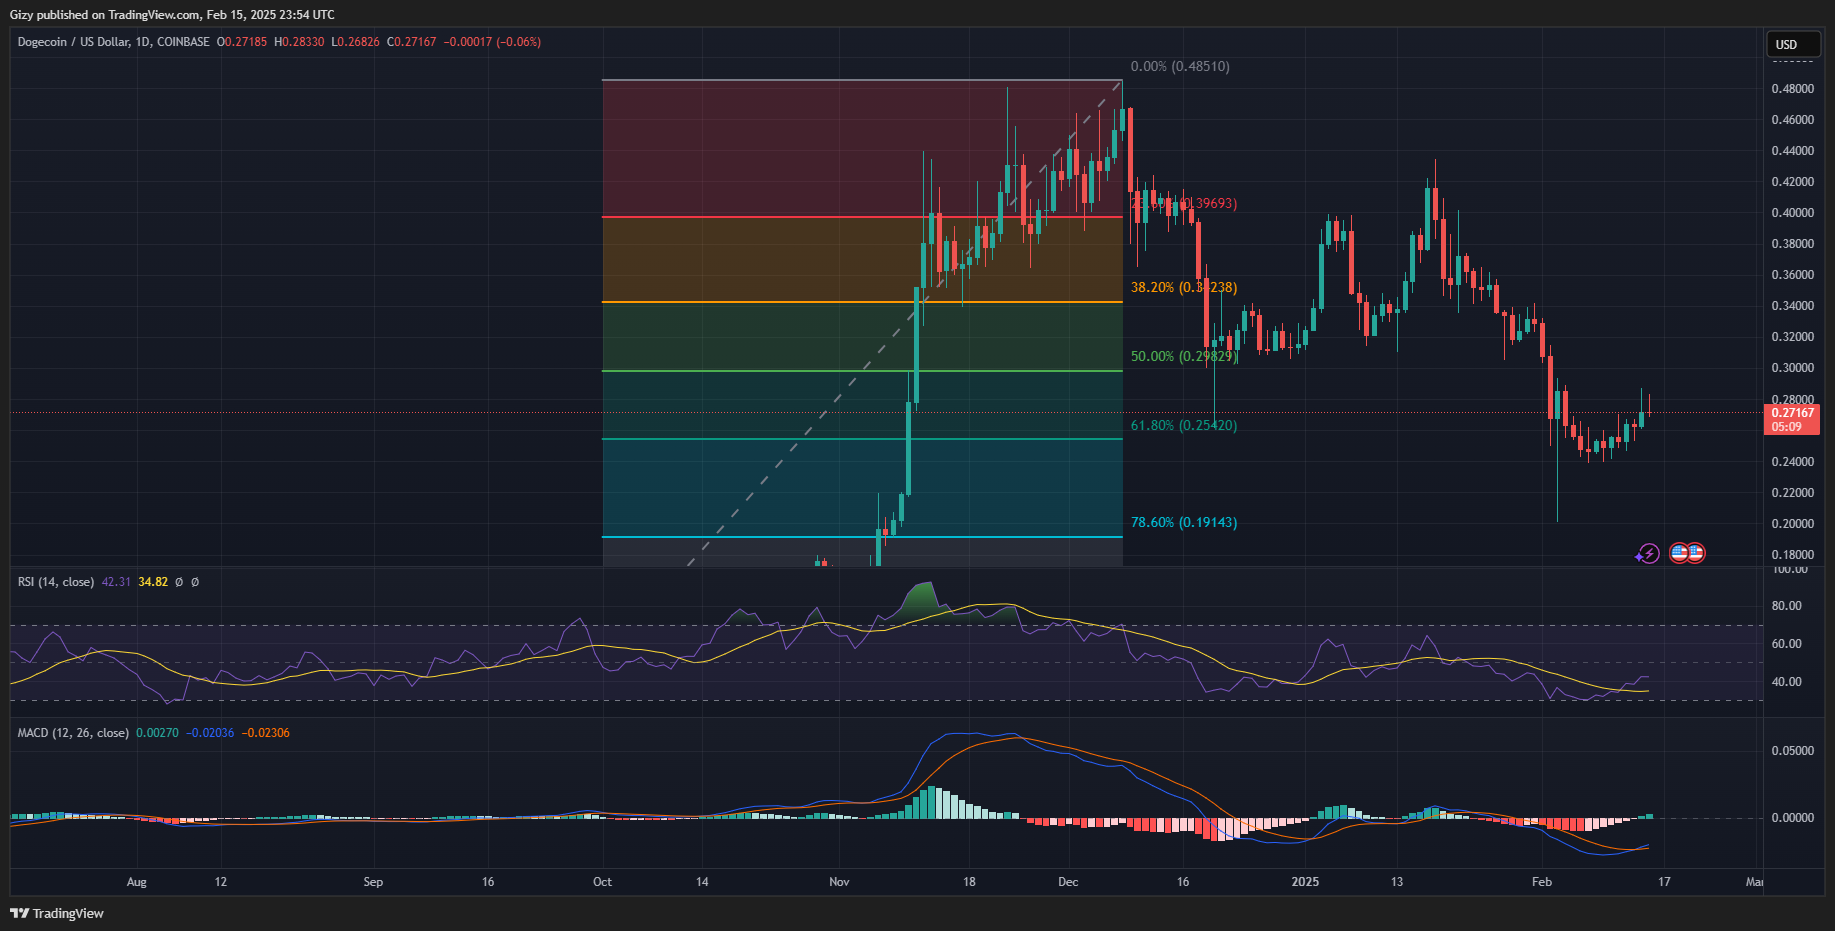
It opened the session at $0.24 but slipped lower before rebounding. DOGE surged to a high of $0.28 but trades at $0.27 at the time of writing. The asset registers its first green candle after three weeks of consistent decline.
The moving average convergence divergence prints buy signals in reaction to the bullish trend. A few days ago, the 12-day EMA intercepted the 26-day EMA from below. MACD’s uptrend and ongoing positive divergence hint at further price increases.
The relative strength index was 30 a few days ago as selling pressure neared its peak. However, it is at 42 as buying pressure spiked.
ADA/USD
Cardano trades at $0.78 as it failed to sustain uptrends above the $0.81 mark. After breaking above the highlighted mark, the one-day chart shows it grappled with significant selling congestion.
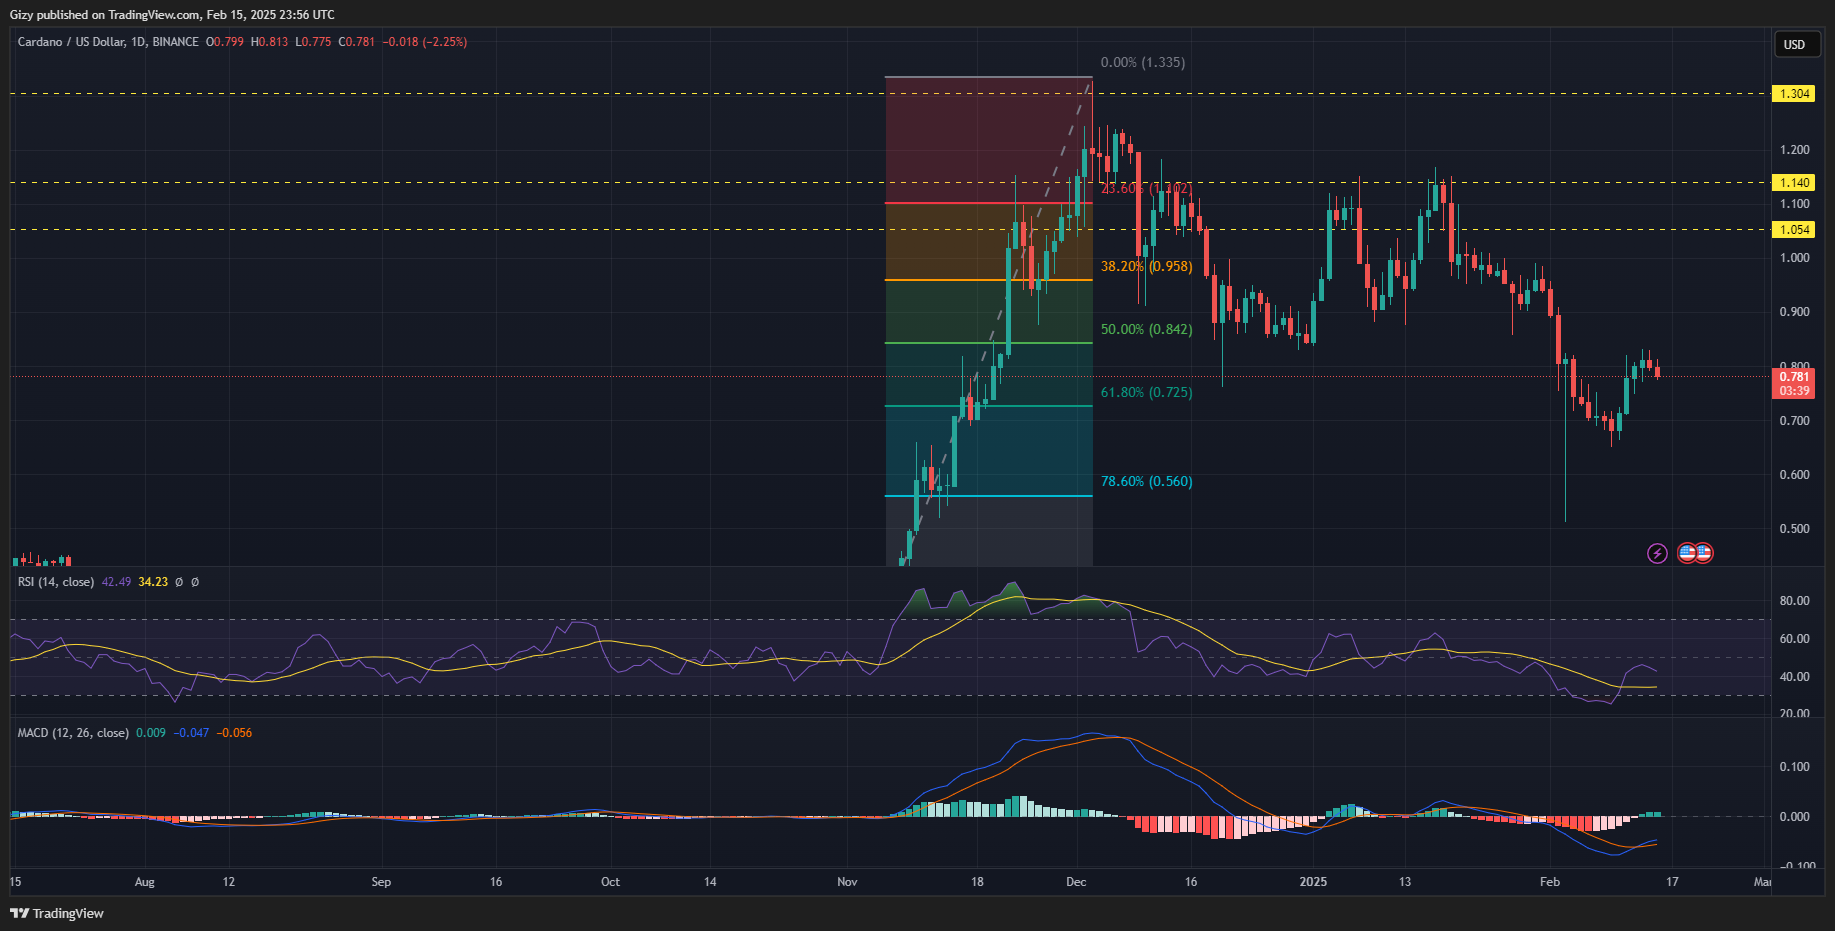
Nonetheless, it maintained its uptrend for most of the week. It saw a good start to the session, recording gains exceeding 4% on Monday. The upticks continued on Tuesday as the asset registered its most enormous surge. It opened the day at $0.71 and flipped the $0.80 mark, peaking at $0.82. It closed with gains exceeding 9%.
The moving average convergence divergence prints buy signals in reaction to the bullish trend. A few days ago, the 12-day intercepted the 26-day EMA from below. MACD’s uptrend and ongoing positive divergence hint at further price increases.
The relative strength index was 30 a few days ago as selling pressure neared its peak. However, it is at 42 as buying pressure spiked.
