
BNB has been on a parabolic run for some time now, registering one milestone after another and surpassing them. Its latest run is no surprise as it coincides with the broader bullish stance of the crypto market.
Nonetheless, the asset received a fresh boost from fundamentals, adding to the upward momentum. A few days ago, the news of the possible lifting of Binance’s three-year compliance imposed by the US DOJ made the rounds. If approved, the authorities may ease regulatory and compliance pressure on the exchange.
Investors bought into the news, stacking more BNB as they expect fireworks. Price reacted positively to this action, seeing one of its biggest surges of the month. The coin opened Sep 16 (when the announcement became public) at $920 and peaked at $959.
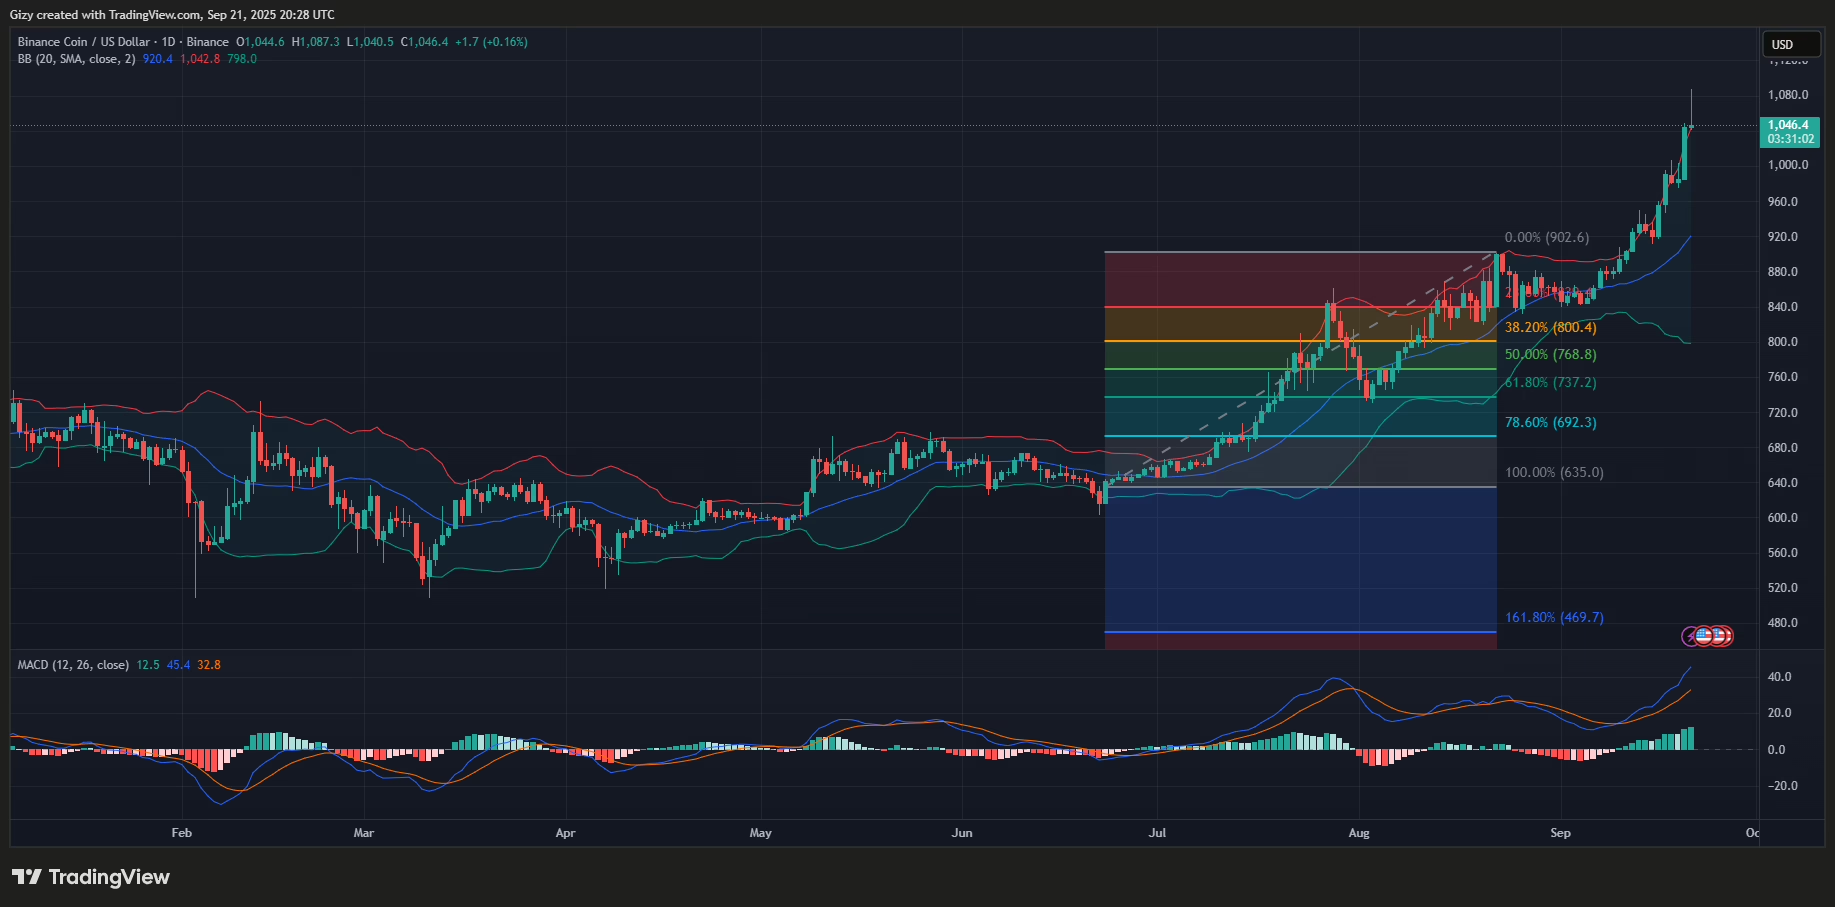
The altcoin continued its upward trend the next day, following the Federal Reserve’s rate cut announcement, surging to a high of $995 and breaking above $1,000 for the first time on Thursday.
BNB’s uptrend is not done as it climbed even higher on Saturday, peaking at $1,048. Additionally, it registered a new all-time high of $1,087. However, it plummeted and trades at its opening price.
Nonetheless, the latest parabolic run, coupled with its subsequent retracement, raises concerns about when corrections will begin. A closer look at trading action on Sunday indicates that the asset has not seen such a massive retracement after a new ATH since the climb started. It may reveal a growing selling appetite.
In other cases, many cite the fact that the upward run has become protracted and that the asset is due for retracements.
It is worth noting that although several cryptocurrencies are experiencing slight selloffs, there is no indication that a bear market has arrived. This means that investors remain bullish on several assets, and BNB is one of them.
Drawing Parallels From Previous BNB Parabolic Runs
Aside from the fact that investors are still accumulating, drawing parallels with previous price movements provides some telling signs that may indicate the end of the run.
Trading action in early 2024 holds the key to revealing the first signs to watch. BNB started its massive climb on Feb 7 and continued the run until Mar 15. The asset gained over 113% during this uptrend before retracing.
Another parabolic run occurred between Dec 1, 2023, and Dec 27 of the same year, resulting in a 35% increase. It is also worth noting that the asset saw another bullish period between Jan 1 and Feb 4 of the same year.
In all of these runs, one thing is clear: the uptrend could last a month. On average, each one lasted thirty-two days. By contrast, BNB’s latest bullish period started on Sep 5 and is ongoing at the time of writing, barely sixteen days.
The second signs that the uptrend is coming to an end are candlestick patterns. During the previous runs, BNB mostly lingered close to a resistance and retraced after failing to break above it. On the other hand, it also gradually lost momentum on several occasions.
BNB is not exhibiting any of the outlined signs. At sixteen days, its latest uptrend is far from the average, suggesting a high likelihood of further increases. Additionally, the asset has not encountered or lingered close to any levels at the time of writing. However, its recent drop may be a sign of dwindling momentum.


