
Ethereum began October at $3,847, and investors were significantly optimistic about how prices would perform throughout the month. As a result, trading action during the first 6 days of the session was bullish.
The first day saw the coin surge from $4,145 to $4,358, ending the day with gains of almost 5%. The next day, ETH experienced reduced upward momentum but still closed with a 3% increase. Oct 6 marked the last day of the alt trend as the coin saw a 5% dump the next day.
The decline continued and worsened on Oct 10 when the coin retraced from $4,370 to a low of $3,510. Although it rebounded, the session ended with losses exceeding 12%.
It saw a slight pullback two days later but lost momentum and retraced afterwards. A repeat of this event occurred within the last 10 days, as Ethereum resumed its uptrend on Thursday but lost momentum on Monday and has since been in a downtrend.
ETH is edging closer to the end of the current week with losses exceeding 7% following its rebound at $3,676. Nonetheless, it is seeing a notable increase on Friday and may end the day with the first green of the seven-day period.
Nonetheless, the altcoin is edging closer to ending the week with losses exceeding 7%. A look at the 1-week chart showed that the asset was bearish in three of five weeks.
ETFs Remain Solid Amid Selloff
The ETH exchange-traded fund saw massive outflows as selling pressure spread and ended some days with more outgoing liquidity. Data from Sosovalue shows that the largest outflow occurred on October 10, when the net exit exceeded $428 million.
However, the investment fund saw massive growth in the first six days of the month. As a result, it may end the 30-day period with a net inflow of $620 million. Compared to September, ETFs are closing strong following significant interest.
Away from ETFs, the clamor of an altseason in October went unanswered as the asset experienced several bearish events. It started with Donald Trump’s tariff on China, and progressed until the announcement of no assured rate cut in December.
However, there were positive fundamentals. One such is the rate cut and the possible end of quantitative tightening by the Federal Reserve. The US was able to secure deals with the Asian giant to end the trade war. Additionally, Ethereum saw significant buying from institutions, with Bitmine buying the dip.
However, these positive events failed to yield the expected result. Investors expected the last week of the month to erase all the losses incurred earlier. News of no rate cut in December overshadowed the other positive fundamentals.
What Will Ethereum Do in November?
Ethereum is heading into another month more bullish than the current one. On average, it gains 6.58% in November, slightly higher than the average 6.32% for the tenth month. Going with this assertion, it is easy to conclude that the apex altcoin may register significant increases in the next 30 days.
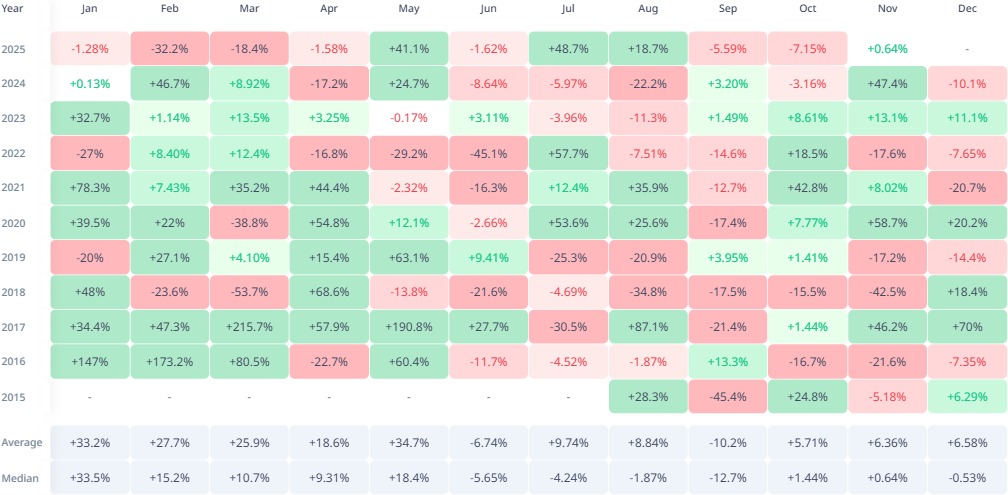
Nonetheless, a look at how high the coin may go reveals that its highest gain during the session under consideration was 58% in 2020 and its highest decline 42%. The chance of such replaying in the next month is reduced, but its average 6% looks more viable.
On the other hand, there are occasions when action in October affected the next month. For example, in 2016, when Ethereum declined by 16% in the tenth month, it lost over 21% during the 30 days. In 2018, it lost 15% and then 42% the next month. However, this does not always mean that prices will always trend this way.
There are instances where prices went in different directions in both months. In 2019, when the asset increased slightly in October, massive losses followed in the next month. A similar event happened in 2022, while the reverse happened in 2024.
Summing it all up, there is a 50% chance that November may be bearish based on trading actions in the previous month.
Ethereum At the Crossroads
Recall that a previous analysis stated that over the past three weeks, Ethereum has experienced notable declines. Despite this, the asset has consistently formed higher lows during the period.
An examination of the bollinger bands indicates that ETH recently bounced near the SMA, mirroring a similar move just hours ago that pushed prices higher. Sustaining its latest low would preserve the altcoin’s bullish structure. Maintaining support at the middle band on the 1-week chart suggests that Ethereum is unlikely to fall below $3,800 in the near term.
It concluded by saying that slipping below the level will see the altcoin drop as low as $3k. Ethereum slipped below $3,700 a few days ago but rebounded. As a result, it broke the previous trend of higher lows. Additionally, it broke below the SMA.
While low may be less concerning, it is important that the asset ends the week above the middle band, or risk further declines.
Aside from the bollinger bands, the relative strength index shows why the current week’s close is important. On the 1-week scale, the metric is trending close to a key rebound level at 52. Further price declines will see it slip below this critical mark.
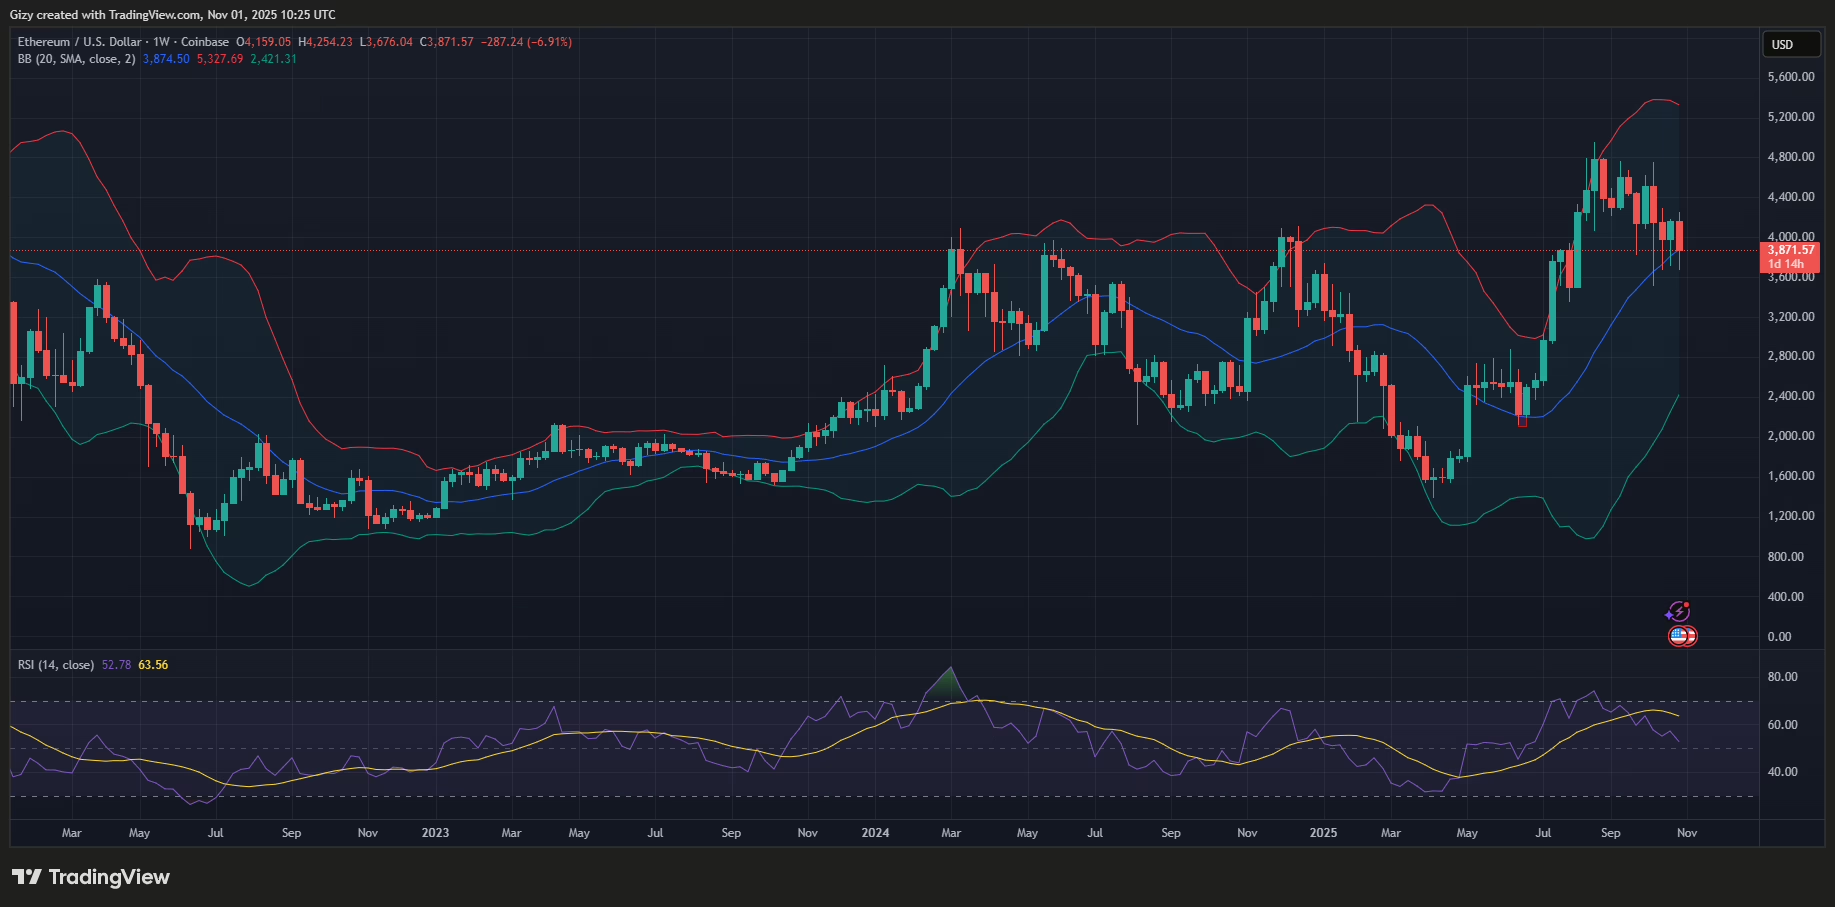
If the recent decline continues and the RSI fails to reverse at the highlighted mark, its next level may be 46. This means that prices will likely drop even lower, possibly to $3k.
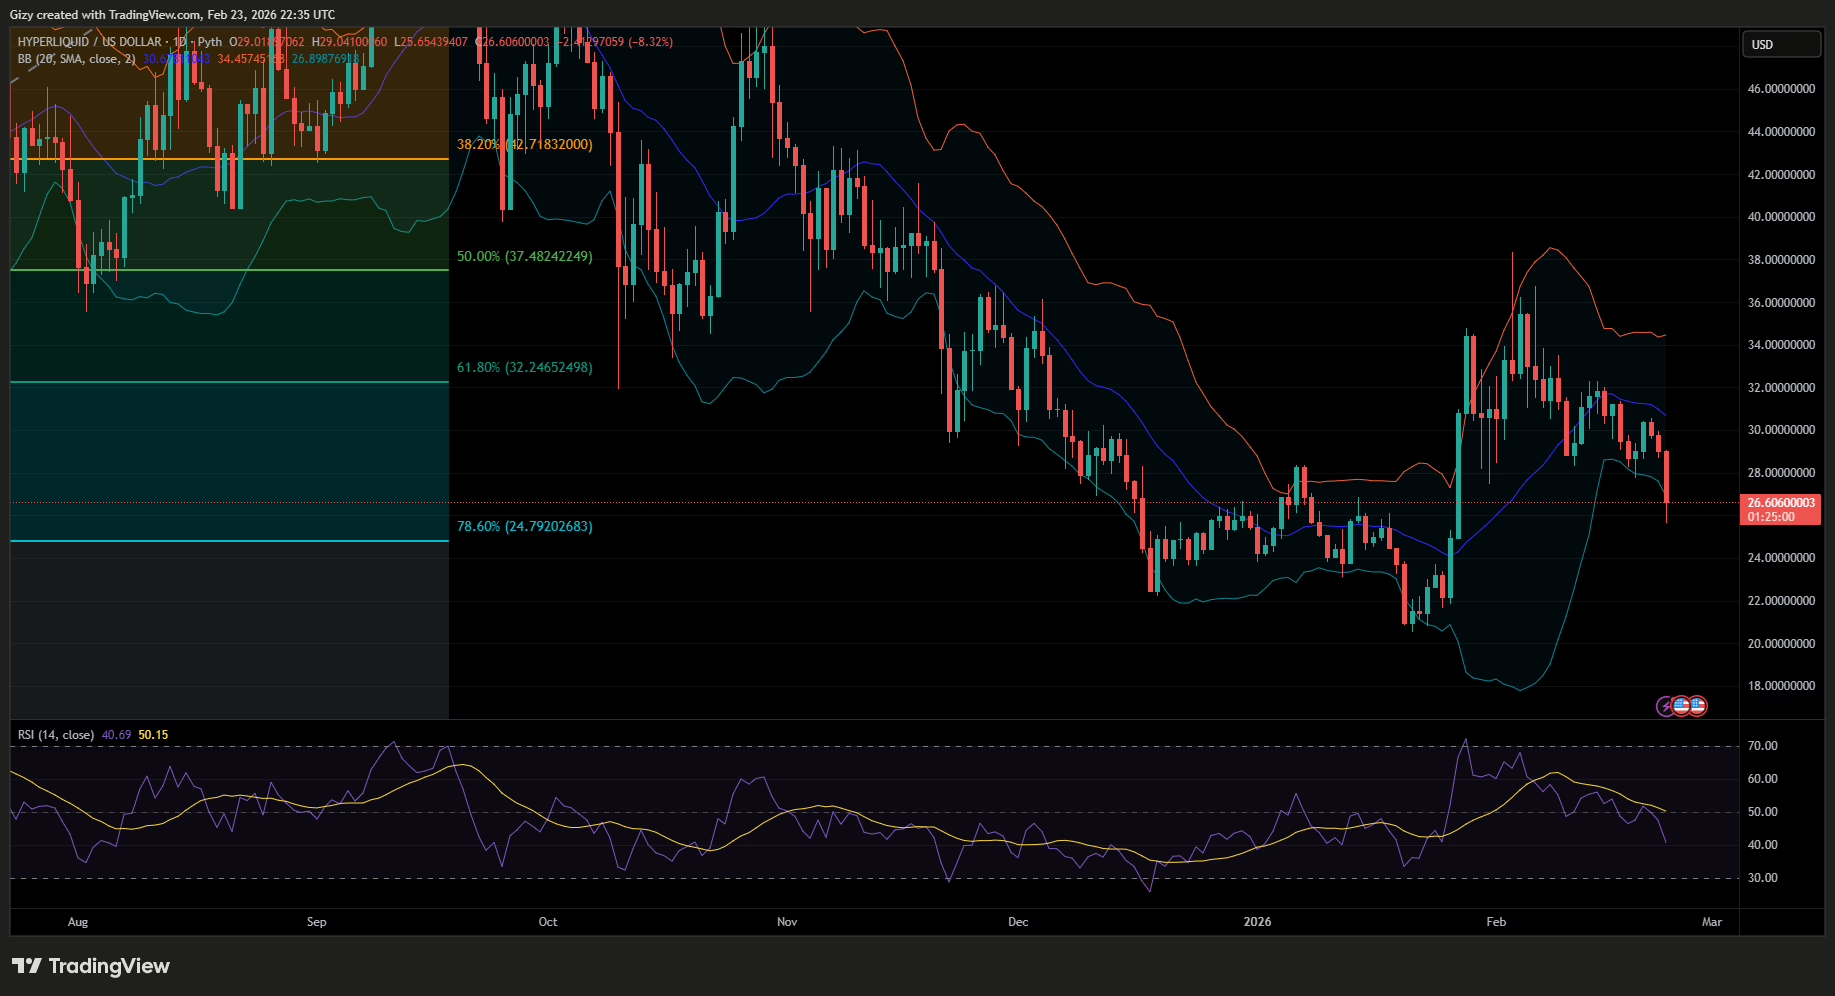
Indicators on the 1-day chart are also flipping bearish. For example, the moving average convergence divergence displays a near-complete bearish crossover. Ethereum may see notable selling pressure once the divergence happens.
The apex altcoin is trading at $3,845 at the time of writing. It may retrace below $3,700 again in the coming week if selling pressure persists. However, the coin may rebound after its bearish start to November. A retest of the $4k resistance may follow after a recovery.
In summary, the current week’s close could determine whether the next month will be bullish or bearish.
Get Trending Crypto News as It Happens. Follow CoinTab News on X (Twitter) Now


