
XRP grapples with slight selling pressure at $2.98, indicating a slip from $3. Nonetheless, its current price means that it remains close to the critical mark.
The altcoin experienced its largest retracement on Friday, dropping from $3.07 to $2.98. However, the latest retracement follows the two-day uptrend the coin experienced midweek.
XRP is edging closer to sealing its third consecutive day of consistent declines. This raises the question of whether the bulls are still in control and if prices will plummet further.
Recent data from Glassnode indicates that, despite the latest correction, the coin remains positive on a broader scale. The slip below $3 has met no strong reaction from traders as the asset remains within a key accumulation level.
During the price trend between July and early August, the cryptocurrency saw notable selling pressure. It retraced from $2.95 to $2.72 on the second day of the previous month, but rebounded the next day. However, it retraced below $3 again on the 19th and remained rangebound between the mark and $2.80 before slipping lower in the days that followed.
Price movement during this period showed that XRP saw notable accumulation between $3 and $2.70. The price pattern also indicates that the bullish structure is intact as prices surged after trading between these levels.
4-Hour Chart Calls End to Downtrend
The 4-hour chart reveals that XRP is trading near a critical support level. The $2.94 barrier has held out since Sep 8 due to notable demand concentration. However, previous price movements suggest that a decline below the mark will likely result in a further drop to $2.70.
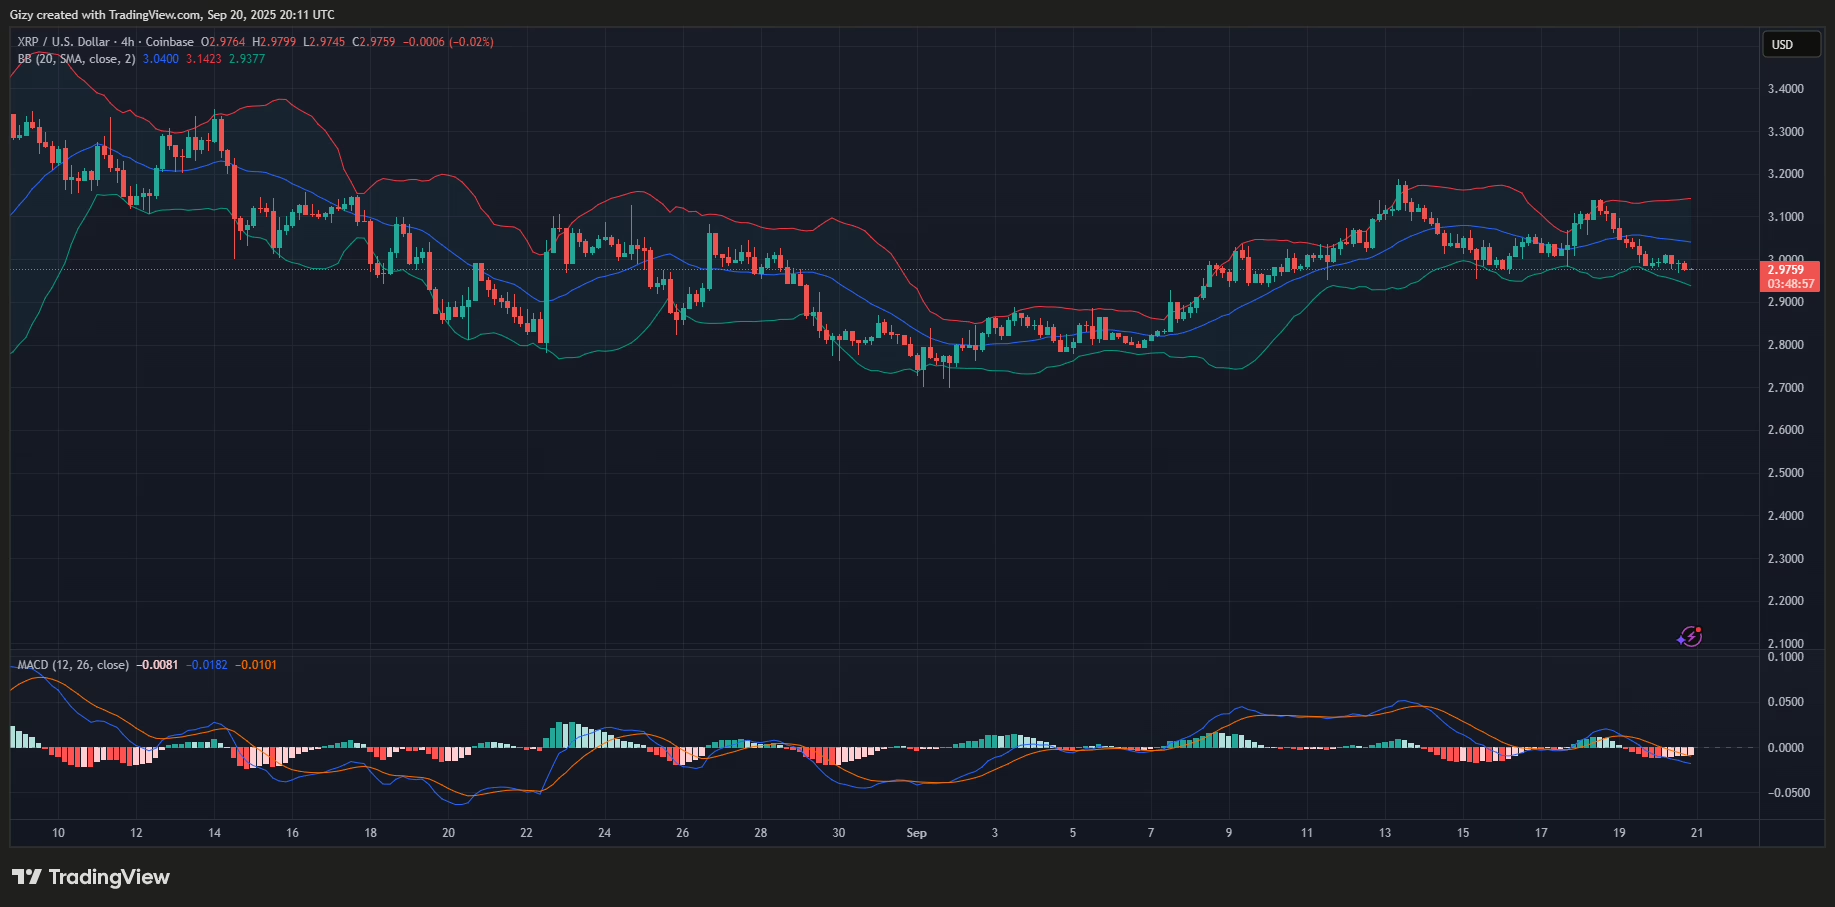
Nonetheless, the 4-hour chart indicates that the altcoin may rebound at the highlighted mark in the coming hours. The bollinger bands depicted a breakout a few days ago, resulting in a drop to the lower band. The lower sits at $2.94, adding to the support’s strength.
The moving average convergence divergence aligns with assertions that the downtrend is nearing its end. Its histogram printed progressively smaller candles over the last 8 hours and prints one at the time of writing. Its recent trend indicates an ongoing bullish convergence.
XRP May Plummet Lower
Contrary to the readings from the 4-hour chart, the 1-day chart suggests further retracement. Indicators like MACD and BB are currently negative at the time of writing.
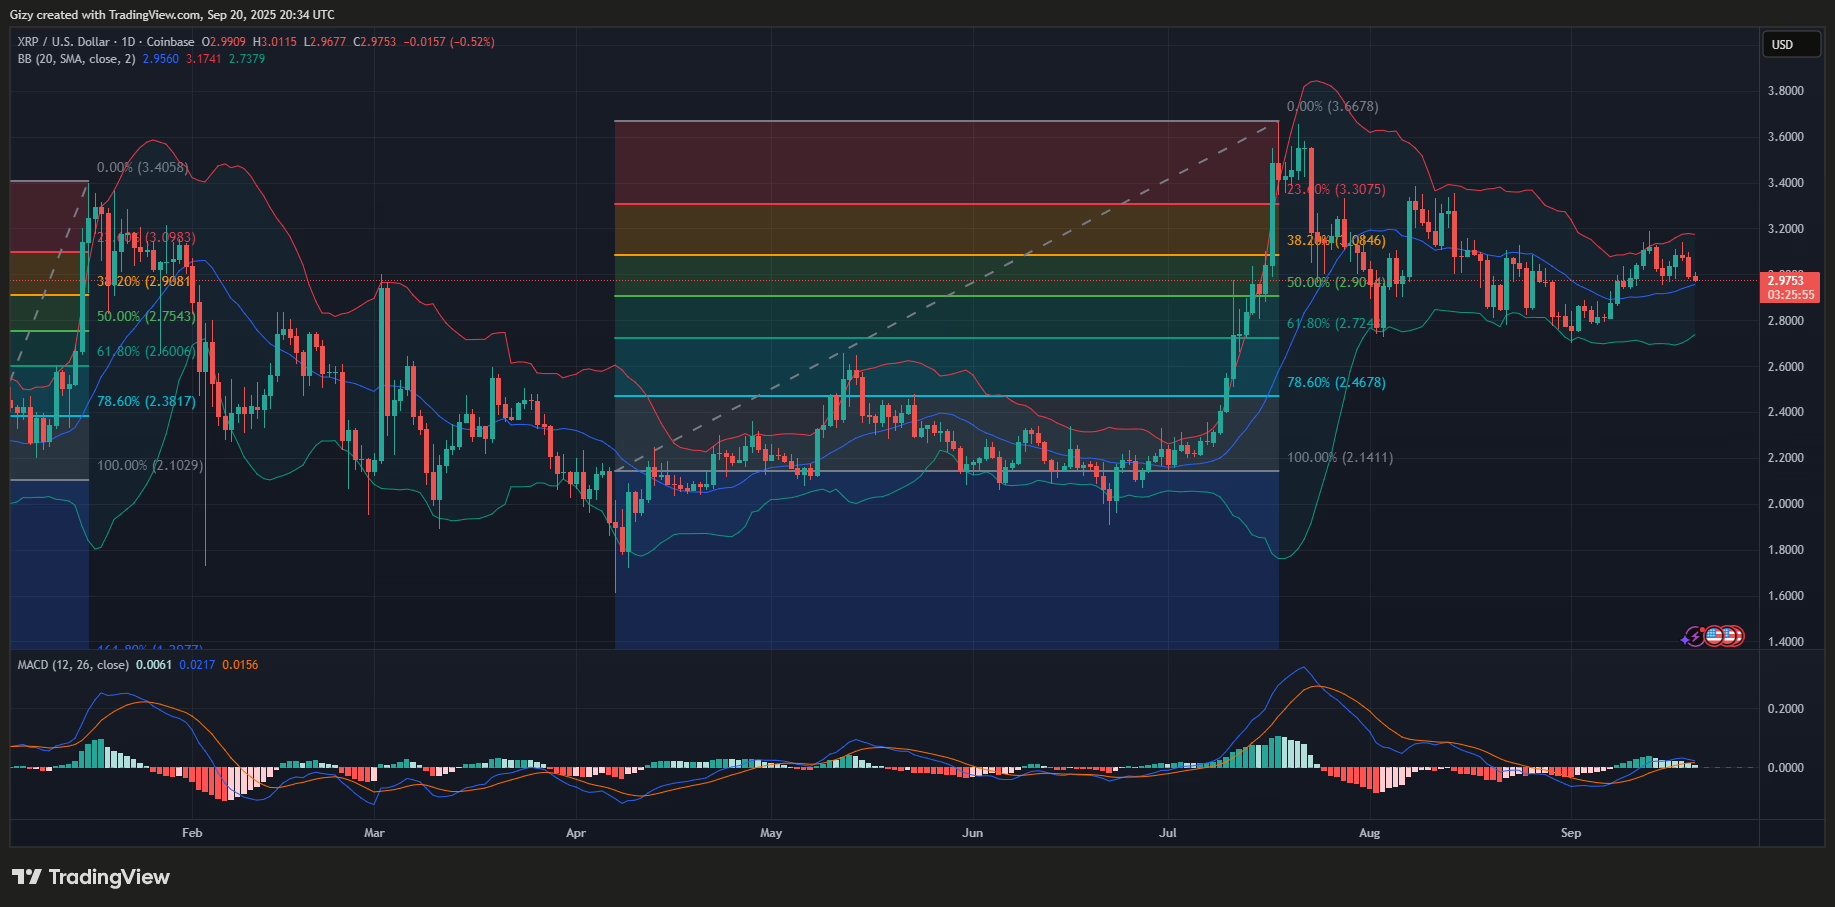
For the moving average convergence divergence, the 12 EMA started trending downwards on Thursday. It is slowly creeping toward the 26 EMA and will seal a bearish crossover in the coming days if current trading conditions persist.
Nonetheless, XRP broke out of the bollinger bands a few days ago, triggering the start of a downtrend. Although the asset had a two-day break, current prices indicate that the downward momentum has resumed. However, it has rebounded close to the middle band, and it’s edging closer to flipping, retesting it.
Previous price movements indicate an increased likelihood of a decline below the metric. The coin may continue to plummet until it tests the lower band at $2.73.
Nonetheless, the fibonacci retracement levels reveal that the asset is trading close to the 50% fib mark at $2.90, suggesting moderate demand concentration around this mark. The indicator also supports a drop to $2.70, with the 61% fib mark at $2.72.
Get Trending Crypto News as It Happens. Follow CoinTab News on X (Twitter) Now


