Ethereum is off to a good a start this week as it soars to a new high this month. It started the day at $2,580 but peaked at $2,686 as buying pressure spiked. The significant changes resulted in the asset gaining over 2% in the last eight hours.
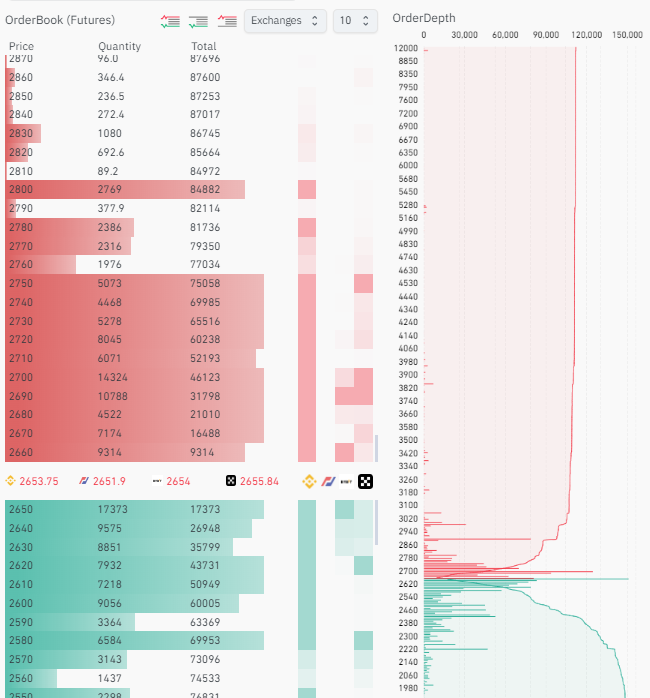
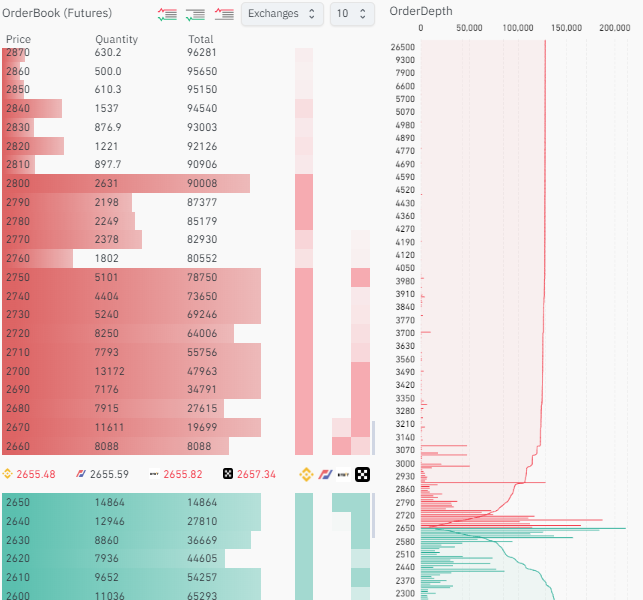
The apex altcoin climbed above its pivot point for the first time since August. The most recent surge saw the asset peak and revive hopes of further increases. Traders are now placing sell orders at $2,90 in anticipation of a possible surge.


The trend spans both the spot and derivatives markets, as seen in the chart above. It is also worth noting that the bulls are looking to see a quick surge, as there is notable demand concentration around $2,700.
Question about if the asking price could be the catalyst for a surge to $3k looms.
On-chain Data is Mixed
Aside from the stacking of ask orders at key levels, on-chain data point to the fact that the main drivers behind this trend are derivatives. Funding rates are increasing as traders pumped 4% higher fund than they did during the previous intraday session.
A bulk of the funding is from long positions looking to strengthen their positions amidst the uptrend. The BLS are edging, as most of the liquidation in the last 24 hours was from short positions. Due to this trend, more buy orders are being filled.
However, the spot market is filled with many bearish actions. On-chain data shows it is seeing less funding amidst the notable price increases. There is very little buying pressure from key regions. One such region is the Asian market. The Korea premium is currently negative. The same trend is also present in the US market: the Coinbase premium is also red.
Ethereum products including ETFs are also bearish as they see fewer buys. Despite the significant increases, the outflows are still significant.
The exchange netflow total in the last seven days is positive. This means that the largest altcoin is seeing increased selling pressure as some traders take profit. A prime example of such a trader is one who participated in the initial coin offering for ETH. The wallet recently unloaded 3,500 units on Kraken in a bid to take profit.
On-chain relative strength index says Ethereum is overbought and due for a trend reversal. It remains to be seen if derivatives will continue to push prices.
Ethereum Looks Positive On-chart
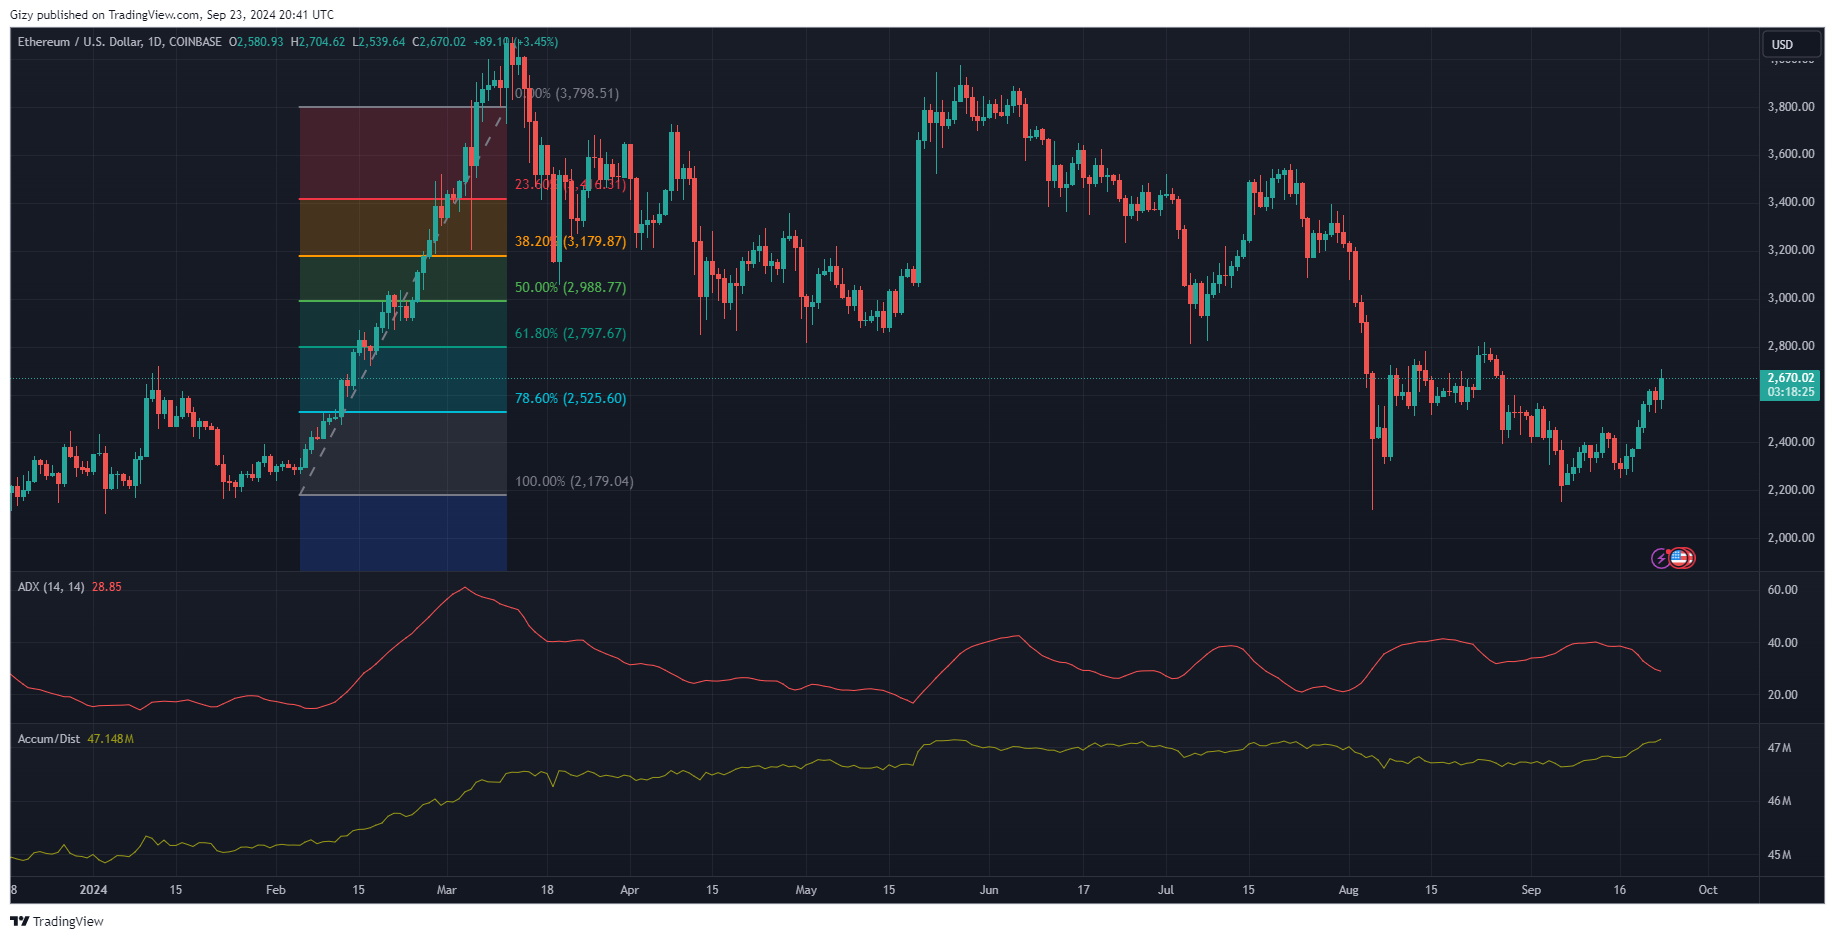
The one-day chart shows several bullish indicators. One such is RSI. The metric resumed its uptrend as buying pressure mounted. MACD is also on the rise in reaction to the current increases and shows no signs of an impending price change.

The momentum indicator is also on the rise as prices continue climbing. The same trend is present in the A/D chart, which shows serious accumulation from the bulls. However, negative readings are also present from indicators like the ADX and Bollinger bands.
Ethereum is currently trading above the upper band. This price movement is a sign of a possible trend reversal. The average direction index is also on the decline. The current uptrend is losing strength and may stop soon.
Currently exchanging above its pivot point, it is important for the bulls to defend this mark as a slip will result in further decline, as low as $2,400. Nonetheless, with the buy orders and positive indicators in mind, the asset may reclaim $2,700 in the coming days.
The fibonacci retracement levels points to a possible retest of the 61% fib level at $2,800 if the uptrend continues. The next level after it is the 50% mark at $2,988. With the ask orders around this mark, there is a high chance it flips.
