
Ethereum started August 29 at $2,528 and is exchanging at that price. However, it surged to a high of $2,597 as it faced rejections to its bid at $2,600. The asset soon saw notable declines, which saw it retrace and exchange at its opening price.
The altcoin failed to continue the previous day’s trend, which saw it rebound at $2,418 and peak at $2,555, closing with gains exceeding 2%.
ETH tested the $2,500 support a few hours ago as trading conditions worsened. It is at constant threat of a possible retracement below this key and exchanging at a crossroads. The question of how long until a breakout looms
Mixed On-chain Data
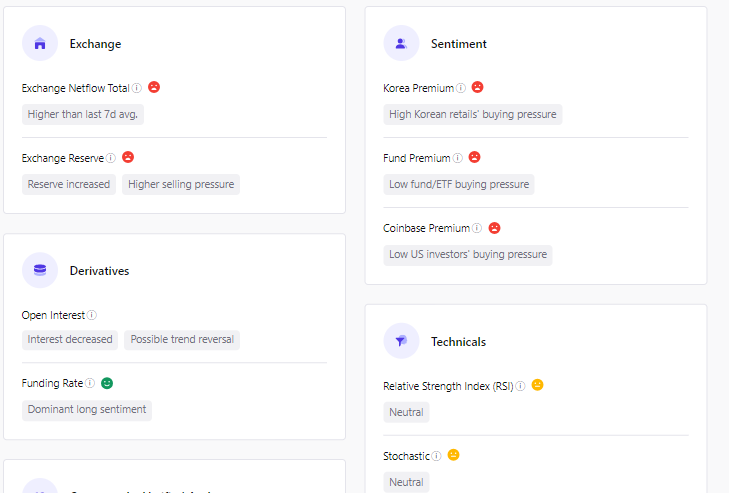
On-chain data provides a definitive answer as to the next price action. The metric points to the asset going down only as several indicators flipped bearish.
For example, traders have been selling and dumping their assets on exchanges over the last seven days. Exchange reserves are on the rise as ETH is seeing less bullish actions.
Source: CryptoQuant
The chart suggests that there are attempts by the buyer to soak up the excess supply starting August 24 saw notable success but halted over the last 24 hours. Fears of the dump continuing will spark further retracement as prices will react. The latest reading also indicates dwindling confidence in the asset as trading volume dropped by over 22%.
Attesting to the low confidence in ETH, several key markets are bearish. One such is the Asian market. Funding rates from the continent remain negative. Although the trend lingered for a while, it is worsening, and other regions are joining.
For example, ethereum products are seeing less investment buying volume decreases. Nonetheless, US traders are also bearish. Coinbase premium is negative at the time of writing.
On the other hand, derivative traders are hopeful of a trend reversal in the coming days. Funding rates remain strong despite the growing bearish sentiment. More traders are willing to pay more for the altcoin, and the price may react. The taker buy-sell ratio is also positive to this effect.
How Long Until Trend Reversal?
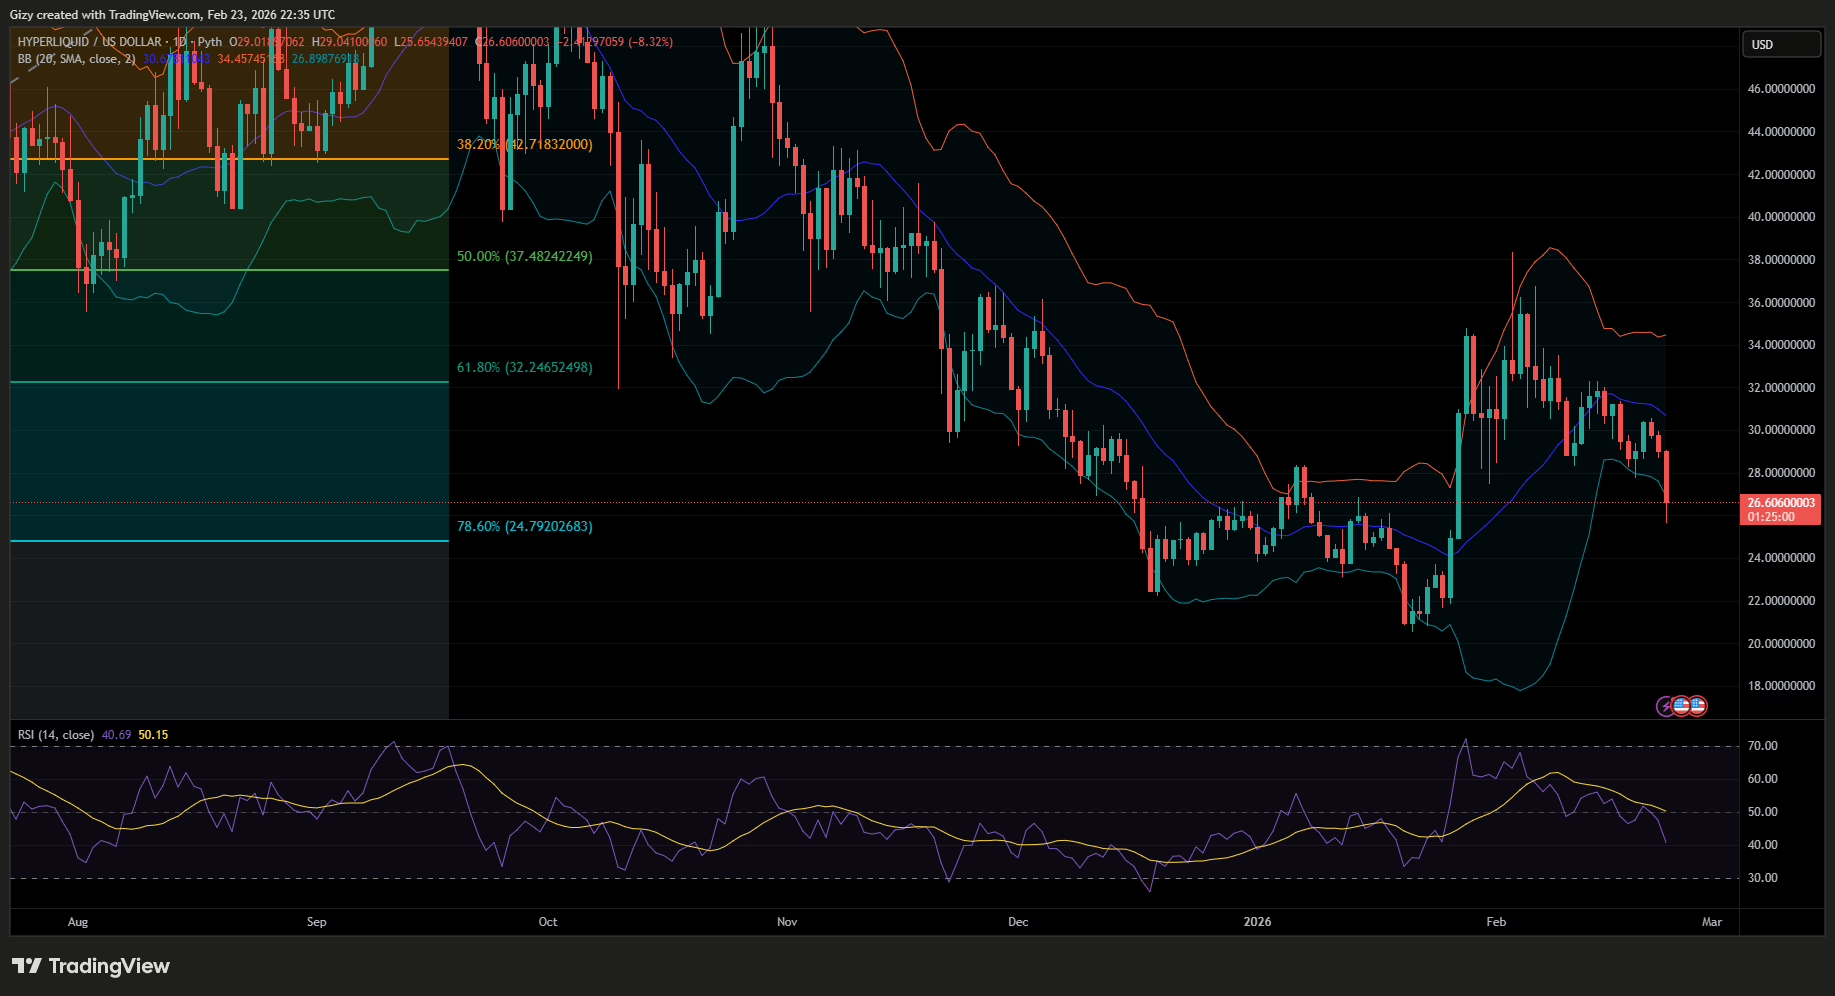
The one-day chart points to the continuation of the ongoing trend. There are also chances it will get worse. At the time of writing, the moving average convergence divergence is printing sell signals. The 12-day EMA is close to the 26-day EMA, indicating a negative convergence. A small increase in selling volume will result in the start of a divergence.
MACD’s readings suggest that ETH will see further price declines in the coming days if trading conditions do not improve. Nonetheless, RSI maintained trends around 39 over the last 48 hours. While the ongoing movements point to the asset seeing almost equal pressure from the bulls and bears, it is also indicative of an impending breakout.
It is worth noting that Ether is exchanging at a critical level. Trading at $2,522, it is on the 78% Fibonacci retracement level. It provided a strong support due to significant demand presence.
The narrowing of the trading channel also indicates an impending breakout.
Ethereum May Retest $2,400
It is important to keep the price above $2,500, as a slip could send the apex altcoin lower. Once critical support breaks, $2,400 is the next barrier to watch. Previous price movements also suggest that the bulls may defend this mark, as ETH rebounded off it twice this week.
The second largest coin spent the last four days trading close to the second pivot support. Following several slips, the bulls regained control above. The chances of this action continuing for an extended period are high.
The Fibonacci retracement suggests that Ethereum may slip as low as $2,200 once it loses the 78% mark. Coupled with MACD’s reading, a further downtrend from the current price is more likely.
Get Trending Crypto News as It Happens. Follow CoinTab News on X (Twitter) Now


